. 2014 Mar;44(3):785-93.
doi: 10.1002/eji.201343767. Epub 2013 Dec 27.

Strength of TCR signal from self-peptide modulates autoreactive thymocyte deletion and Foxp3(+) Treg-cell formation

Affiliations

Strength of TCR signal from self-peptide modulates autoreactive thymocyte deletion and Foxp3(+) Treg-cell formation

Andrew J Caton et al. Eur J Immunol. 2014 Mar.

Abstract

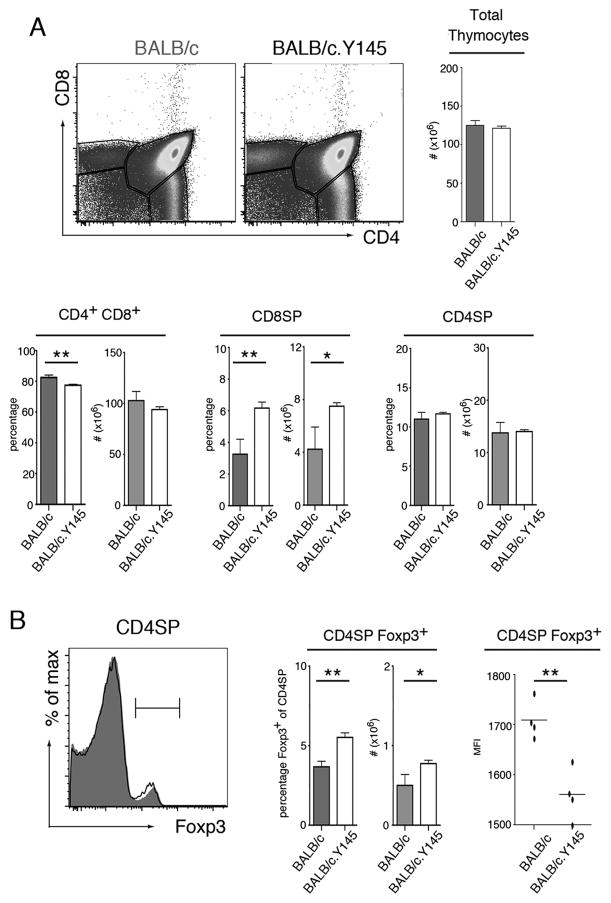
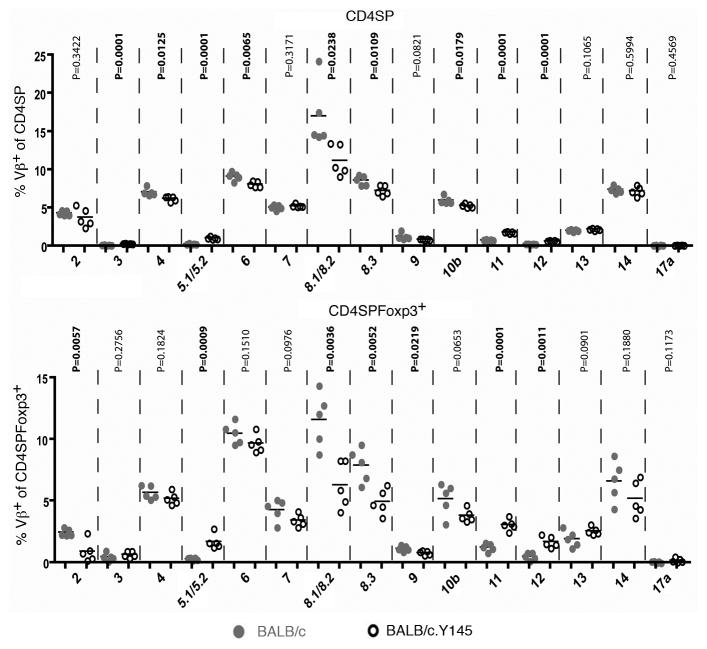
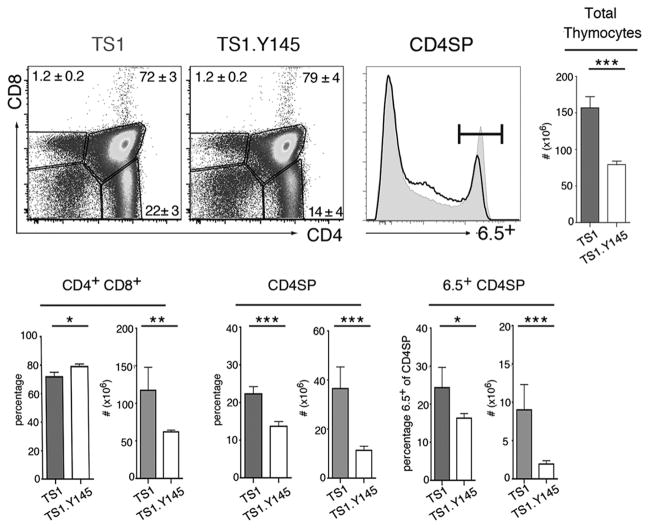
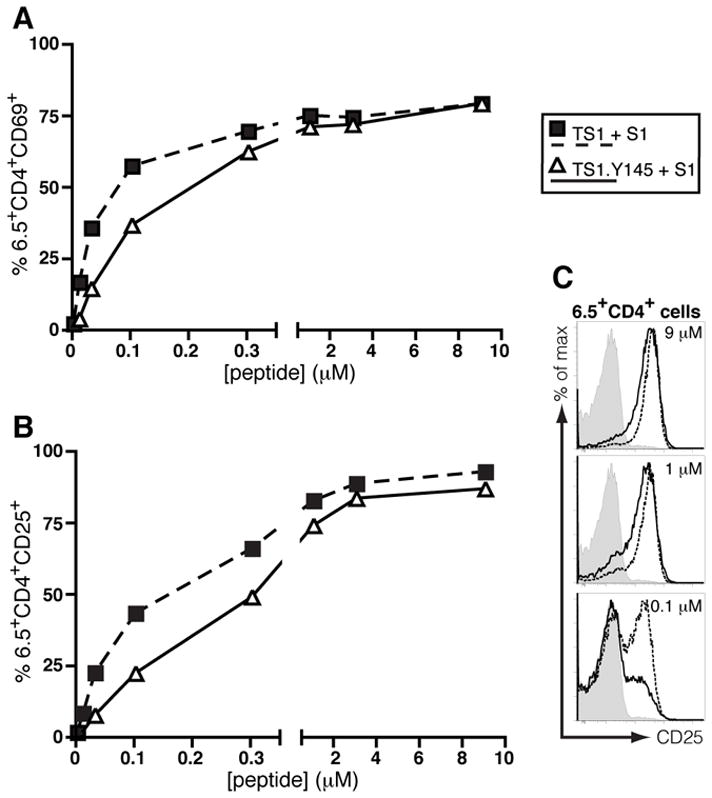
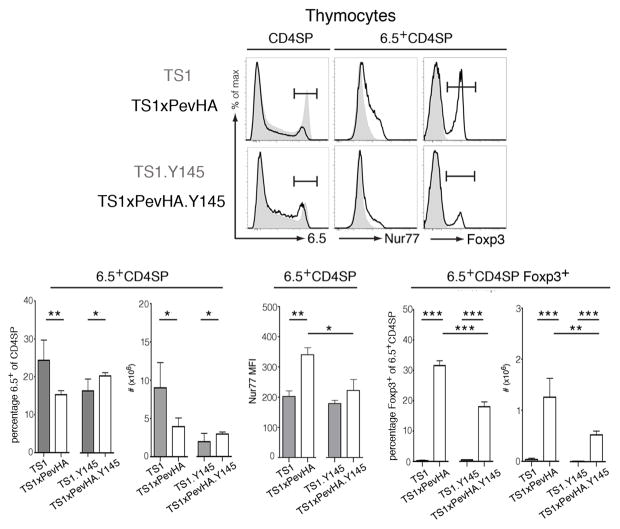
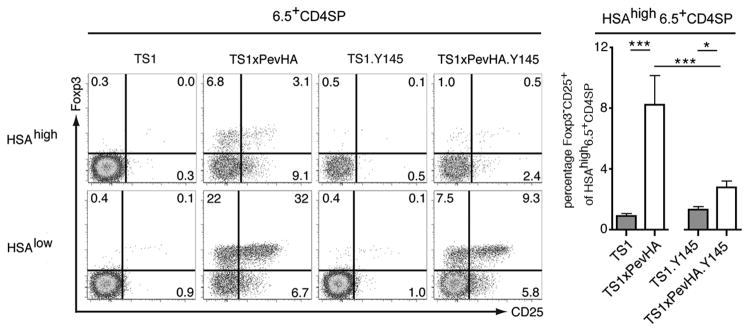
Autoreactive CD4(+) CD8(-) (CD4SP) thymocytes can be subjected to deletion when they encounter self-peptide during their development, but they can also undergo selection to become CD4SPFoxp3(+) Treg cells. We have analyzed the relationship between these distinct developmental fates using mice in which signals transmitted by the TCR have been attenuated by mutation of a critical tyrosine residue of the adapter protein SLP-76. In mice containing polyclonal TCR repertoires, the mutation caused increased frequencies of CD4SPFoxp3(+) thymocytes. CD4SP thymocytes expressing TCR Vβ-chains that are subjected to deletion by endogenous retroviral superantigens were also present at increased frequencies, particularly among Foxp3(+) thymocytes. In transgenic mice in which CD4SP thymocytes expressing an autoreactive TCR undergo both deletion and Treg-cell formation in response to a defined self-peptide, SLP-76 mutation abrogated deletion of autoreactive CD4SP thymocytes. Notably, Foxp3(+) Treg-cell formation still occurred, albeit with a reduced efficiency, and the mutation was also associated with decreased Nur77 expression by the autoreactive CD4SP thymocytes. These studies provide evidence that the strength of the TCR signal can play a direct role in directing the extent of both thymocyte deletion and Treg-cell differentiation, and suggest that distinct TCR signaling thresholds and/or pathways can promote CD4SP thymocyte deletion versus Treg-cell formation.

Keywords: Immune regulation; Thymic selection; Tolerance.


Conflict of interest statement

Conflict of interest: The authors declare no financial or commercial conflict of interest.

Figures

Figure 1
Figure 1. SLP-76 mutation alters thymocyte selection and causes increased frequencies of CD4SPFoxp3+ thymocytes in polyclonal BALB/c.Y145 mice
(A) Dot plots show staining for CD4 and CD8 of thymocytes from BALB/c and BALB/c.Y145 mice. Bar graphs indicate mean numbers or percentages of indicated populations ± SD (filled bars, BALB/c mice; open bars, BALB/c.Y145 mice). (B) Histograms show Foxp3 straining by CD4SP thymocytes from BALB/c (grey shading) and BALB/c.Y145 (line) mice. Bar graph indicates mean numbers or percentages of CD4SP thymocytes that are Foxp3+ ± SD (filled bars, BALB/c mice; open bars, BALB/c.Y145 mice). Scatter plots show MFI with mean indicated for Foxp3 expression by CD4SPFoxp3+ thymocytes from BALB/c and BALB/c.Y145 mice. *p<0.05, **p<0.01. Data are representative of at least 4 independent determinations.
Figure 2
Figure 2. SLP-76 mutation alters the representation of TCR Vβ gene segments in CD4SP thymocytes from BALB/c.Y145 mice
Scatter plots show the percentages of CD4SP thymocytes (upper panel) and of CD4SPFoxp3+ thymocytes (lower panel) that express the indicated TCR Vβ gene segments. Data from individual mice are shown (grey circles, BALB/c mice; open circles, BALB/c.Y145 mice) (n=5) along with means for each group and the probabilities that each pairing has the same mean.
Figure 3
Figure 3. SLP-76 mutation alters positive selection of thymocytes expressing the 6.5 TCR
Dot plots show staining for CD4 and CD8 of thymocytes from TS1 and TS1.Y145 mice. Histograms show 6.5 expression by CD4SP thymocytes from TS1 (gray shading) and TS1.Y145 (line) mice. Bar graphs indicate mean numbers or percentages of indicated populations ± SD (filled bars, TS1 mice; open bars, TS1.Y145 mice). *p<0.05, **p<0.01, ***p<0.001. Data are representative of at least 5 independent determinations.
Figure 4
Figure 4. SLP-76 mutation decreases the sensitivity of CD4+ T cells to cognate peptide
6.5+CD4+ cells were FACS-purified from the spleens and LNs of TS1 and TS1.Y145F mice and co-cultured with BALB/c splenocytes pulsed with graded doses of S1 peptide. Sixteen hours later the cells were stained for CD69 (A) and CD25 (B) and the percentage of 6.5+CD4+ cells that expressed each marker was determined by flow cytometry. (C) Histograms showing staining of 6.5+CD4+ T cells from TS1 mice (dashed line) and TS1.Y145 mice (solid line) stimulated with S1 peptide, or from TS1 mice without peptide (filled). Data are representative of two independent determinations.
Figure 5
Figure 5. Attenuated TCR signaling differentially affects autoreactive thymocyte deletion and Treg formation
Representative histograms show staining for 6.5 by CD4SP thymocytes, and of Nur77 and Foxp3 by 6.5+CD4SP thymocytes of indicated strains. Shaded histograms are for TS1 and TS1.Y145 mice, lines are for TS1xPevHA and TS1xPevHA.Y145 mice as indicated. Bar graphs indicate mean numbers or percentages of indicated populations ± SD (filled bars, TS1xPevHA mice; open bars, TS1xPevHA.Y145 mice). *p<0.05, **p<0.01, ***p<0.001. Data are representative of at least 5 independent determinations.
Figure 6
Figure 6. SLP-76 mutation attenuates Foxp3CD25+ Treg precursor formation
Histograms show CD25 and Foxp3 staining by immature (HSAhigh) and mature (HSAlow) 6.5+CD4SP thymocytes from indicated strains. Numbers indicate percentages in indicated gates from representative mouse. Bar graphs show the mean percentages ± SD of HSAhigh6.5+CD4SP cells that are CD25+Foxp3 in the indicated strains (filled bars, TS1 and TS1xPevHA mice; open bars, TS1.Y145 and TS1xPevHA.Y145 mice as indicated). *p<0.05, ***p<0.001. Data are representative of at least 5 independent determinations.

References

    1. Ashton-Rickardt PG, Bandeira A, Delaney JR, Van Kaer L, Pircher HP, Zinkernagel RM, Tonegawa S. Evidence for a differential avidity model of T cell selection in the thymus. Cell. 1994;76:651–663. - PubMed
    1. Sebzda E, Wallace VA, Mayer J, Yeung RS, Mak TW, Ohashi PS. Positive and negative thymocyte selection induced by different concentrations of a single peptide. Science. 1994;263:1615–1618. - PubMed
    1. Hogquist KA, Jameson SC, Heath WR, Howard JL, Bevan MJ, Carbone FR. T cell receptor antagonist peptides induce positive selection. Cell. 1994;76:17–27. - PubMed
    1. Starr TK, Jameson SC, Hogquist KA. Positive and negative selection of T cells. Annu Rev Immunol. 2003;21:139–176. - PubMed
    1. Sakaguchi S. Naturally arising CD4+ regulatory T cells for immunologic self-tolerance and negative control of immune responses. Annu Rev Immunol. 2004;22:531–562. - PubMed

Publication types

MeSH terms

Substances

LinkOut - more resources