. 2014 Jun;69(2):283-94.
doi: 10.1007/s12013-013-9797-z.

Elevated level of fibrinogen increases caveolae formation; role of matrix metalloproteinase-9

Affiliations

Elevated level of fibrinogen increases caveolae formation; role of matrix metalloproteinase-9

Nino Muradashvili et al. Cell Biochem Biophys. 2014 Jun.

Abstract

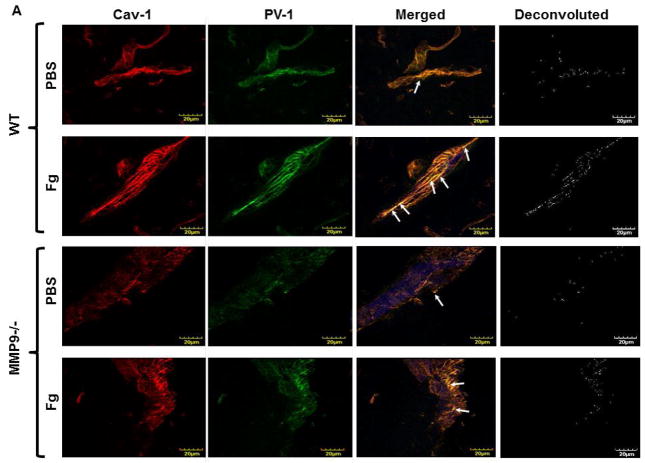
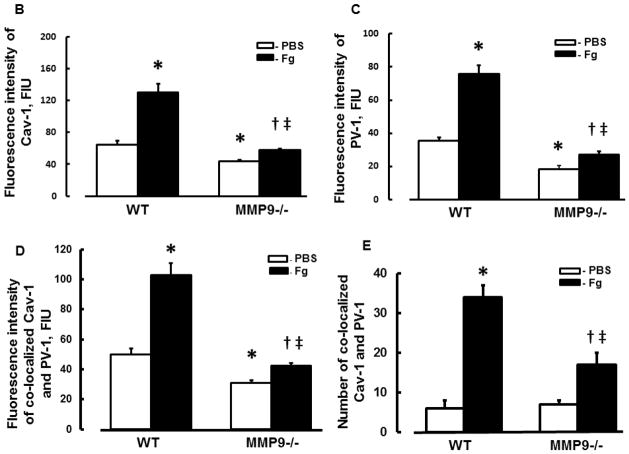
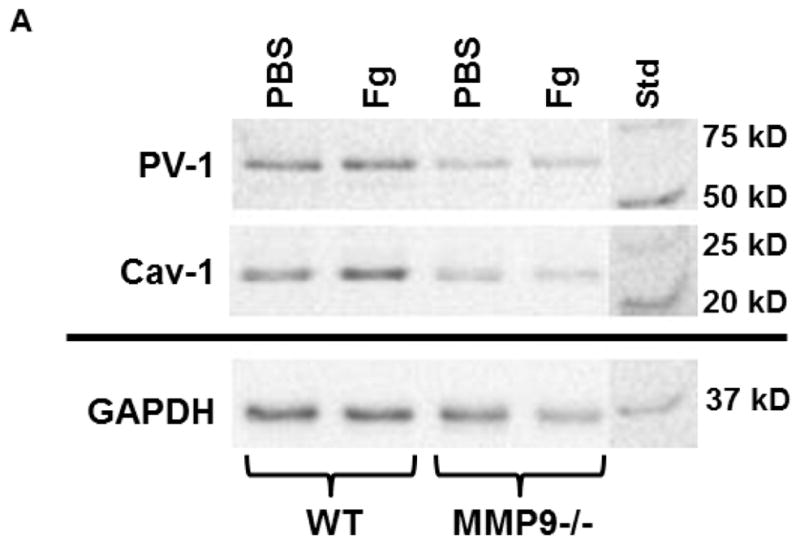
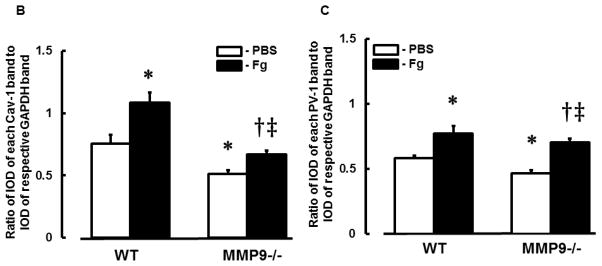
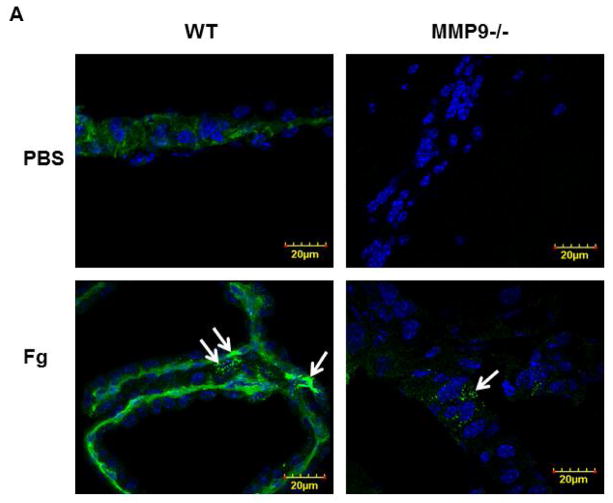
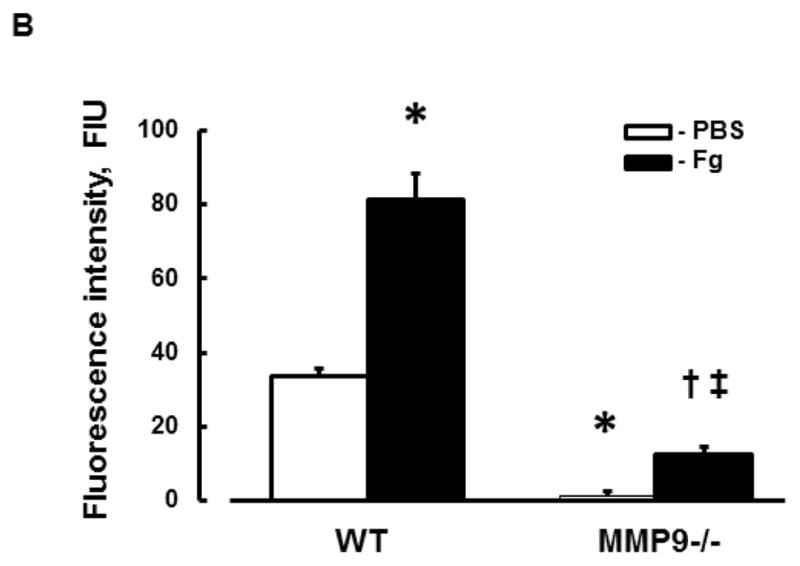
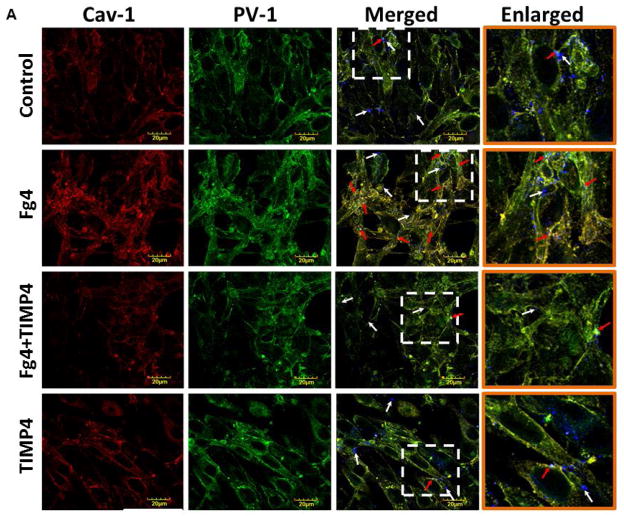
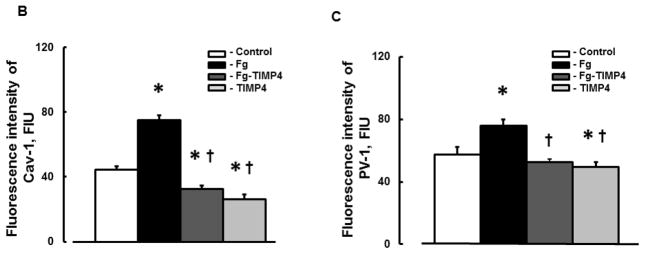
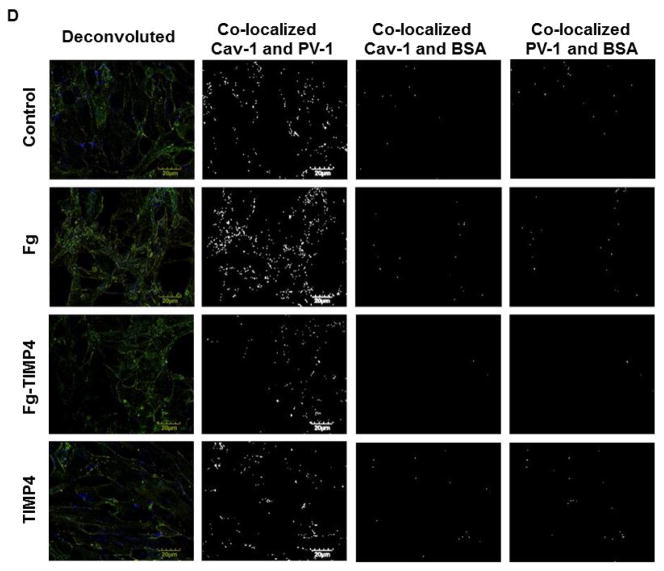
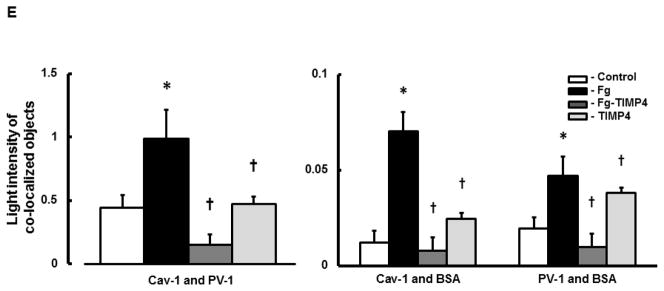
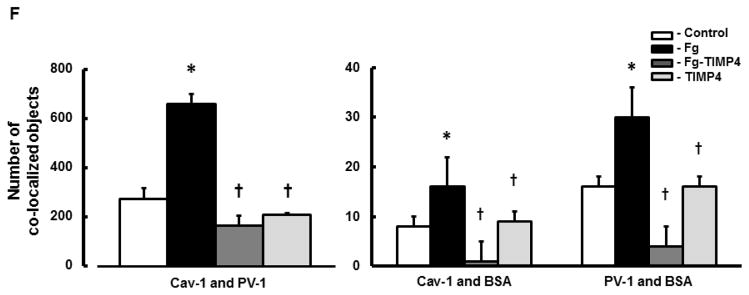
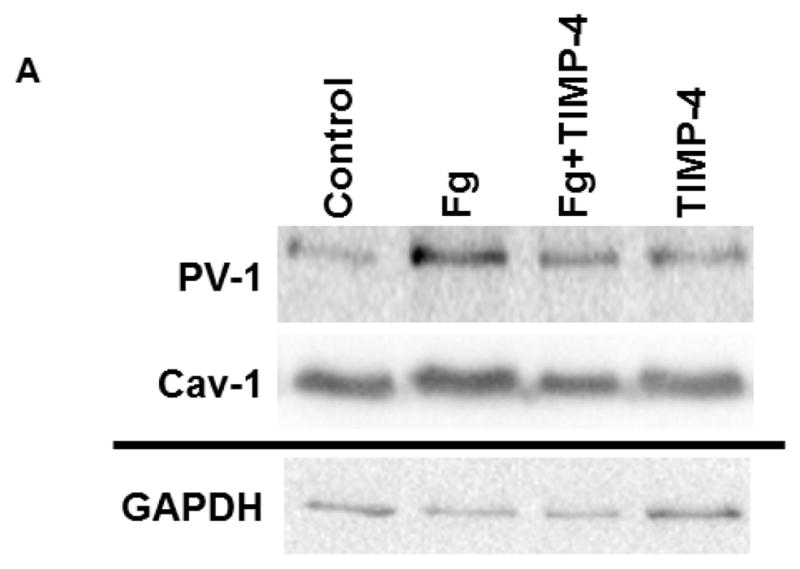
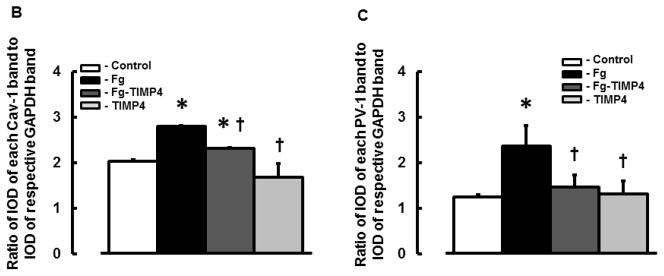
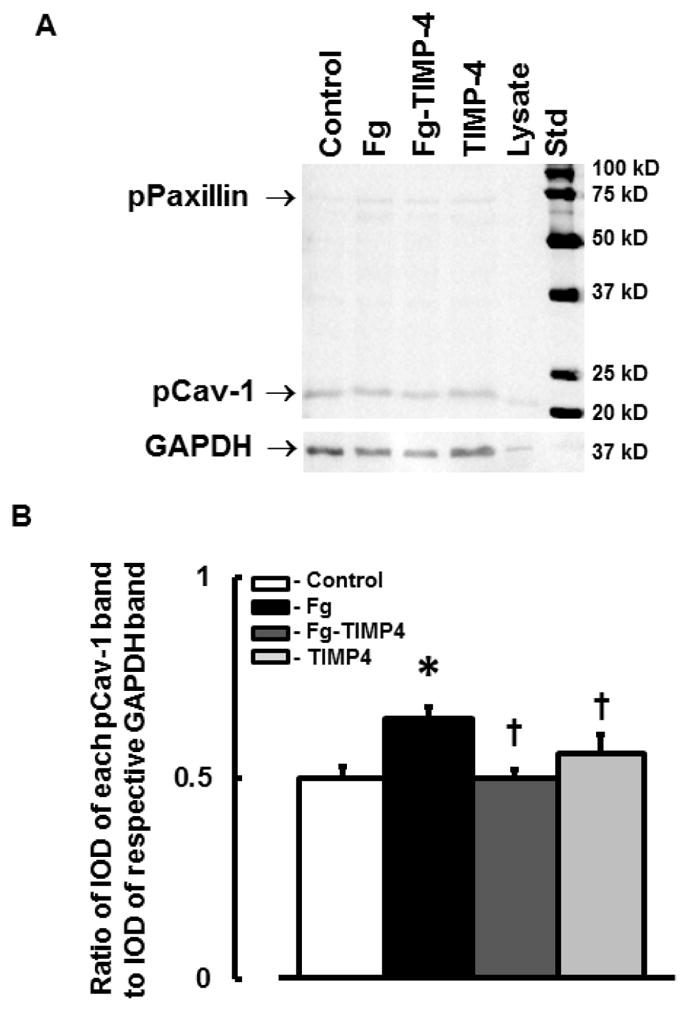
The role of the inflammatory agent fibrinogen (Fg) in increased pial venular permeability has been shown previously. It was suggested that an activation of matrix metalloproteinase-9 (MMP-9) is involved in Fg-induced enhanced transcytosis through endothelial cells (ECs). However, direct link between Fg, caveolae formation, and MMP-9 activity has never been shown. We hypothesized that at an elevated level, Fg enhances formation of functional caveolae through activation of MMP-9. Male wild-type (WT, C57BL/6J) or MMP-9 gene knockout (MMP9-/-) mice were infused with Fg (4 mg/ml, final blood concentration) or equal volume of phosphate buffered saline (PBS). After 2 h, mice were sacrificed and brains were collected for immunohistochemical analyses. Mouse brain ECs were treated with 4 mg/ml of Fg or PBS in the presence or absence of MMP-9 activity inhibitor, tissue inhibitor of metalloproteinases-4 (TIMP-4, 12 ng/ml). Formation of functional caveolae was assessed by confocal microscopy. Fg-induced increased formation of caveolae, which was defined by an increased co-localization of caveolin-1 (Cav-1) and plasmalemmal vesicle-associated protein-1 and was associated with an increased phosphorylation of Cav-1, was ameliorated in the presence of TIMP-4. These results suggest that at high levels, Fg enhances formation of functional caveolae that may involve Cav-1 signaling and MMP-9 activation.


Figures

Figure 1
Figure 1. Expression of caveolin-1 (Cav-1) and plasmalemmal vesicle-associated protein-1 (PV-1) in mouse brain cortical vessels
A) Examples of vessel images in samples obtained from wild type (WT; two upper rows) and MMP-9 gene knockout (MMP9−/−; two lower rows) mice infused with phosphate buffered saline (PBS; first and third rows) or fibrinogen (Fg, final blood content - 4 mg/ml; second and forth rows). Expression of Cav-1 (red, first column) and PV-1 (green, second column) were assessed by measuring the fluorescence intensity of respective fluorochromes along the vascular segments. The third column represents images of co-localized (merged) Cav-1 and PV-1 with Lycopersicon esculentum agglutinin tomato lectin (blue) that was used as an endothelial marker. Images in the fourth column are obtained after deconvolution of images in the third column and show spots of co-localized Cav-1 and PV-1. Summaries of fluorescence intensity changes of Cav-1 (B), PV-1 (C), and their co-localization (D-fluorescence intensity and E-number of spots) in vascular segments after infusion of PBS or Fg. P < 0.05 for all. * - vs. WT+PBS, † - vs. WT+Fg, ‡ - vs. (MMP9−/−)+PBS. n=4 for all groups. Note: Data analyses were done on original images. However, for better visualization, brightness of “mask” images (the fourth column) has been increased by 90%.
Figure 2
Figure 2. Content of caveolin-1 (Cav-1) and plasmalemmal vesicle-associated protein-1 (PV-1) in mouse brain
A) A representative Western blot for protein content of Cav-1 and PV-1 in WT and MMP9−/− mice infused with phosphate buffered saline (PBS) or 4 mg/ml fibrinogen (Fg) (top two rows). Membranes were reprobed for GAPDH (bottom row). Data analyses for Cav-1 (B) and PV-1 (C) are shown. Relative protein expression in samples is presented as a ratio of integrated optical density (IOD) of each band to the IOD of the respective GAPDH band. P < 0.05 for all. * - vs. WT+PBS, † - vs. WT+Fg, ‡ - vs. (MMP9−/−)+PBS. n=3 for all groups.
Figure 3
Figure 3. Phosphorylation of caveolin-1 (pCav-1) in mouse brain cortical vessels
A) Examples of mouse brain cortical vessel images in samples obtained from wild type (WT; first column) and MMP-9 gene knockout (MMP9−/−; second column) mice infused with phosphate buffered saline (PBS; first row) or fibrinogen (Fg, final blood content - 4 mg/ml; second row). The level of pCav-1 (green) was assessed by measurement of fluorescence intensity along the vascular segment. DAPI-labeled vascular cell nuclei (blue). B) Summary of fluorescence intensity changes in vascular segments after infusion of PBS or Fg. P < 0.05 for all. * - vs. WT+PBS, † - vs. WT+Fg, ‡ - vs. (MMP9−/−)+PBS; n=3 for all groups.
Figure 4
Figure 4. Fibrinogen (Fg)-induced formation of functional caveolae in mouse brain endothelial cells (MBECs)
A) Examples of images of MBECs treated with medium alone (control, first row), 4 mg/ml of Fg (Fg, second row), 4 mg/ml of Fg in the presence of 12 ng/ml tissue inhibitor of metalloproteinases-4 (TIMP-4)(Fg-TIMP4, third row), and with 12 ng/ml TIMP-4 alone (TIMP4, forth row). Expression of caveolin-1 (Cav-1, red; first column) and plasmalemmal vesicle-associated protein-1 (PV-1, green; second column) were detected by measuring the fluorescence intensity of respective dyes in cells. Co-localization of anti-Cav-1 antibody (red) and anti-PV-1 (green) defines caveolae (yellow). White arrows indicate free, fluorescently-labeled (blue color) bovine serum albumin (BSA) located in cell cytosol or outside of cells; Red arrows indicate fluorescently-labeled BSA taken up by caveolae (cyan color as a result of co-localization of Cav-1, PV-1, and BSA), which defines the functional caveolae. Summaries of fluorescence intensity changes of Cav-1 (B) and PV-1 (C) in MBECs D) Examples of mask images of co-localization of Cav-1 and PV-1 (second column), Cav-1 and BSA (third column), and PV-1 and BSA (forth column) obtained after deconvolution (Deconvoluted; first column) of merged images (Merged) shown in Fig. 4, A. E) Light intensity values of co-localized Cav-1 and PV-1(second column), Cav-1 and BSA (third column), and PV-1 and BSA (fourth column) objects in mask images. F) Number of co-localized Cav-1 and PV-1 (second column), Cav-1 and BSA (third column), and PV-1 and BSA (fourth column) objects in mask images. P < 0.05 for both. * - vs. Control, † - vs. Fg; n=5 for all groups. Note: Co-localization of Cav-1 and PV-1 indicates formed caveolae. Co-localization of Cav-1 and BSA and PV-1 and BSA indicate functional caveolae that have taken up BSA. Data analyses were done on original images. However, for better visualization, brightness of mask images (the last three columns on D) has been increased by 90%.
Figure 5
Figure 5. Content of caveolin-1 (Cav-1) and plasmalemmal vesicle-associated protein-1 (PV-1) in cultured mouse brain endothelial cells (MBECs)
A) A representative Western blots for protein contents of PV-1 and Cav-1 in MBECs treated with medium alone (control), 4 mg/ml of Fg, 4 mg/ml of Fg in the presence of 12 ng/ml TIMP-4 (Fg-TIMP4), and with 12 ng/ml TIMP-4 alone (TIMP4). Membranes were reprobed for GAPDH (bottom row). Data analyses for Cav-1 (B) and PV-1 (C) are shown. Relative protein expression in samples is presented as a ratio of integrated optical density (IOD) of each band to the IOD of the respective GAPDH band. P < 0.05 for all. * - vs. control, † - vs. Fg. n=3 for all groups.
Figure 6
Figure 6. Phosphorylation of Cav-1 (pCav-1) in cultured mouse brain endothelial cells (MBECs)
A) A representative Western blot image for phosphorylation of Cav-1 in MBECs treated with medium alone (control), 4 mg/ml of Fg, 4 mg/ml of Fg in the presence of 12 ng/ml TIMP-4 (Fg-TIMP4), and with 12 ng/ml TIMP-4 alone (TIMP4). Cell lysate (Lysate) was used as a positive control for pCav-1. The membrane was reprobed for GAPDH (bottom row). B) Data analyses for pCav-1. Relative protein expression in samples is presented as a ratio of integrated optical density (IOD) of each band to the IOD of the respective GAPDH band. P < 0.05 for all. * - vs. control, † - vs. Fg, n=3 for all groups. Note: The antibody pY14 used to identify phosphorylated Cav-1 also cross-reacts with phosphorylated paxillin (pPaxillin). Phosphorylation of paxillin was significantly lesser than that of Cav-1. In addition, changes in paxillin phosphorylation correlated with that of Cav-1 (data are not presented).

Similar articles

Cited by

References

    1. Mehta D, Malik AB. Signaling mechanisms regulating endothelial permeability. Physiological Reviews. 2006;86:279–367. - PubMed
    1. Lominadze D, Dean WL, Tyagi SC, Roberts AM. Mechanisms of fibrinogen-induced microvascular dysfunction during cardiovascular disease. Acta Physiologica. 2010;198:1–13. - PMC - PubMed
    1. Simionescu M, Popov D, Sima A. Endothelial transcytosis in health and disease. Cell and Tissue Research. 2009;335:27–40. - PubMed
    1. Komarova Y, Malik AB. Regulation of endothelial permeability via paracellular and transcellular transport pathways. Annual Review of Physiology. 2010;72:463–493. - PubMed
    1. Stan RV, Marion K, Palade GE. PV-1 is a component of the fenestral and stomatal diaphragms in fenestrated endothelia. Proceedings of the National Academy of Sciences of the United States of America. 1999;96:13203–13207. - PMC - PubMed

Publication types

MeSH terms

LinkOut - more resources