. 2013;5(12):2498-511.
doi: 10.1093/gbe/evt197.

Genome sequencing of Giardia lamblia genotypes A2 and B isolates (DH and GS) and comparative analysis with the genomes of genotypes A1 and E (WB and Pig)

Affiliations

Genome sequencing of Giardia lamblia genotypes A2 and B isolates (DH and GS) and comparative analysis with the genomes of genotypes A1 and E (WB and Pig)

Rodney D Adam et al. Genome Biol Evol. 2013.

Abstract

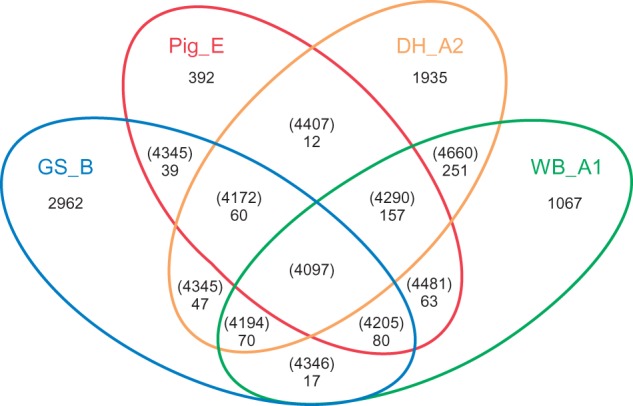
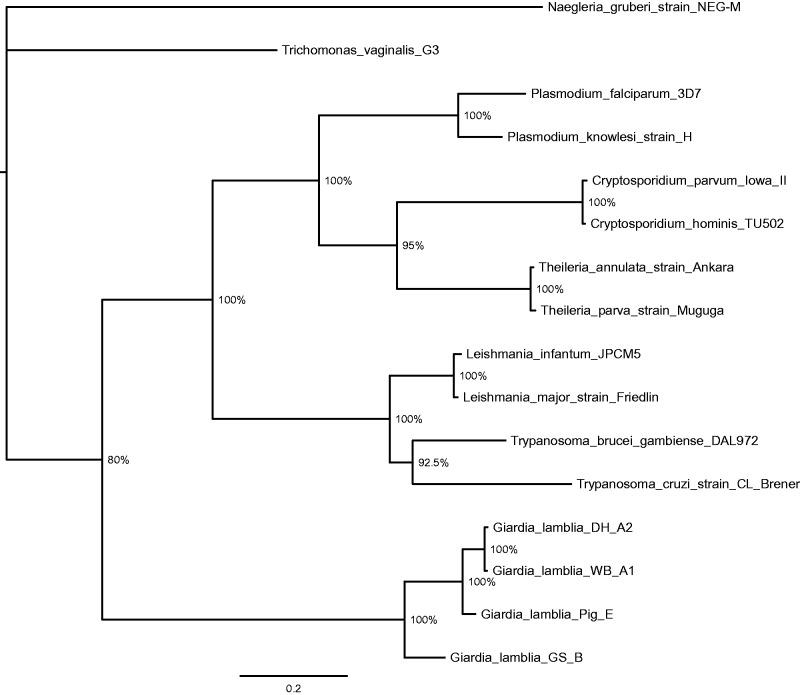
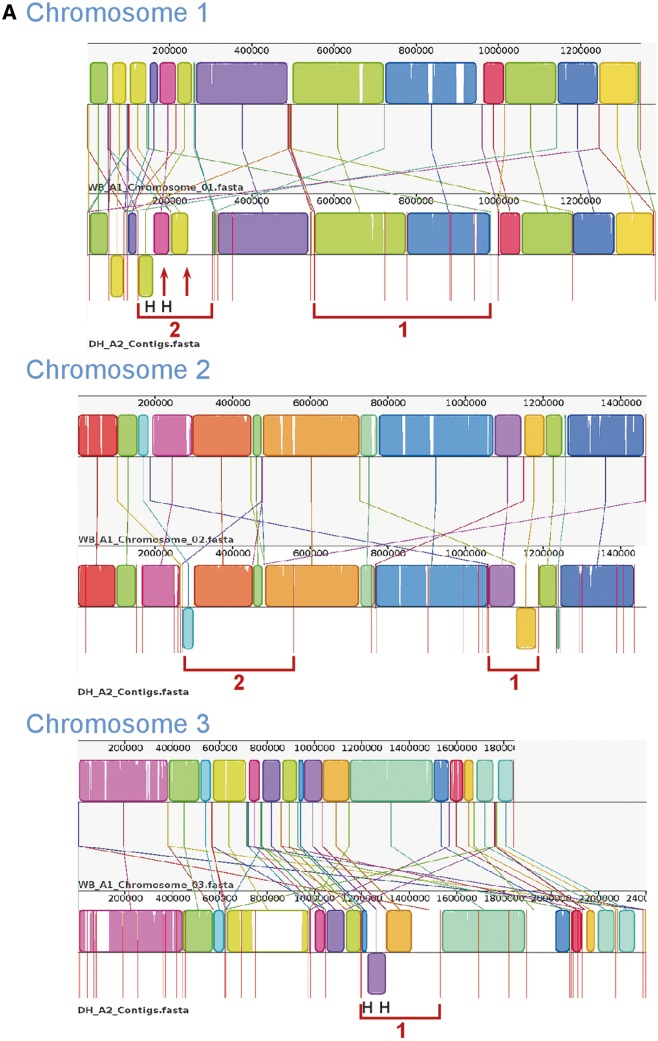
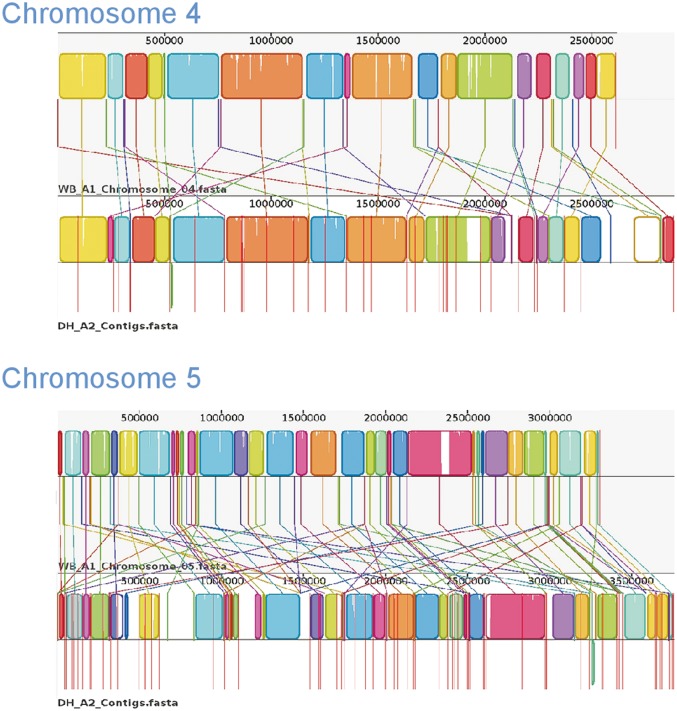
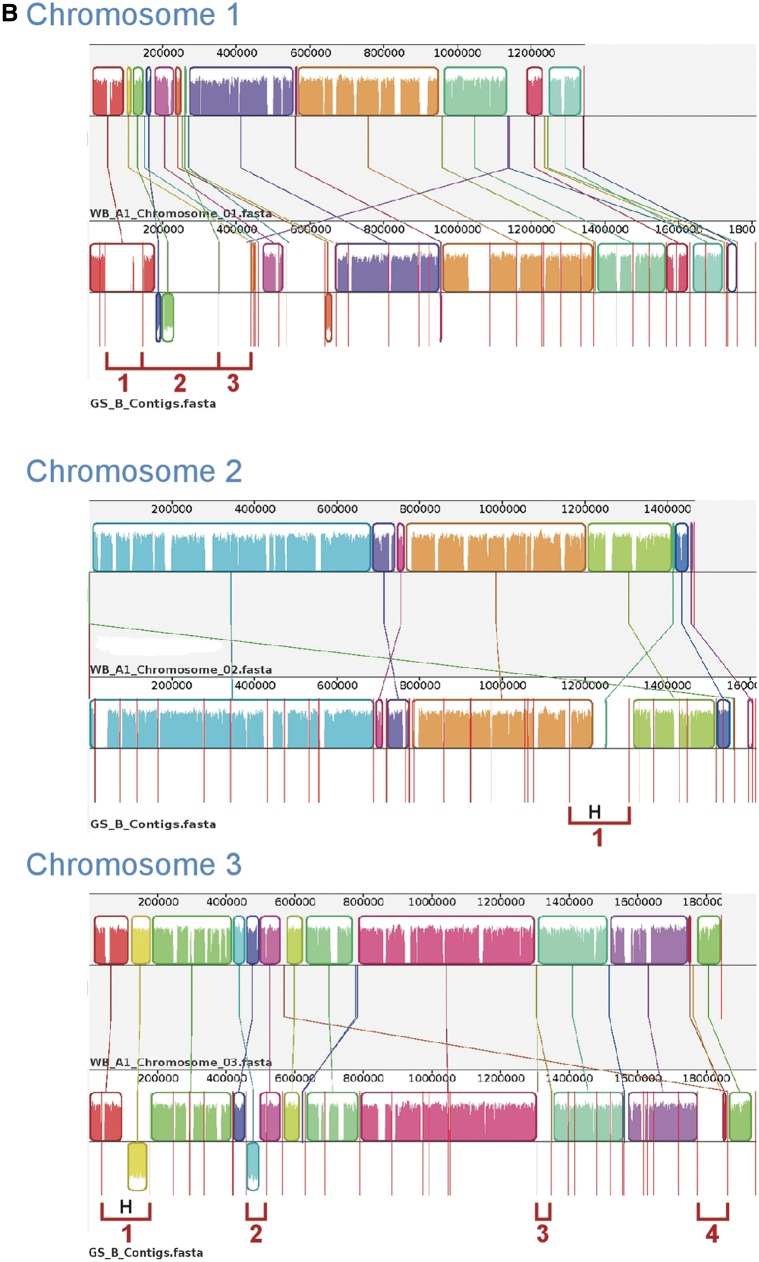
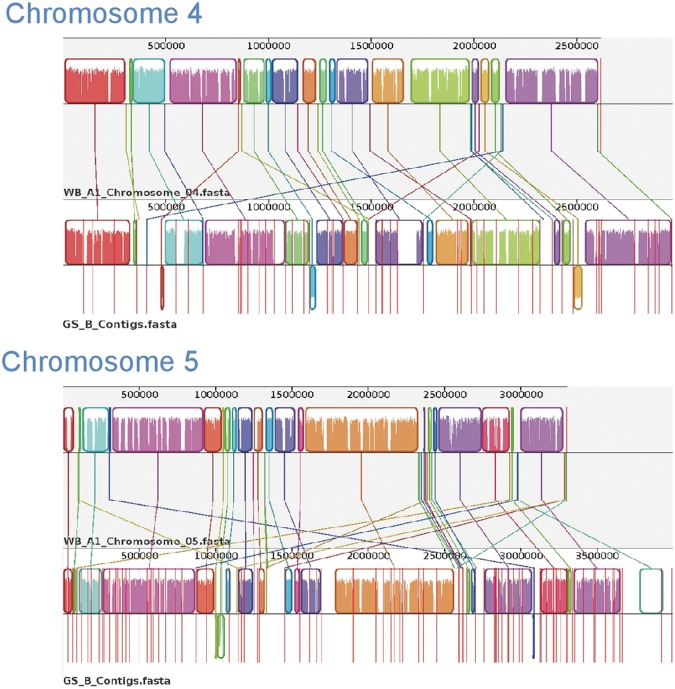
Giardia lamblia (syn G. intestinalis, G. duodenalis) is the most common pathogenic intestinal parasite of humans worldwide and is a frequent cause of endemic and epidemic diarrhea. G. lamblia is divided into eight genotypes (A-H) which infect a wide range of mammals and humans, but human infections are caused by Genotypes A and B. To unambiguously determine the relationship among genotypes, we sequenced GS and DH (Genotypes B and A2) to high depth coverage and compared the assemblies with the nearly completed WB genome and draft sequencing surveys of Genotypes E (P15; pig isolate) and B (GS; human isolate). Our results identified DH as the smallest Giardia genome sequenced to date, while GS is the largest. Our open reading frame analyses and phylogenetic analyses showed that GS was more distant from the other three genomes than any of the other three were from each other. Whole-genome comparisons of DH_A2 and GS_B with the optically mapped WB_A1 demonstrated substantial synteny across all five chromosomes but also included a number of rearrangements, inversions, and chromosomal translocations that were more common toward the chromosome ends. However, the WB_A1/GS_B alignment demonstrated only about 70% sequence identity across the syntenic regions. Our findings add to information presented in previous reports suggesting that GS is a different species of Giardia as supported by the degree of genomic diversity, coding capacity, heterozygosity, phylogenetic distance, and known biological differences from WB_A1 and other G. lamblia genotypes.

Keywords: diplomonad; genotype; heterozygosity; parasitology; synteny.


Figures

F<sc>ig</sc>. 1.—
Fig. 1.—
Venn diagram of the common and unique full-length ORFs of Giardia lamblia isolates. Diagram shows both unique and shared gene content of four G. lamblia genomes as derived by ortholog analysis. Numbers in parentheses represent unique numbers of ORFs per genomes and within intersections between genomes. Numbers not in parentheses represent conserved ORFs within intersections of comparison that are unique relative to the other genomes.
F<sc>ig</sc>. 2.—
Fig. 2.—
Phylogenetic analysis of ribosomal subunit S12E genes from Giardia genomes and other representative protozoans. The ribosomal subunit S12E genes from each of the four Giardia genotypes were aligned along with those of S12E genes from Trypanosoma cruzi, Trypanosoma brucei, Theileria parva, Theileria annulata, Cryptosporidium parvum, Cryptosporidium hominis, Leishmania infantum, Leishmania major, Plasmodium falciparum, Plasmodium knowlesi, Trichomonas vaginalis, and Naegleria gruberi. Trees were constructed using Bayesian inference. The posterior tree is shown. The horizontal scale line represents number of base substitutions per site analyzed. Numbers at the nodes represent the posterior probability.
F<sc>ig</sc>. 3.—
Fig. 3.—
Comparative chromosomal sequence alignment between Giardia Genotypes WB_A1 and DH_A2 and WB_A1 and GS_B. Each horizontal panel represents one chromosome sequence, the name of the sequence, a scale representing the DNA sequence coordinates for that chromosome and a single, black center line that the colored blocks sit on top of or underneath. The colored blocks are those regions of conserved DNA that are internally free of genome rearrangements. These blocks are referred to as LCBs representing entirely collinear and homologous sequence between the two genomes. LCBs that lie above the centerline are regions oriented in the forward direction relative to the reference genome (WB_A1) (Perry et al. 2011). Blocks below this line are oriented in a reverse complement manner relative to the reference chromosome. Red vertical lines that start at the top of the LCBs and extend equidistance below the LCBs represent contig boundaries. For WB_A1, each of the five chromosomes is illustrated as a single contig. Therefore, only two red lines are shown for WB_A1, indicating the ends of the chromosomes. White regions between LCBs represent sequence that lacks detectable homology in the other genome. Within each LCB, the height of the color corresponds to the average conservation within that LCB. Segments of sequence that are completely white within a LCB align poorly and most likely contains sequence specific to that chromosome, but which is still collinear in relation to the sequence surrounding it. The height of the color or similarity profile within the LCBs is calculated to be inversely proportional to the average alignment column entropy over a region of the alignment. The boundaries of the LCBs represent breakpoints of genome rearrangement, while blank adjacent regions are isolate-specific sequence gained or lost in the breakpoint region. Colored lines connecting LCBs or non-LCBs between the two chromosomes represent homologous regions. (A) Mauve visual depiction of chromosomal alignments between WB_A1 and DH_A2. Brackets represent specific contigs discussed in the text. The “H” designates a junction verified by PCR (see supplementary file S1, Supplementary Material online, for more detail). (B) Mauve visual depiction of chromosomal alignments between WB_A1 and GS_B. Brackets represent specific contigs discussed in the text. The “H” designates a junction verified by PCR.

References

    1. Adam RD. Biology of Giardia lamblia. Clin Microbiol Rev. 2001;14:447–475. - PMC - PubMed
    1. Adam RD. Chromosome-size variation in Giardia lamblia: the role of rDNA repeats. Nucleic Acids Res. 1992;20:3057–3061. - PMC - PubMed
    1. Adam RD, Nash TE, Wellems TE. The Giardia lamblia trophozoite contains sets of closely related chromosomes. Nucleic Acids Res. 1988;16:4555–4567. - PMC - PubMed
    1. Adam RD, Nash TE, Wellems TE. Telomeric location of Giardia rDNA genes. Mol Cell Biol. 1991;11:3326–3330. - PMC - PubMed
    1. Adam RD, et al. The Giardia lamblia vsp gene repertoire: characteristics, genomic organization, and evolution. BMC Genomics. 2010;11:424. - PMC - PubMed

Publication types

Associated data