

Amplification and thrifty single-molecule sequencing of recurrent somatic structural variations
- PMID: 24307551
- PMCID: PMC3912422
- DOI: 10.1101/gr.161497.113
Amplification and thrifty single-molecule sequencing of recurrent somatic structural variations
Abstract
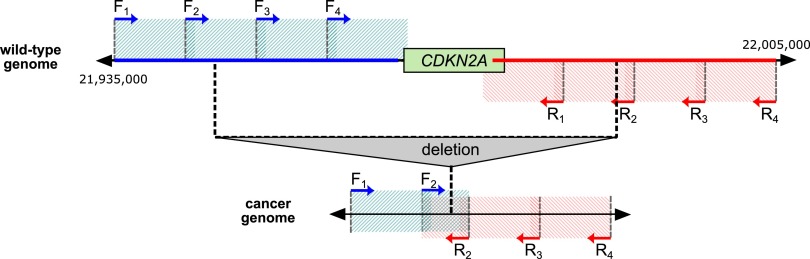
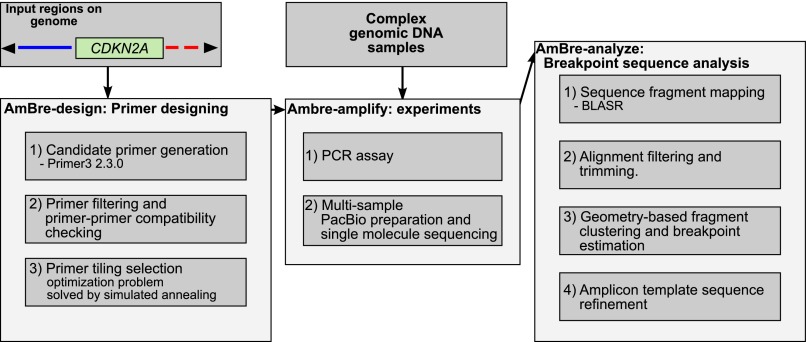
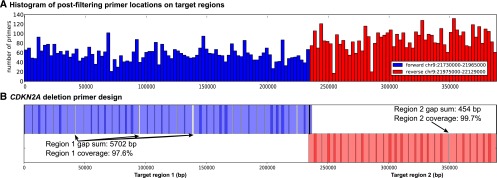
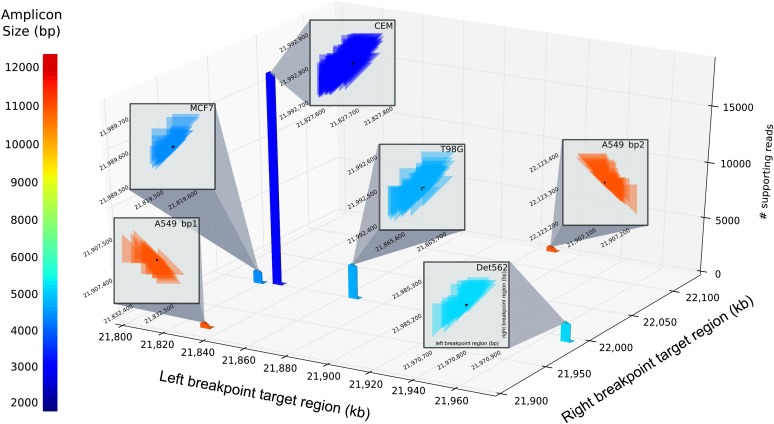
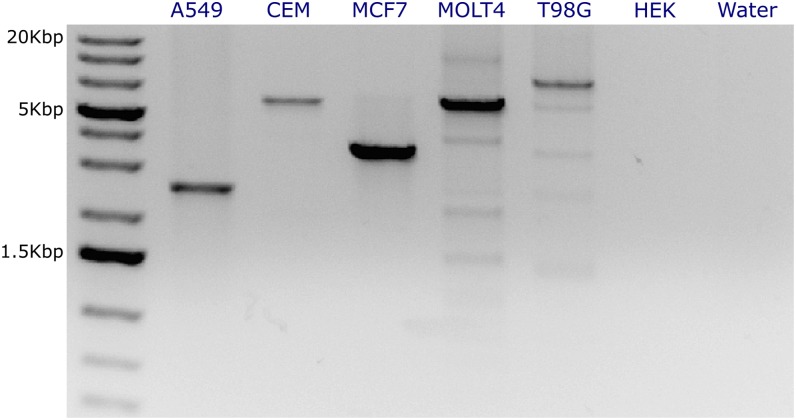
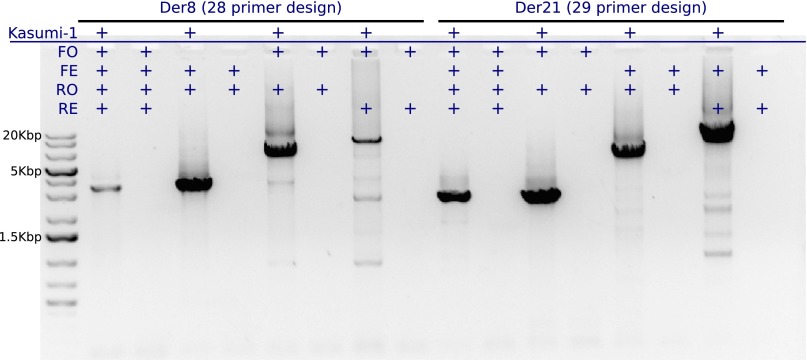
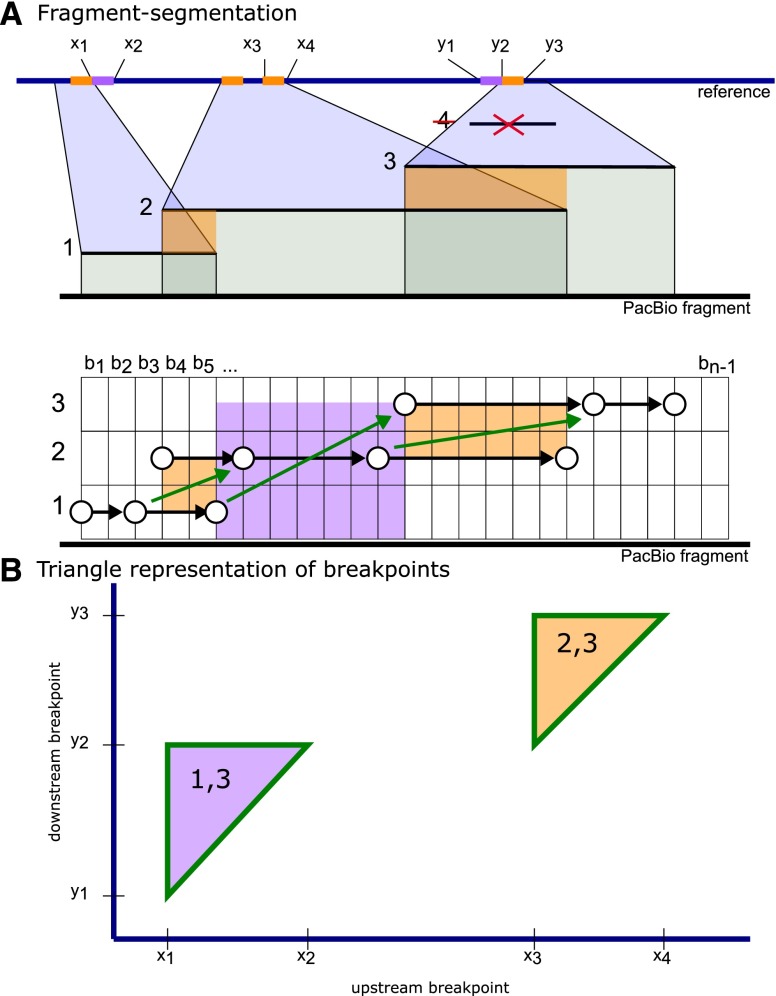
Deletion of tumor-suppressor genes as well as other genomic rearrangements pervade cancer genomes across numerous types of solid tumor and hematologic malignancies. However, even for a specific rearrangement, the breakpoints may vary between individuals, such as the recurrent CDKN2A deletion. Characterizing the exact breakpoints for structural variants (SVs) is useful for designating patient-specific tumor biomarkers. We propose AmBre (Amplification of Breakpoints), a method to target SV breakpoints occurring in samples composed of heterogeneous tumor and germline DNA. Additionally, AmBre validates SVs called by whole-exome/genome sequencing and hybridization arrays. AmBre involves a PCR-based approach to amplify the DNA segment containing an SV's breakpoint and then confirms breakpoints using sequencing by Pacific Biosciences RS. To amplify breakpoints with PCR, primers tiling specified target regions are carefully selected with a simulated annealing algorithm to minimize off-target amplification and maximize efficiency at capturing all possible breakpoints within the target regions. To confirm correct amplification and obtain breakpoints, PCR amplicons are combined without barcoding and simultaneously long-read sequenced using a single SMRT cell. Our algorithm efficiently separates reads based on breakpoints. Each read group supporting the same breakpoint corresponds with an amplicon and a consensus amplicon sequence is called. AmBre was used to discover CDKN2A deletion breakpoints in cancer cell lines: A549, CEM, Detroit562, MOLT4, MCF7, and T98G. Also, we successfully assayed RUNX1-RUNX1T1 reciprocal translocations by finding both breakpoints in the Kasumi-1 cell line. AmBre successfully targets SVs where DNA harboring the breakpoints are present in 1:1000 mixtures.
Figures
Similar articles
-
LinkedSV for detection of mosaic structural variants from linked-read exome and genome sequencing data.Nat Commun. 2019 Dec 6;10(1):5585. doi: 10.1038/s41467-019-13397-7. Nat Commun. 2019. PMID: 31811119 Free PMC article.
-
A pipeline for complete characterization of complex germline rearrangements from long DNA reads.Genome Med. 2020 Jul 31;12(1):67. doi: 10.1186/s13073-020-00762-1. Genome Med. 2020. PMID: 32731881 Free PMC article.
-
Precise detection of chromosomal translocation or inversion breakpoints by whole-genome sequencing.J Hum Genet. 2014 Dec;59(12):649-54. doi: 10.1038/jhg.2014.88. Epub 2014 Oct 9. J Hum Genet. 2014. PMID: 25296578
-
Next-generation sequencing as a tool for breakpoint analysis in rearrangements of the globin gene clusters.Int J Lab Hematol. 2017 May;39 Suppl 1:111-120. doi: 10.1111/ijlh.12680. Int J Lab Hematol. 2017. PMID: 28447426 Review.
-
Human Structural Variation: Mechanisms of Chromosome Rearrangements.Trends Genet. 2015 Oct;31(10):587-599. doi: 10.1016/j.tig.2015.05.010. Epub 2015 Jul 22. Trends Genet. 2015. PMID: 26209074 Free PMC article. Review.
Cited by
-
Cell Separations and Sorting.Anal Chem. 2020 Jan 7;92(1):105-131. doi: 10.1021/acs.analchem.9b05357. Epub 2019 Dec 20. Anal Chem. 2020. PMID: 31808677 Free PMC article. Review. No abstract available.
-
Sample and Library Preparation for PacBio Long-Read Sequencing in Grapevine.Methods Mol Biol. 2024;2787:183-197. doi: 10.1007/978-1-0716-3778-4_12. Methods Mol Biol. 2024. PMID: 38656490
-
CDKN2A somatic copy number amplification in normal tissues surrounding gastric carcinoma reduces cancer metastasis risk in droplet digital PCR analysis.Gastric Cancer. 2024 Sep;27(5):986-997. doi: 10.1007/s10120-024-01515-4. Epub 2024 Jun 1. Gastric Cancer. 2024. PMID: 38822931
-
Application of third-generation sequencing in cancer research.Med Rev (2021). 2021 Oct 21;1(2):150-171. doi: 10.1515/mr-2021-0013. eCollection 2021 Dec. Med Rev (2021). 2021. PMID: 37724303 Free PMC article.
-
InPhaDel: integrative shotgun and proximity-ligation sequencing to phase deletions with single nucleotide polymorphisms.Nucleic Acids Res. 2016 Jul 8;44(12):e111. doi: 10.1093/nar/gkw281. Epub 2016 Apr 21. Nucleic Acids Res. 2016. PMID: 27105843 Free PMC article.
References
-
- Bartley P, Ross D, Latham S, Martin-Harris M, Budgen B, Wilczek V, Branford S, Hughes T, Morley A 2010. Sensitive detection and quantification of minimal residual disease in chronic myeloid leukaemia using nested quantitative PCR for BCR–ABL DNA. Int J Lab Hematol 32: e222–e228 - PubMed
-
- Bashir A, Liu Y, Raphael B, Carson D, Bafna V 2007. Optimization of primer design for the detection of variable genomic lesions in cancer. Bioinformatics 23: 2807–2815 - PubMed
Publication types
MeSH terms
Substances
Grants and funding
LinkOut - more resources
Full Text Sources
Other Literature Sources
Miscellaneous