

Endothelial, epithelial, and fibroblast cells exhibit specific splicing programs independently of their tissue of origin
- PMID: 24307554
- PMCID: PMC3941115
- DOI: 10.1101/gr.162933.113
Endothelial, epithelial, and fibroblast cells exhibit specific splicing programs independently of their tissue of origin
Abstract
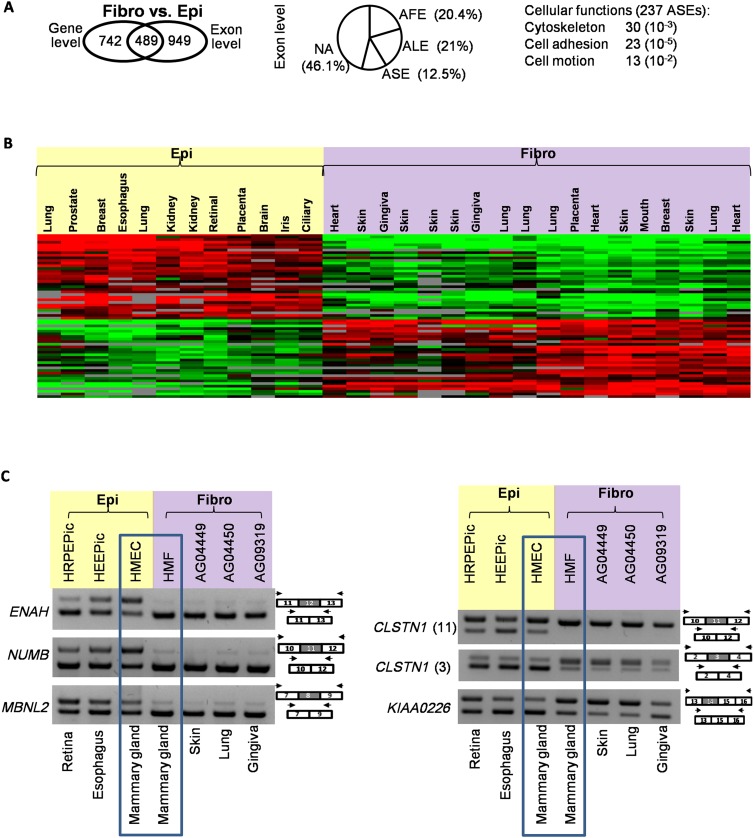
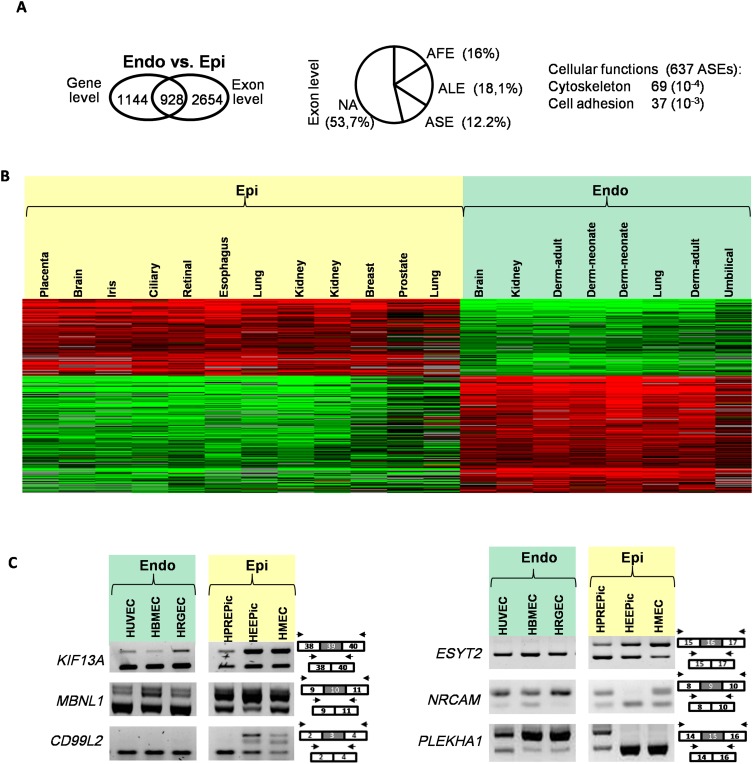
Alternative splicing is the main mechanism of increasing the proteome diversity coded by a limited number of genes. It is well established that different tissues or organs express different splicing variants. However, organs are composed of common major cell types, including fibroblasts, epithelial, and endothelial cells. By analyzing large-scale data sets generated by The ENCODE Project Consortium and after extensive RT-PCR validation, we demonstrate that each of the three major cell types expresses a specific splicing program independently of its organ origin. Furthermore, by analyzing splicing factor expression across samples, publicly available splicing factor binding site data sets (CLIP-seq), and exon array data sets after splicing factor depletion, we identified several splicing factors, including ESRP1 and 2, MBNL1, NOVA1, PTBP1, and RBFOX2, that contribute to establishing these cell type-specific splicing programs. All of the analyzed data sets are freely available in a user-friendly web interface named FasterDB, which describes all known splicing variants of human and mouse genes and their splicing patterns across several dozens of normal and cancer cells as well as across tissues. Information regarding splicing factors that potentially contribute to individual exon regulation is also provided via a dedicated CLIP-seq and exon array data visualization interface. To the best of our knowledge, FasterDB is the first database integrating such a variety of large-scale data sets to enable functional genomics analyses at exon-level resolution.
Figures


Similar articles
-
Transcriptomic analysis of PNN- and ESRP1-regulated alternative pre-mRNA splicing in human corneal epithelial cells.Invest Ophthalmol Vis Sci. 2013 Jan 23;54(1):697-707. doi: 10.1167/iovs.12-10695. Invest Ophthalmol Vis Sci. 2013. PMID: 23299472 Free PMC article.
-
Splicing factor and exon profiling across human tissues.Nucleic Acids Res. 2010 May;38(9):2825-38. doi: 10.1093/nar/gkq008. Epub 2010 Jan 27. Nucleic Acids Res. 2010. PMID: 20110256 Free PMC article.
-
RBFOX2 is an important regulator of mesenchymal tissue-specific splicing in both normal and cancer tissues.Mol Cell Biol. 2013 Jan;33(2):396-405. doi: 10.1128/MCB.01174-12. Epub 2012 Nov 12. Mol Cell Biol. 2013. PMID: 23149937 Free PMC article.
-
Identification of protein features encoded by alternative exons using Exon Ontology.Genome Res. 2017 Jun;27(6):1087-1097. doi: 10.1101/gr.212696.116. Epub 2017 Apr 18. Genome Res. 2017. PMID: 28420690 Free PMC article.
-
Alternative Splicing by NOVA Factors: From Gene Expression to Cell Physiology and Pathology.Int J Mol Sci. 2020 May 30;21(11):3941. doi: 10.3390/ijms21113941. Int J Mol Sci. 2020. PMID: 32486302 Free PMC article. Review.
Cited by
-
Intense pulsed light induces synthesis of dermal extracellular proteins in vitro.Lasers Med Sci. 2015 Sep;30(7):1931-9. doi: 10.1007/s10103-015-1787-5. Epub 2015 Jul 19. Lasers Med Sci. 2015. PMID: 26188855
-
Evolutionary recruitment of flexible Esrp-dependent splicing programs into diverse embryonic morphogenetic processes.Nat Commun. 2017 Nov 27;8(1):1799. doi: 10.1038/s41467-017-01961-y. Nat Commun. 2017. PMID: 29180615 Free PMC article.
-
Alternative splicing in endothelial cells: novel therapeutic opportunities in cancer angiogenesis.J Exp Clin Cancer Res. 2020 Dec 7;39(1):275. doi: 10.1186/s13046-020-01753-1. J Exp Clin Cancer Res. 2020. PMID: 33287867 Free PMC article. Review.
-
SplicingLore: a web resource for studying the regulation of cassette exons by human splicing factors.Database (Oxford). 2023 Dec 21;2023:baad091. doi: 10.1093/database/baad091. Database (Oxford). 2023. PMID: 38128543 Free PMC article.
-
Targeting SR proteins improves SMN expression in spinal muscular atrophy cells.PLoS One. 2014 Dec 15;9(12):e115205. doi: 10.1371/journal.pone.0115205. eCollection 2014. PLoS One. 2014. PMID: 25506695 Free PMC article.
References
-
- Barash Y, Calarco JA, Gao W, Pan Q, Wang X, Shai O, Blencowe BJ, Frey BJ 2010. Deciphering the splicing code. Nature 465: 53–59 - PubMed
-
- Barbosa-Morais NL, Irimia M, Pan Q, Xiong HY, Gueroussov S, Lee LJ, Slobodeniuc V, Kutter C, Watt S, Colak R, et al. 2012. The evolutionary landscape of alternative splicing in vertebrate species. Science 338: 1587–1593 - PubMed
-
- Blencowe BJ 2012. An exon-centric perspective. Biochem Cell Biol 90: 603–612 - PubMed
Publication types
MeSH terms
Substances
LinkOut - more resources
Full Text Sources
Other Literature Sources