Clinical Trial
. 2014 Feb;27(2):116-28.
doi: 10.1002/nbm.3040. Epub 2013 Oct 16.

Three-dimensional whole-brain perfusion quantification using pseudo-continuous arterial spin labeling MRI at multiple post-labeling delays: accounting for both arterial transit time and impulse response function

Affiliations
Clinical Trial

Three-dimensional whole-brain perfusion quantification using pseudo-continuous arterial spin labeling MRI at multiple post-labeling delays: accounting for both arterial transit time and impulse response function

Qin Qin et al. NMR Biomed. 2014 Feb.

Abstract

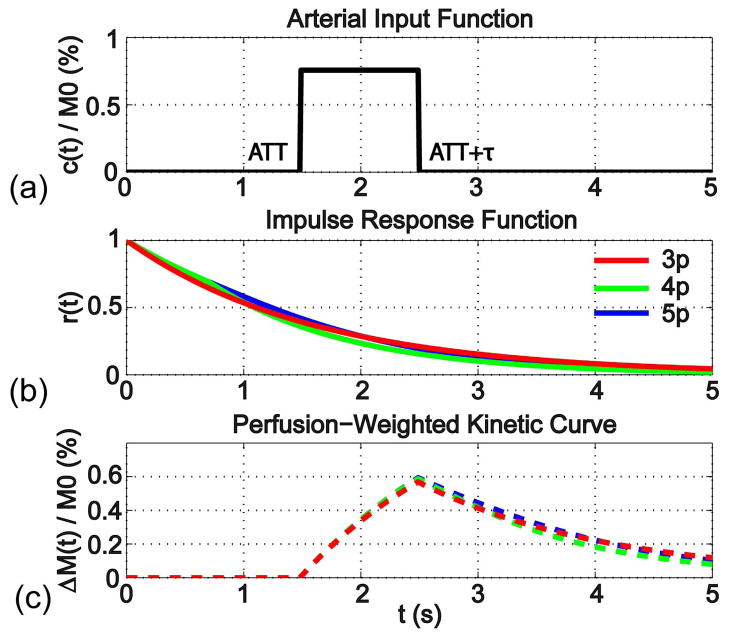
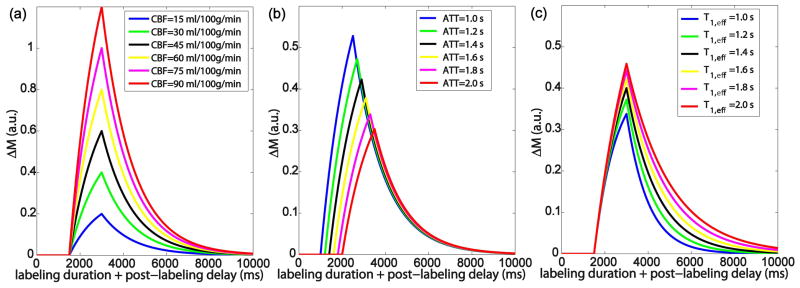
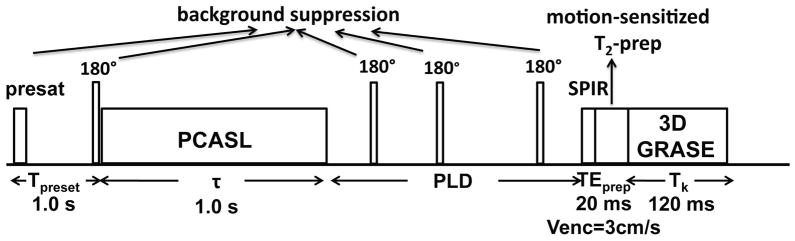
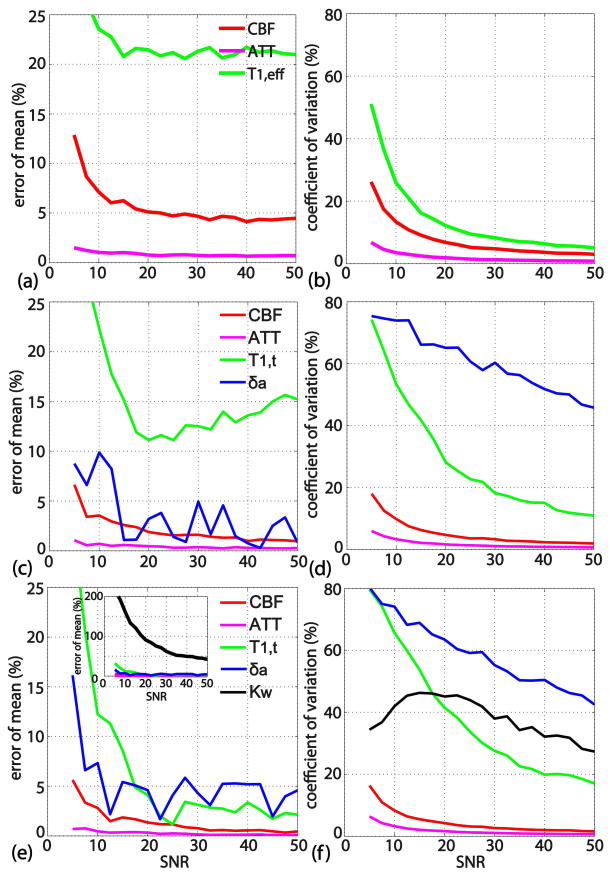
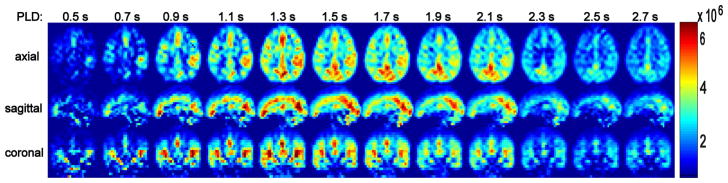
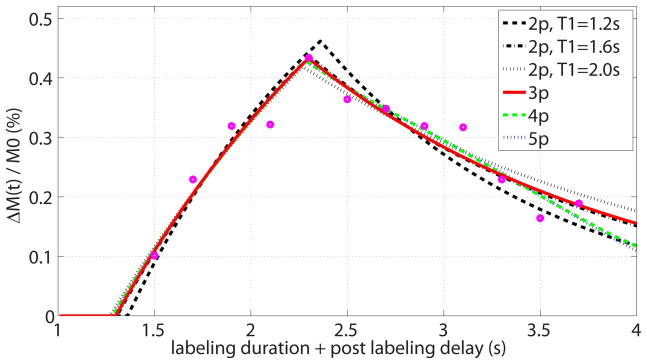
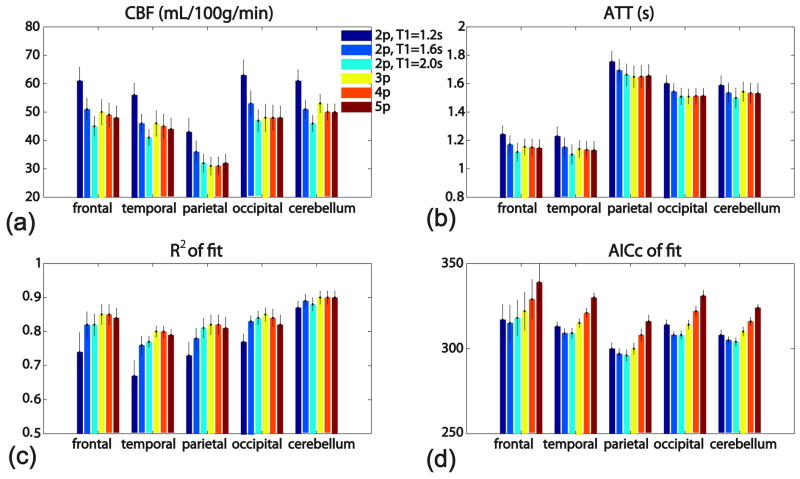
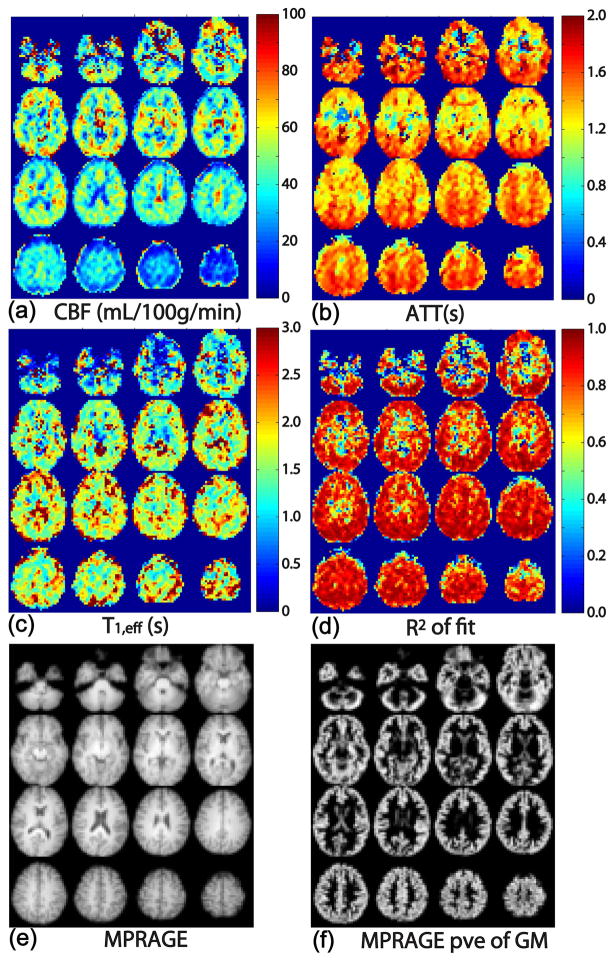
Measurement of the cerebral blood flow (CBF) with whole-brain coverage is challenging in terms of both acquisition and quantitative analysis. In order to fit arterial spin labeling-based perfusion kinetic curves, an empirical three-parameter model which characterizes the effective impulse response function (IRF) is introduced, which allows the determination of CBF, the arterial transit time (ATT) and T(1,eff). The accuracy and precision of the proposed model were compared with those of more complicated models with four or five parameters through Monte Carlo simulations. Pseudo-continuous arterial spin labeling images were acquired on a clinical 3-T scanner in 10 normal volunteers using a three-dimensional multi-shot gradient and spin echo scheme at multiple post-labeling delays to sample the kinetic curves. Voxel-wise fitting was performed using the three-parameter model and other models that contain two, four or five unknown parameters. For the two-parameter model, T(1,eff) values close to tissue and blood were assumed separately. Standard statistical analysis was conducted to compare these fitting models in various brain regions. The fitted results indicated that: (i) the estimated CBF values using the two-parameter model show appreciable dependence on the assumed T(1,eff) values; (ii) the proposed three-parameter model achieves the optimal balance between the goodness of fit and model complexity when compared among the models with explicit IRF fitting; (iii) both the two-parameter model using fixed blood T1 values for T(1,eff) and the three-parameter model provide reasonable fitting results. Using the proposed three-parameter model, the estimated CBF (46 ± 14 mL/100 g/min) and ATT (1.4 ± 0.3 s) values averaged from different brain regions are close to the literature reports; the estimated T(1,eff) values (1.9 ± 0.4 s) are higher than the tissue T1 values, possibly reflecting a contribution from the microvascular arterial blood compartment.

Keywords: GRASE; PCASL; arterial transit time; brain; cerebral blood flow; clinical; human; impulse response function.


Figures

Figure 1
Figure 1
(a) The Arterial Input Function (AIF) for continuous ASL is characterized by the lengthening of ATT with the duration τ; (b) The Impulse Response Function (IRF) is compared between the proposed 3-parameter model (3p), which assumes a monoexponential decay function characterized with T1,eff, and the more sophisticated 4-parameter (4p) and 5-parameter models (5p) (Appendix); (c) The perfusion-weighted kinetic curves are the convolutions of AIF (a) with IRFs of the each model (b), respectively.
Figure 2
Figure 2
The dependencies of the 3-parameter model for continuous ASL on (a) CBF; (b) ATT; (c) T1,eff.
Figure 3
Figure 3
Pulse sequence diagram for 3D mapping of baseline CBF. There are five blocks within each repetition: PCASL (τ = 1 s), background suppression with one preset pulse (Tpresat = 1 s) and four inversion pulses (timing as in Table 1), SPIR pulse, motion-sensitized T2 prep (TEprep = 20 ms), and 3D GRASE acquisition (Tk = 120 ms). Twelve different PLDs ([0.5, 0.7, 0.9, 1.1, 1.3, 1.5, 1.7, 1.9, 2.1, 2.3, 2.5, 2.7] s) were acquired separately for measuring the perfusion kinetic curves.
Figure 4
Figure 4
Monte Carlo simulation results for 3-parameter (a, b), 4-parameter (c, d) and 5-parameter (e, f) models, showing the error percentage of the mean (indicating accuracy) in the left column and the coefficient of variation (indicating precision) in the right column, all as a function of SNR. The precision and accuracies of the 3-, 4-, and 5-parameter models for estimating CBF / ATT is comparable; Additional parameters (δa / Kw) in the 4-, 5-parameter models are not estimated with acceptable precision.
Figure 5
Figure 5
Perfusion weighted images as a function of post-labeling delay, with a representative dataset shown in three orthogonal views. Little distortion or blurring effects can be detected. The images are scaled by the maximal difference signal in the dataset. A heterogeneous distribution of arterial arrival times is visible for different brain regions.
Figure 6
Figure 6
Representative multi-PLD dataset (open circles) for one voxel in gray matter, fitted by the proposed 3-parameter model (red solid line, the estimated values are: CBF = 52 mL/100g/min, ATT = 1.3 s, T1,eff = 1.7 s, R2 of fit = 0.91, AICc of fit = 316, BIC of fit = 314) and other models including: 2-parameter models with assumed T1,eff = 1.2 s (black dashed line, CBF = 64 mL/100g/min, ATT = 1.4 s, R2 of fit = 0.86, AICc of fit = 317, BIC of fit = 317), assumed T1,eff = 1.6 s (black dashdot line, CBF = 53 mL/100g/min, ATT = 1.3 s, R2 of fit = 0.91, AICc of fit = 312, BIC of fit = 312), and assumed T1,eff = 2.0 s (black dotted line, CBF = 47 mL/100g/min, ATT = 1.3 s, R2 of fit = 0.9, AICc of fit = 314, BIC of fit = 314); 4-parameter model (green dashed line, CBF = 49 mL/100g/min, ATT = 1.3 s, R2 of fit = 0.92, AICc of fit = 319, BIC of fit = 315); and 5-parameter model (blue dotted line, CBF = 49 mL/100g/min, ATT = 1.3 s, R2 of fit = 0.92, AICc of fit = 325, BIC of fit = 318).
Figure 7
Figure 7
Bar-graphs of the averaged estimated values using six model fittings: (a) CBF, (b) ATT, (c) R2 of fit, and (d) AICc of fit, for each of the five ROIs in the gray matter (frontal lobe, temporal lobe, parietal lobe, occipital lobe, and cerebellum), among 10 healthy subjects. Error bars reflect the standard errors across subjects.
Figure 8
Figure 8
Maps of (a) CBF, (b) ATT, (c) T1,eff, and (d) the correlation coefficient of the fit, R2. The data show very good fits overall. Co-registered MPRAGE images (e) and segmented gray matter partial volume estimation (pve) (f) are also shown for anatomical comparison.

References

    1. Buxton RB, Frank LR, Wong EC, Siewert B, Warach S, Edelman RR. A general kinetic model for quantitative perfusion imaging with arterial spin labeling. Magn Reson Med. 1998;40(3):383–396. - PubMed
    1. Buxton RB. Quantifying CBF with arterial spin labeling. J Magn Reson Imaging. 2005;22(6):723–726. - PubMed
    1. Alsop DC, Detre JA. Reduced transit-time sensitivity in noninvasive magnetic resonance imaging of human cerebral blood flow. J Cereb Blood Flow Metab. 1996;16(6):1236–1249. - PubMed
    1. Wang J, Alsop DC, Song HK, Maldjian JA, Tang K, Salvucci AE, Detre JA. Arterial transit time imaging with flow encoding arterial spin tagging (FEAST) Magn Reson Med. 2003;50(3):599–607. - PubMed
    1. Dai W, Robson PM, Shankaranarayanan A, Alsop DC. Reduced resolution transit delay prescan for quantitative continuous arterial spin labeling perfusion imaging. Magn Reson Med. 2012;67(5):1252–1265. - PMC - PubMed

Publication types

LinkOut - more resources