

Length Dependent Helix-Coil Transition Kinetics of Nine Alanine-Based Peptides
- PMID: 24307864
- PMCID: PMC3845522
- DOI: 10.1021/jp037272j
Length Dependent Helix-Coil Transition Kinetics of Nine Alanine-Based Peptides
Abstract
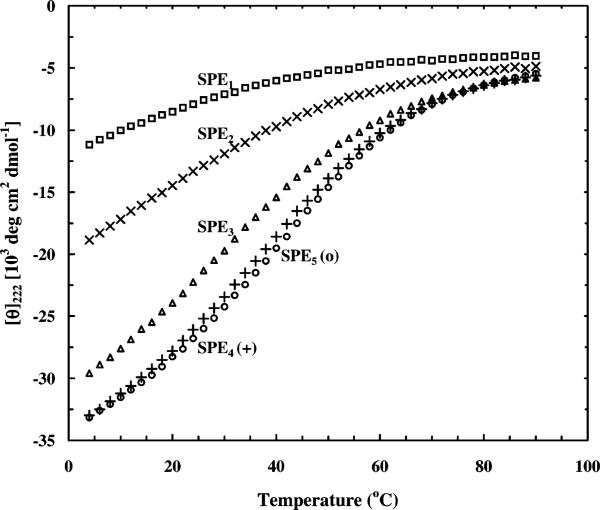
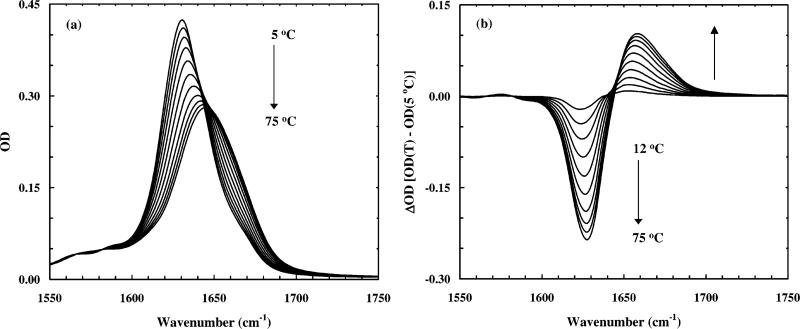
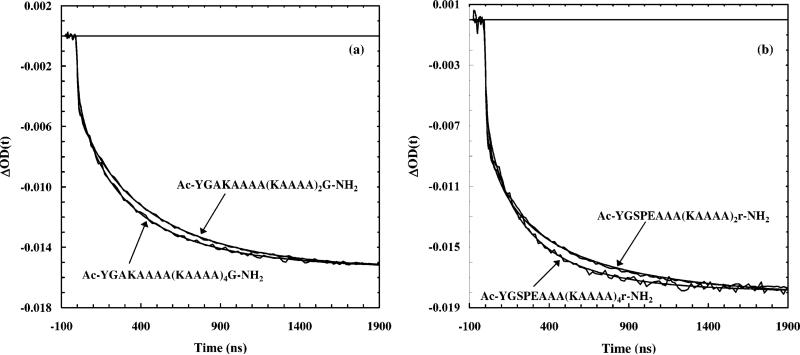
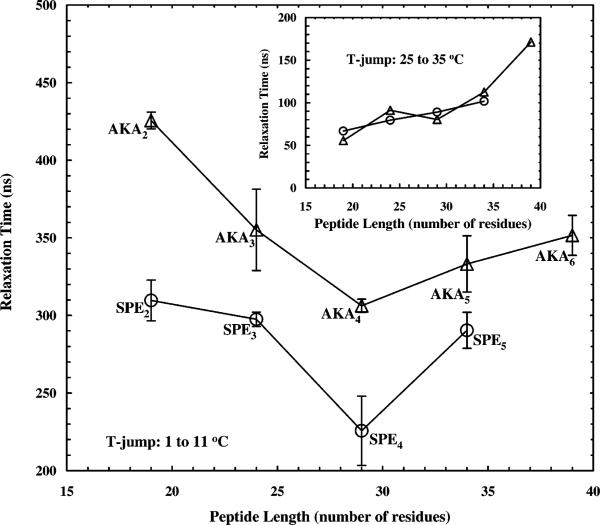
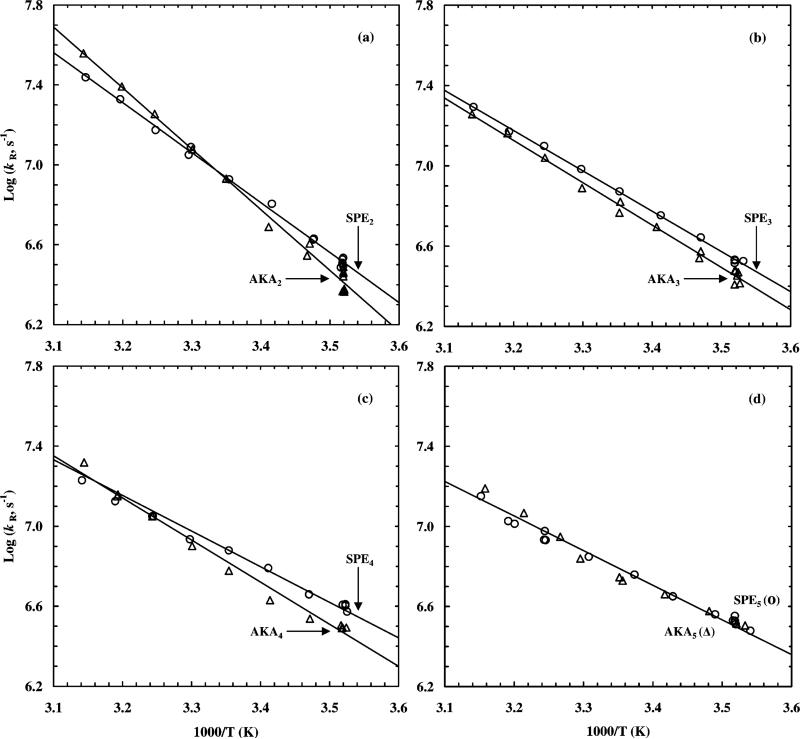
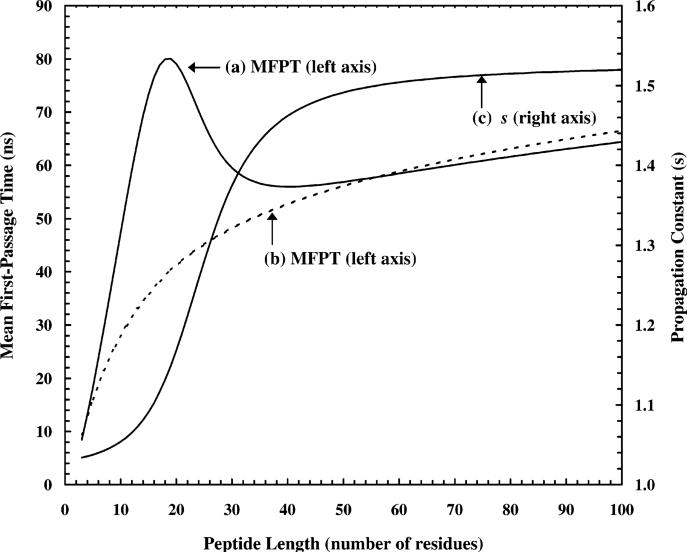
It is well-known that end caps and the peptide length can dramatically influence the thermodynamics of the helix-coil transition. However, their roles in determining the kinetics of the helix-coil transition have not been studied extensively and are less well understood. Kinetic Ising models and sequential kinetic models involving barrier crossing via diffusion all predict that the helix formation time depends monotonically on the peptide length with the relaxation time increasing with respect to increasing chain length. Here, we have studied the helix-coil transition kinetics of a series of Ala-based α-helical peptides of different length (19-39 residues), with and without end caps, using time-resolved infrared spectroscopy coupled with laser-induced temperature jump (T-jump) initiation method. The helical content of these peptides was kinetically monitored by probing the amide carbonyl stretching frequencies (i.e., the amide I' band) of the peptide backbone. We found that the relaxation rates for peptides with efficient end caps are more rapid than those of the corresponding peptides without good end caps. These results indicate that efficient end-capping sequences can not only stabilize preexisting helices but also promote helix formation through initiation. Furthermore, we found that the relaxation times of these peptides, following a T-jump of 1-11 °C, show rather complex behaviors as a function of the peptide length, in disagreement with theoretical predications. Theses results are not readily explained by theories in which Ala is taken to have a single helical propensity (s). However, recent studies have suggested that s depends on chain length; when this factor is considered, the mean first-passage times of the coil-to-helix transition show similar dependence on the peptide length as those observed experimentally.
Figures
References
-
- Kennedy RJ, Tsang K-T, Kemp DS. J. Am. Chem. Soc. 2002;124:934. - PubMed
-
- Miller JS, Kennedy RJ, Kemp DS. J. Am. Chem. Soc. 2002;124:945. - PubMed
-
- Engel DE, DeGrado WF. J. Mol. Biol. 2004;337:1195. - PubMed
-
- Williams S, Causgrove TP, Gilmanshin R, Fang KS, Callender RH, Woodruff WH, Dyer RB. Biochemistry. 1996;35:691. - PubMed
-
- Thompson PA, Eaton WA, Hofrichter J. Biochemistry. 1997;36:9200. - PubMed
Grants and funding
LinkOut - more resources
Full Text Sources
Other Literature Sources
Miscellaneous