. 2013 Dec 5;2(6):e000376.
doi: 10.1161/JAHA.113.000376.

Unacylated ghrelin promotes skeletal muscle regeneration following hindlimb ischemia via SOD-2-mediated miR-221/222 expression

Affiliations

Unacylated ghrelin promotes skeletal muscle regeneration following hindlimb ischemia via SOD-2-mediated miR-221/222 expression

Gabriele Togliatto et al. J Am Heart Assoc. .

Abstract

Background: Surgical treatment of peripheral artery disease, even if successful, does not prevent reoccurrence. Under these conditions, increased oxidative stress is a crucial determinant of tissue damage. Given its reported antioxidant effects, we investigated the potential of unacylated-ghrelin (UnAG) to reduce ischemia-induced tissue damage in a mouse model of peripheral artery disease.

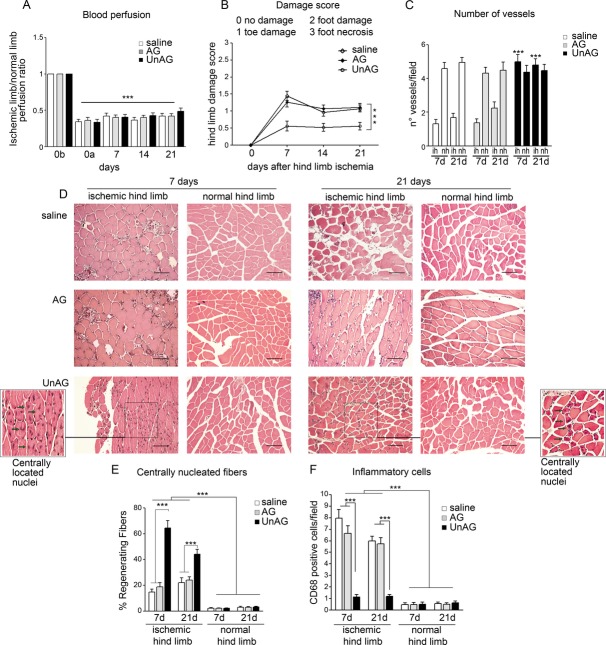
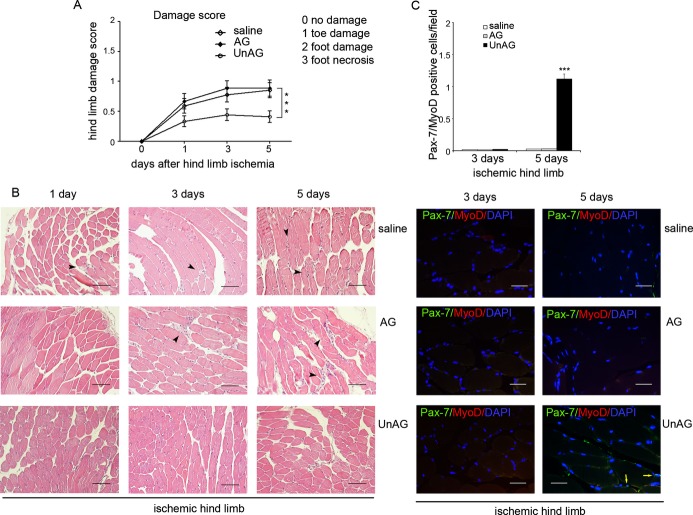
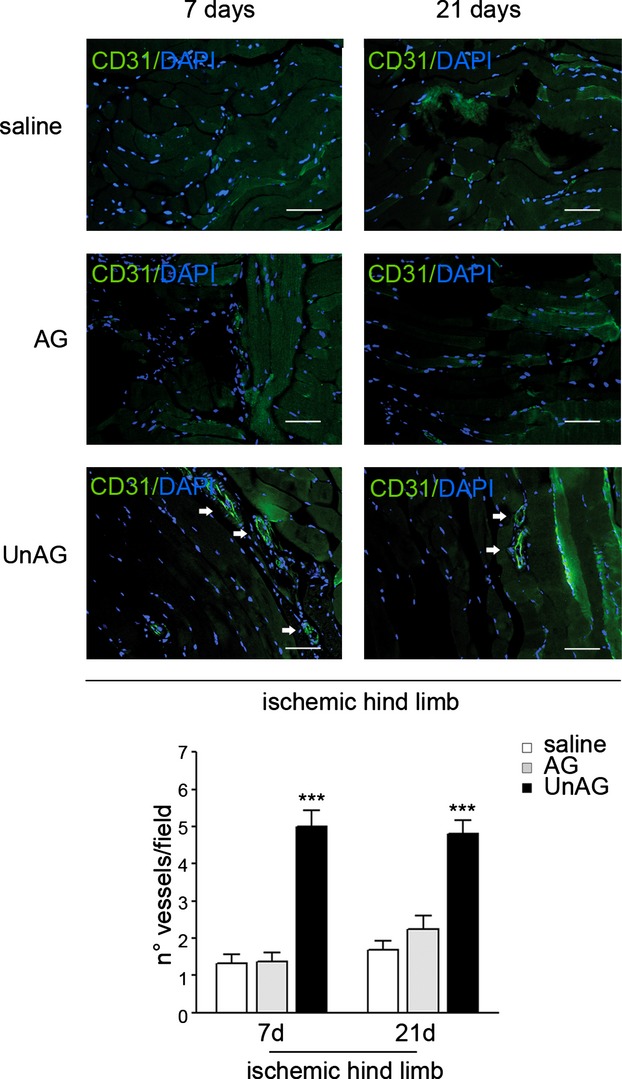
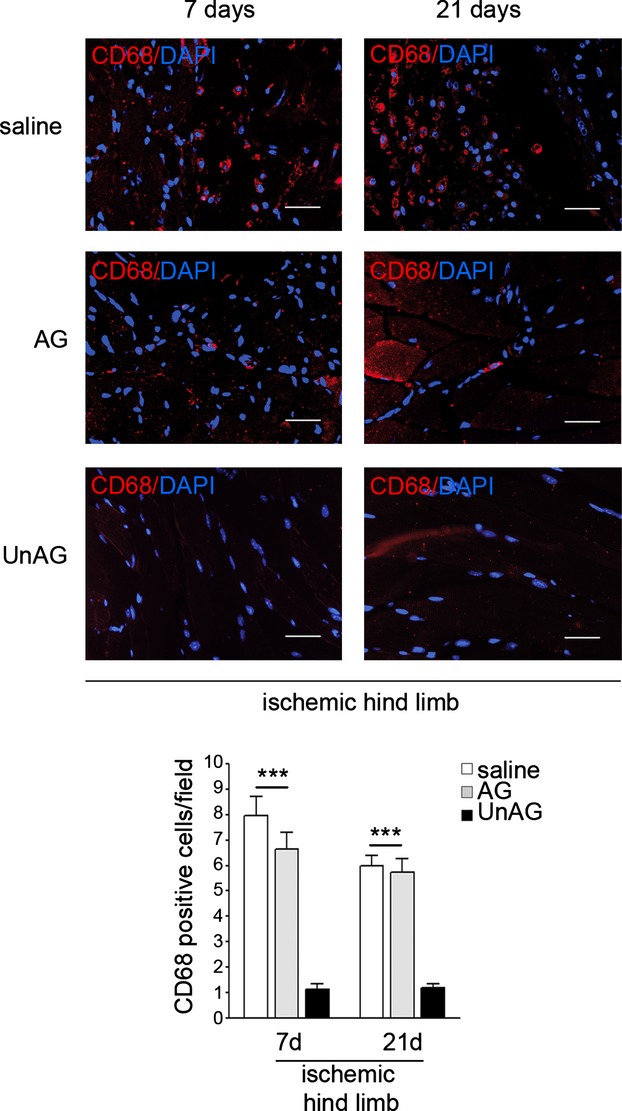
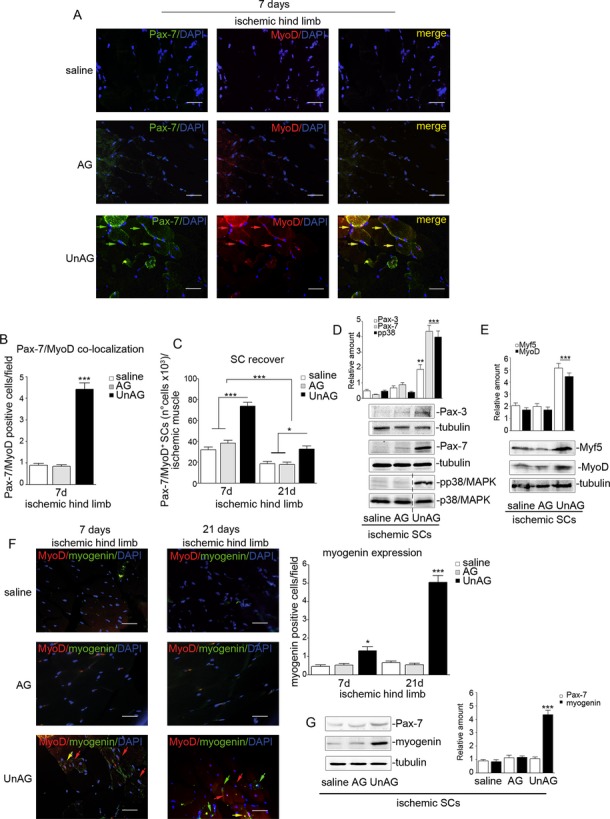
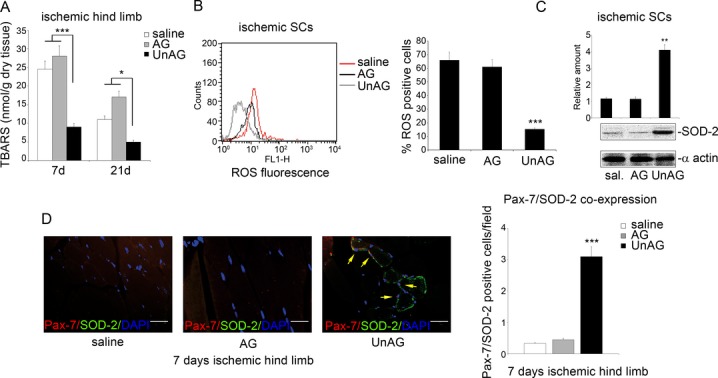
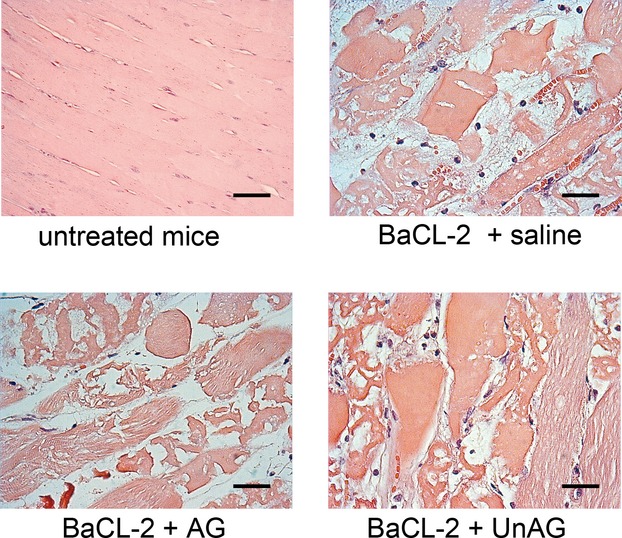
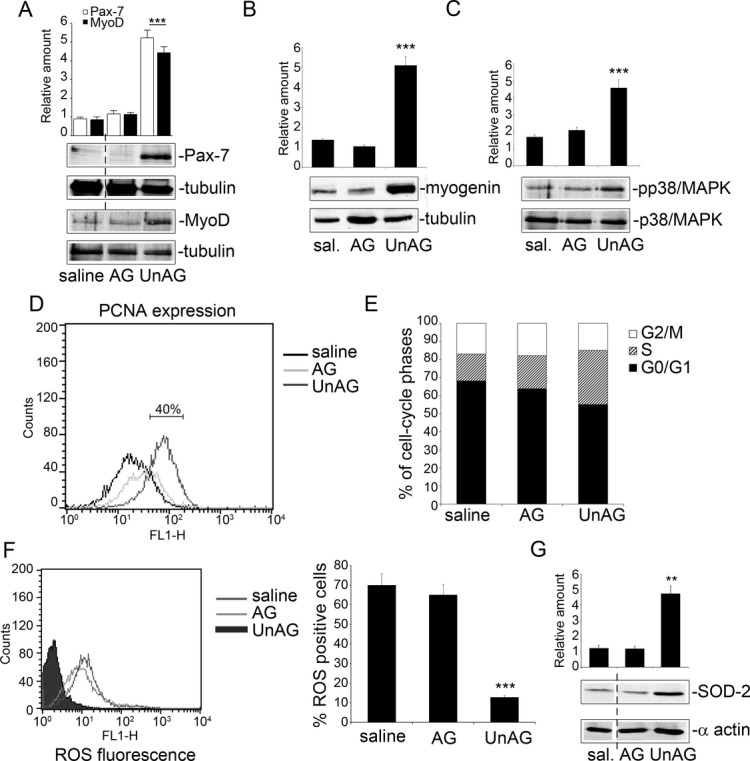
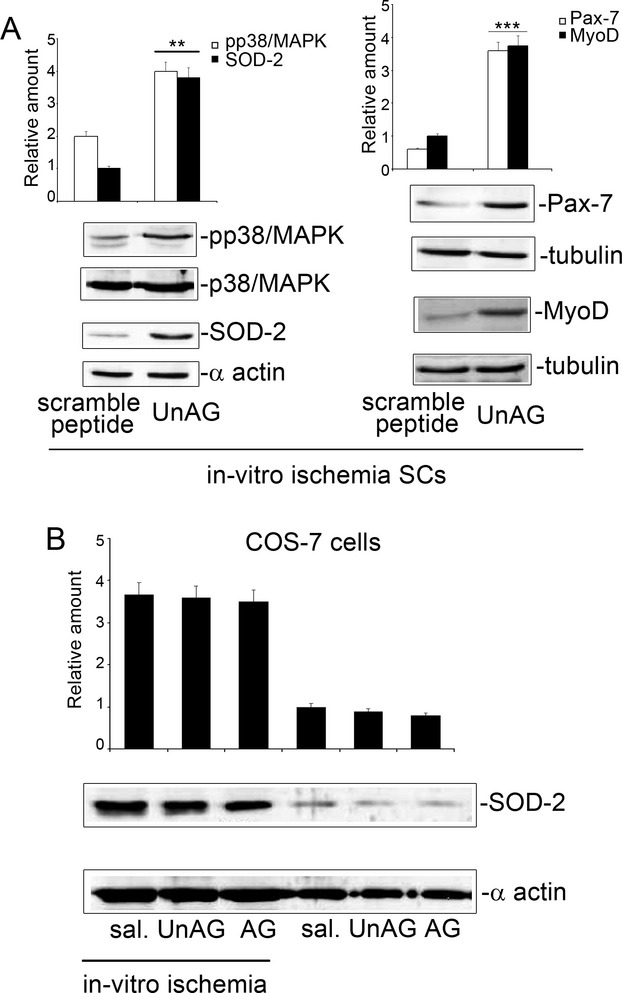
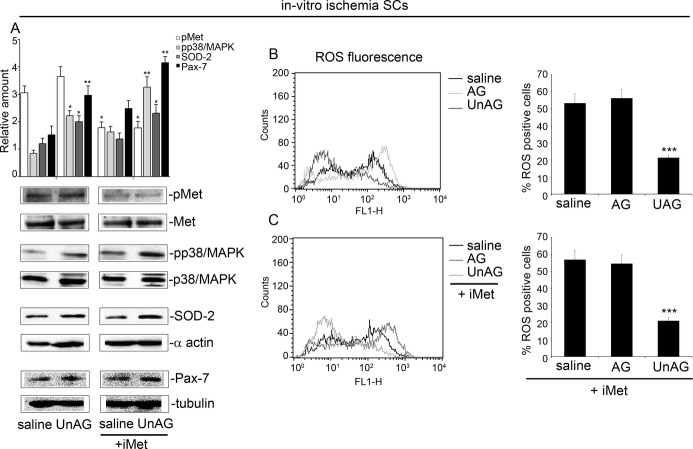
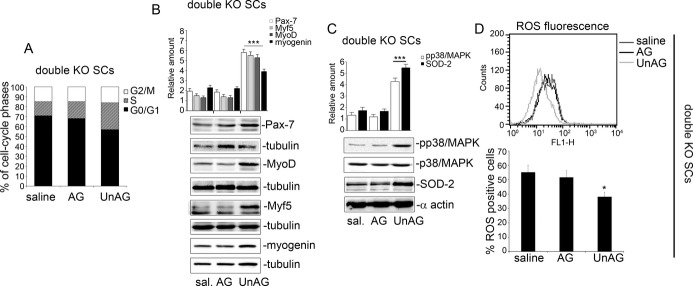
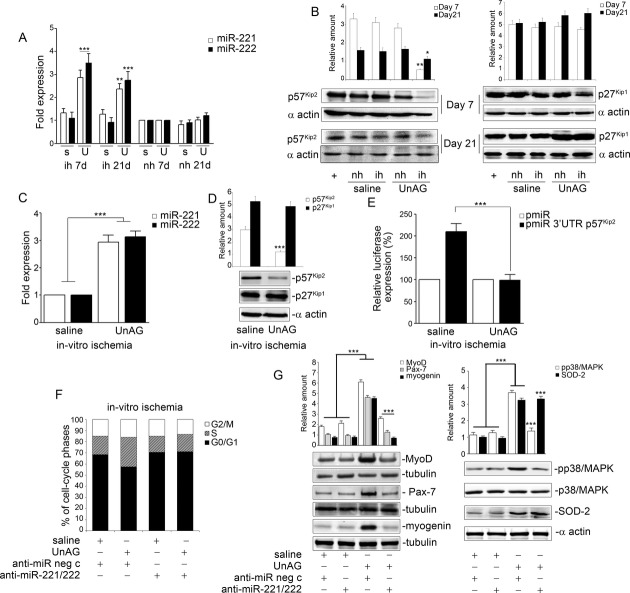
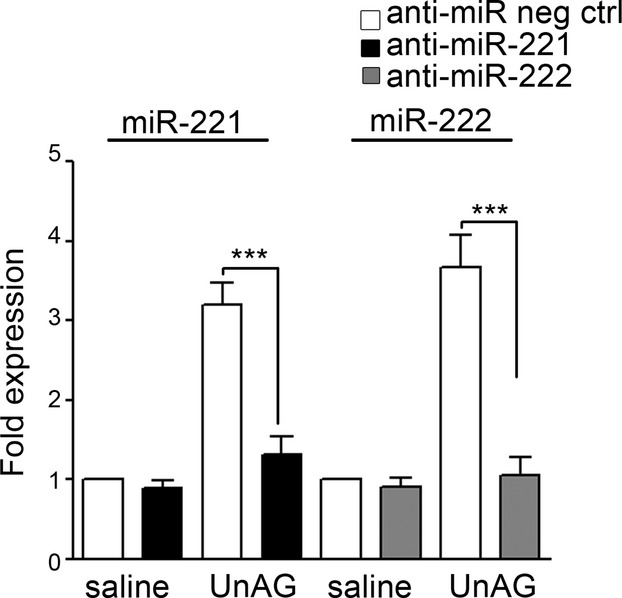
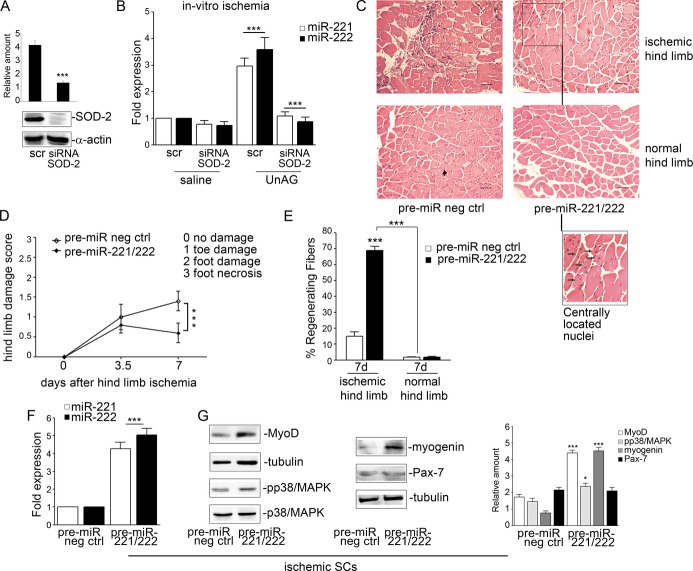
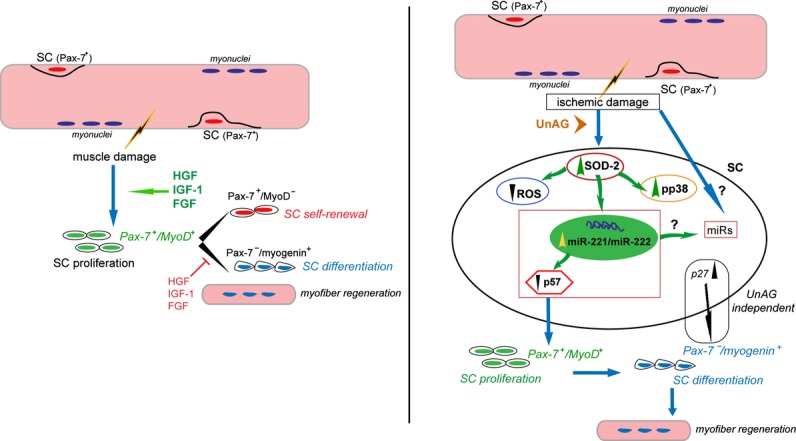
Methods and results: We show that UnAG but not acylated ghrelin (AG) induces skeletal muscle regeneration in response to ischemia via canonical p38/mitogen-actived protein kinase signaling UnAG protected against reactive oxygen species-induced cell injuries by inducing the expression of superoxide dismutase-2 (SOD-2) in satellite cells. This led to a reduced number of infiltrating CD68(+) cells and was followed by induction of the myogenic process and a reduction in functional impairment. Moreover, we found that miR-221/222, previously linked to muscle regeneration processes, was up-regulated and negatively correlated with p57(Kip2) expression in UnAG-treated mice. UnAG, unlike AG, promoted cell-cycle entry in satellite cells of mice lacking the genes for ghrelin and its receptor (GHSR1a). UnAG-induced p38/mitogen-actived protein kinase phosphorylation, leading to activation of the myogenic process, was prevented in SOD-2-depleted SCs. By siRNA technology, we also demonstrated that SOD-2 is the antioxidant enzyme involved in the control of miR-221/222-driven posttranscriptional p57(Kip2) regulation. Loss-of-function experiments targeting miR-221/222 and local pre-miR-221/222 injection in vivo confirmed a role for miR-221/222 in driving skeletal muscle regeneration after ischemia.

Conclusions: These results indicate that UnAG-induced skeletal muscle regeneration after ischemia depends on SOD-2-induced miR-221/222 expression and highlight its clinical potential for the treatment of reactive oxygen species-mediated skeletal muscle damage.

Keywords: ROS; UnAG; miRNAs; satellite cells; superoxide dismutase‐2.


Figures

Figure 1.
Figure 1.
UnAG protects against ischemia‐mediated functional impairment in skeletal muscle. A, Histogram representation of limb perfusion reported as ratio (mean±SEM, n=27 for each group) of ischemic to normal hindlimb for each group of mice (0b: before surgery; 0a: after surgery; ***P<0.001 ischemic limb vs normal limb). B, Foot damage score was evaluated for the indicated times as reported in Methods. Data are expressed as mean±SEM, n=27 (***P<0.001 ischemic limb of UnAG mice vs ischemic limb of AG and saline mice). C, The graph represents the number of vessels in ischemic (ih) and normo‐perfused (nh) gastrocnemius muscles of each group of animals, evaluated by 3 different operators counting 10 fields at ×40 magnification and are reported as mean±SEM (n=9 each group at day 7 and at day 21) of vessels per field (***P<0.001 ih muscles of UnAG mice vs ih muscles of AG and saline mice at days 7 and 21). D, Representative hematoxylin and eosin–stained sections of ischemic and normo‐perfused (normal) muscles from UnAG‐, AG‐, and saline‐treated mice, at days 7 and 21 post surgery. Scale bar: 80 μm (×20 magnification). Insets show myofibers at higher magnification; green arrows indicate regenerating myofibers, characterized by central nucleus location at days 7 and 21 in UnAG mice. E, Quantification of the percentage (mean±SEM) of regenerating fibers, characterized by the presence of centrally located nucleus. UnAG‐, AG‐, and saline‐treated mice were analyzed at days 7 and 21 postsurgery (***P<0.001 ischemic muscles of UnAG‐treated mice vs AG‐ and saline‐treated mice at days 7 and 21; normal muscles vs ischemic muscles of treated mice). F, Quantification of inflammatory cells in the ischemic and normal muscles of UnAG‐, AG‐, and saline‐treated mice, at days 7 and 21 postsurgery. Data are expressed as mean±SEM of CD68+ cells per field (×40 magnification) (***P<0.001 ischemic muscles of AG‐ and saline‐ vs UnAG‐treated mice at days 7 and 21; normal muscles vs ischemic muscles of treated mice). E and F: n=9 each group at day 7 and at day 21. AG indicates acylated ghrelin; UnAG, unacylated ghrelin.
Figure 2.
Figure 2.
Effects of UnAG and AG at days 1, 3, and 5 after ischemia. A, Foot damage score of treated mice was evaluated for the indicated times. Data are expressed as mean±SEM (n=3 each group at days 1, 3, and 5) (***P<0.001 ischemic limb of UnAG‐ vs AG‐ and saline‐treated mice). B, Representative hematoxylin and eosin–stained sections of ischemic muscles from UnAG‐, AG‐, and saline‐treated mice at days 1, 3, and 5 post surgery. Scale bar: 80 μm (×20 magnification). Black arrows indicate the inflammatory infiltrates. C, Sections of ischemic muscles recovered from treated mice at days 3 and 5 post surgery and stained for Pax‐7 (green), MyoD (red), and DAPI (blue). Yellow arrows indicate Pax‐7+/MyoD+ cells. Scale bar: 40 μm (×40 magnification). Quantification of Pax‐7+/MyoD+ cells per field (×40 magnification) in ischemic limb of treated mice is reported (mean±SEM (n=3 each group at days 3 and 5) (***P<0.001 Pax‐7+/MyoD+ cells in UnAG‐ vs AG‐ and saline‐treated mice at day 5). AG indicates acylated ghrelin; UnAG, unacylated ghrelin.
Figure 3.
Figure 3.
Vessel quantification. Sections of ischemic muscles recovered from saline‐, AG‐, and UnAG‐treated mice at days 7 and 21 post surgery and stained for CD31 (green) and DAPI (blue). White arrows indicate vessels. Scale bar: 40 μm (×40 magnification). The graph represents the number of vessels in ischemic muscles of each group of animals, evaluated by 3 different operators counting 10 fields at ×40 magnification, and reported as mean±SEM (n=9 each group at day 7 and at day 21) of vessels per field (***P<0.001 ischemic muscles of UnAG‐ vs AG‐ and saline‐treated mice at days 7 and 21). AG indicates acylated ghrelin; UnAG, unacylated ghrelin.
Figure 4.
Figure 4.
Inflammatory cell infiltration. Sections of ischemic muscles recovered from saline‐, AG‐, and UnAG‐treated mice at days 7 and 21 post surgery and stained for CD68 (red) and DAPI (blue). Scale bar: 40 μm (×40 magnification). Quantification of inflammatory cells in the ischemic muscles from UnAG‐, AG‐, and saline‐treated mice, at days 7 and 21 post surgery. Data are expressed as mean±SEM (n=9 each group at day 7 and at day 21) of CD68+ cells per field (×40 magnification) (***P<0.001 ischemic muscles of AG‐ and saline‐ vs UnAG‐treated mice at days 7 and 21). AG indicates acylated ghrelin; UnAG, unacylated ghrelin.
Figure 5.
Figure 5.
UnAG activates the myogenic process. A, Representative sections of ischemic muscles recovered from saline‐, AG‐, and UnAG‐treated mice stained for Pax‐7 (green), MyoD (red), and DAPI (blue). Yellow arrows indicate Pax7+/MyoD+ cells. Scale bar: 40 μm (×40 magnification). B, Quantification of Pax‐7+/MyoD+ cells in ischemic muscles at day 7. Data are expressed as mean±SEM of Pax‐7+/MyoD+ cells per field (×40 magnification) (***P<0.001 ischemic muscles from UnAG‐ vs AG‐ and saline‐treated mice at day 7). C, Number (mean±SEM) of Pax‐7+/MyoD+ SCs recovered from ischemic muscles of treated mice, at days 7 and 21 post surgery (*P<0.05 SCs from UnAG‐ vs AG‐ and saline‐treated mice at day 21; ***P<0.001 SCs from UnAG‐ vs AG‐ and saline‐treated mice at day 7; ***P<0.001 SCs from treated mice at day 7 vs day 21). D and E, Cell extracts from SCs recovered from ischemic muscles at day 7 were analyzed by Western blot for Pax‐3, Pax‐7, and phospho(p)‐p38/MAPK (D) or for Myf5 and MyoD content (E). Protein levels were normalized to tubulin or p38/MAPK content (**P<0.01 Pax‐3 content in ischemic SCs from UnAG‐ vs AG‐ and saline‐treated mice; ***P<0.001 Pax‐7 and p‐p38/MAPK content in ischemic SCs from UnAG‐ vs AG‐ and saline‐treated mice; ***P<0.001 Myf5 and Myo‐D content in ischemic SCs from UnAG‐ vs AG‐ and saline‐treated mice). F, Sections of ischemic muscles stained for MyoD (red), myogenin (green), and DAPI (blue) recovered from treated mice at days 7 and 21 post surgery. Red arrows indicate MyoD+ cells, green arrows indicate myogenin+ cells, and yellow arrow indicates MyoD+/myogenin+ cells. Scale bar: 40 μm (×40 magnification). Quantification of myogenin+ cells per field (×40 magnification) in ischemic limb of treated mice is reported (mean±SEM) (*P<0.05 myogenin+ cells in UnAG‐ vs AG‐ and saline‐treated mice at day 7; ***P<0.001 myogenin+ cells in UnAG‐ vs AG‐ and saline‐treated mice at day 21). G, Pax‐7 and myogenin content was evaluated by Western blot in SCs from ischemic muscles of treated animals (day 21). Protein level was normalized to tubulin content (***P<0.001 myogenin content in SCs from ischemic muscles of UnAG‐ vs AG‐ and saline‐treated mice). Results are representative of all experiments. A, B, C, and F, n=9 each group at days 7 and 21; D and E, n=9 each group at day 7; G, n=9 each group at day 21. AG indicates acylated ghrelin; SC, satellite cell; MAPK, mitogen‐activated protein kinase; UnAG, unacylated ghrelin.
Figure 6.
Figure 6.
Pax‐7 and MyoD co‐localization at day 21 after ischemia. Sections of ischemic muscle recovered from saline‐, AG‐, and UnAG‐treated mice at day 21 post surgery and stained for Pax‐7 (green), MyoD (red), and DAPI (blue). Yellow arrows indicate merged Pax7+/MyoD+ cells. Scale bar: 40 μm (×40 magnification). Quantification of Pax7+/MyoD+cells in ischemic muscles of treated animals at day 21 is reported. Data are expressed as mean±SEM (n=9 each group at day 7 and at day 21) of Pax7+/MyoD+ cells per field (×40 magnification) (***P<0.001 ischemic muscles of UnAG‐ vs AG‐ and saline‐treated mice at day 21). AG indicates acylated ghrelin; UnAG, unacylated ghrelin.
Figure 7.
Figure 7.
UnAG prevents ROS production in SCs by inducing SOD‐2 expression. A, TBARS were determined in gastrocnemius muscle of UnAG‐, AG‐, and saline‐treated mice at days 7 and 21 after ischemia. Values are expressed as nanomoles per gram of dry tissue (mean±SEM, n= 6 each group at days 7 and 21) (***P<0.001 ischemic muscle of UnAG‐treated mice vs AG‐ and saline‐treated mice at day 7; *P<0.05 ischemic muscle of UnAG‐treated mice vs AG‐ and saline‐treated mice at day 21). B, To evaluate ROS generation, DCF‐DA assay was performed on SCs recovered from muscles of UnAG‐, AG‐, and saline‐treated mice at day 7 after ischemia. The percentage of DCF‐DA+ cells (mean±SEM, n=6 each group) is reported (***P<0.001 ROS generation in ischemic muscles from UnAG‐ vs AG‐ and saline‐treated mice). C, SCs recovered from ischemic muscles of treated mice were subjected to Western blot normalized to α‐actin content; SOD‐2 content was evaluated. The results are representative of all experiments (n=6 each group) (***P<0.001 ischemic SCs from UnAG‐ vs AG‐ and saline‐treated mice). D, Representative stained sections for Pax‐7 (red), SOD‐2 (green), and DAPI (blue) of muscles recovered at day 7 after ischemia. Yellow arrows indicate Pax7+/SOD‐2+ cells. Scale bar: 40 μm (×40 magnification). Quantification of Pax‐7+/SOD‐2+ cells per field (×40 magnification) in ischemic muscles of treated mice is reported in the histogram (mean±SEM, n=9 each group) (***P<0.001 UnAG treatment vs AG and saline treatment at day 7). AG indicates acylated ghrelin; DCF‐DA, 5‐ (and 6‐)carboxy‐2′,7′‐dichlorofluorescein diacetate; ROS, reactive oxygen species; SC, satellite cell; SOD‐2, superoxide dismutase‐2; UnAG, unacylated ghrelin; TBARS, thiobarbituric acid reactive substances.
Figure 8.
Figure 8.
UnAG has no protective effect against toxic damage. Representative hematoxylin and eosin–stained sections of toxic damage induced by injection of 1% barium chloride (BaCl2) in gastrocnemius muscles of C57BL/6J mice. Mice were treated as indicated, n=3 each group. AG indicates acylated ghrelin; UnAG, unacylated ghrelin.
Figure 9.
Figure 9.
UnAG effects are recapitulated in vitro in primary SCs. A through C, SCs recovered from normoperfused muscles were treated for 72 hours with the indicated stimuli and subjected to in vitro ischemia for an additional 24 hours. Cell extracts were analyzed by Western blot for Pax‐7 and MyoD (A), for myogenin (B), and for p‐p38/MAPK content (C) by densitometry (relative amount). Protein levels were normalized to tubulin or p38/MAPK content. The results are representative of 5 different experiments performed in triplicate (n=5) (***P<0.001 Pax‐7 and MyoD [A], myogenin [B], and p‐p38/MAPK [C] content in UnAG‐ vs AG‐ or saline‐treated SCs). D, SCs subjected to in vitro ischemia and treated as indicated were analyzed by FACS for PCNA expression. The graph is representative of 5 independent experiments. E, FACS analysis indicates the percentage of SCs, treated as above, in the different cell‐cycle phases. The results are representative of 5 different experiments performed in triplicate. F, To evaluate ROS generation, DCF‐DA assay was performed on SCs subjected to in vitro ischemia and treated as indicated. The percentage of DCF‐DA+ cells (mean±SEM, n=5) is reported (***P<0.001 ROS generation in UnAG‐ vs AG‐ and saline‐treated SCs). G, SOD‐2 content was analyzed by Western blot (normalized to α‐actin) in SCs subjected to in vitro ischemia. The results are representative of 5 different experiments performed in triplicate (**P<0.01 UnAG‐ vs AG‐ and saline‐treated SCs). AG indicates acylated ghrelin; DCF‐DA, 5‐ (and 6‐)carboxy‐2′,7′‐dichlorofluorescein diacetate; MAPK, mitogen‐activated protein kinase; ROS, reactive oxygen species; SC, satellite cell; SOD‐2, superoxide dismutase‐2; UnAG, unacylated ghrelin; FACS, fluorescence‐activated cell sorting; PCNA, proliferating cell nuclear antigen.
Figure 10.
Figure 10.
UnAG induces SC cell‐cycle entry via SOD‐2 and p38/MAPK phosphorylation. A, SCs recovered from normo‐perfused muscles were treated for 72 hours with the indicated stimuli and subjected to in vitro ischemia. SOD‐2 content was evaluated in SCs transfected for the last 48 hours with scramble or SOD‐2 siRNA. Protein level was normalized to α‐actin. The results are representative of 4 different experiments performed in triplicate (***P<0.001 SCs transfected with the SOD‐2 siRNA vs SCs transfected with the scramble). B, To evaluate ROS generation, DCF‐DA assay was performed on SCs depleted for SOD‐2 and treated as indicated (n=4). C, FACS analysis indicates the percentage of SCs transfected with scramble or with SOD‐2 siRNA in the presence of UnAG in the different cell‐cycle phases. The results are representative of 4 different experiments performed in triplicate. D, SCs transfected with scramble or SOD‐2 siRNA and subjected to in vitro ischemia in the presence of UnAG were analyzed by Western blot for p‐p38/MAPK content by densitometry (relative amount). The results are representative of 4 different experiments performed in triplicate (**P<0.01 SOD‐2–silenced SCs vs scramble‐transfected SCs). E, FACS analysis indicates the percentage of SCs in the different cell‐cycle phases following treatment with the indicated stimuli. The results are representative of 4 different experiments performed in triplicate. F, Cell extracts from SCs treated as indicated were analyzed by Western blot for MyoD and myogenin content by densitometry (relative amount). Protein levels were normalized to tubulin content. The results are representative of 4 different experiments performed in triplicate. AG indicates acylated ghrelin; DCF‐DA, 5‐(and 6‐)carboxy‐2′,7′‐dichlorofluorescein diacetate; ROS, reactive oxygen species; SC, satellite cell; siRNA, small interfering RNA; MAPK, mitogen‐activated protein kinase; SOD‐2, superoxide dismutase‐2; UnAG, unacylated ghrelin; FACS, fluorescence‐activated cell sorting.
Figure 11.
Figure 11.
A, Scramble peptide vs UnAG treatment. SCs recovered from normo‐perfused muscles and subjected to in vitro ischemia were treated with scramble peptide or UnAG. Cell extracts were analyzed by Western blot for p‐p38/MAPK and SOD‐2 (left) and for Pax‐7 and MyoD (right) content by densitometry (relative amount). Protein levels were normalized to p38/MAPK, α‐actin, or tubulin content. The results are representative of 5 different experiments performed in triplicate (***P<0.001 p‐p38/MAPK and SOD‐2 content in UnAG‐treated SCs vs scramble‐treated SCs; ***P<0.001 Pax‐7 and MyoD content in UnAG‐treated SCs vs scramble‐treated SCs). B, SOD‐2 content in UnAG‐treated non‐SCs. Cell extracts from COS‐7 cells, treated as indicated and subjected or not to in vitro ischemia, were analyzed by Western blot for SOD‐2 content by densitometry (relative amount). Protein levels were normalized to α‐actin content. The results are representative of 5 different experiments performed in triplicate. AG indicates acylated ghrelin; SC, satellite cell; SOD‐2, superoxide dismutase‐2; UnAG, unacylated ghrelin.
Figure 12.
Figure 12.
Akt is not involved in UnAG‐mediated signals in C2C12 cells subjected to in vitro ischemia. A, Cell extracts from C2C12 cells, treated as indicated and subjected to in vitro ischemia, were analyzed by Western blot for pAkt, SOD‐2, p‐p38/MAPK, Pax‐7, and myogenin content by densitometry (relative amount). Protein levels were normalized to Akt, α‐actin, p38/MAPK, or tubulin content. The results are representative of 5 different experiments performed in triplicate (*P<0.05 myogenin content in UnAG‐treated cells+iAkt vs AG‐ and saline‐treated cells+iAkt; **P<0.01 SOD‐2 content UnAG‐treated cells+iAkt vs saline‐treated cells+iAkt; myogenin content in UnAG‐ vs AG‐ and saline‐treated cells; ***P<0.001 SOD‐2, p‐p38/MAPK, and Pax‐7 content in UnAG‐ vs AG‐ and saline‐treated cells; ***P<0.001 p‐p38/MAPK and Pax‐7 content in UnAG‐treated cells+iAkt vs saline‐treated cells+iAkt). B and C, To evaluate ROS generation, DCF‐DA assay was performed on C2C12 cells subjected to in vitro ischemia and treated as indicated in the presence or absence of Akt inhibitor. The percentage of DCF‐DA+ cells (mean±SEM, n=5) is reported (***P<0.001 ROS generation in UnAG‐ vs AG‐ and saline‐treated cells in the presence or absence of Akt inhibitor). AG indicates acylated ghrelin; DCF‐DA, 5‐ (and 6‐)carboxy‐2′,7′‐dichlorofluorescein diacetate; ROS, reactive oxygen species; SOD‐2, superoxide dismutase‐2; UnAG, unacylated ghrelin.
Figure 13.
Figure 13.
The c‐Met kinase inhibitor does not affect UnAG‐mediated signals in SCs subjected to in vitro ischemia. A, Cell extracts from SCs, treated with saline and UnAG in the presence or absence of c‐Met kinase inhibitor and subjected to in vitro ischemia, were analyzed by Western blot for phospho‐c‐Met (pMet), p‐p38/MAPK, SOD‐2, and Pax‐7 content by densitometry (relative amount). Protein levels were normalized to c‐Met, p38/MAPK, α‐actin, or tubulin content. The results are representative of 5 different experiments performed in triplicate (*P<0.05 p‐p38/MAPK and SOD‐2 content in UnAG‐ vs saline‐treated cells; pMet content in saline‐ and UnAG‐treated cells+iMet vs saline‐ and UnAG‐treated cells; SOD‐2 content in UnAG‐treated cells+iMet vs saline‐treated cells+iMet **P<0.01 Pax‐7 content in UnAG‐ vs saline‐treated cells; p‐p38/MAPK and Pax‐7content in UnAG‐treated cells+iMet vs saline‐treated cells+iMet). B and C, To evaluate ROS generation, DCF‐DA assay was performed on SCs subjected to in vitro ischemia and treated as indicated in the presence or absence of c‐Met kinase inhibitor. The percentage of DCF‐DA+ cells (mean±SEM, n=5) is reported (***P<0.001 ROS generation in UnAG‐ vs AG‐ and saline‐treated cells in the presence or absence of c‐Met kinase inhibitor). AG indicates acylated ghrelin; DCF‐DA, 5‐ (and 6‐)carboxy‐2′,7′‐dichlorofluorescein diacetate; ROS, reactive oxygen species; SC, satellite cell; SOD‐2, superoxide dismutase‐2; UnAG, unacylated ghrelin.
Figure 14.
Figure 14.
UnAG induces cell‐cycle entry of SCs from double‐KO mice via SOD‐2 and p38/MAPK phosphorylation. A, SCs recovered from double‐KO mice were stimulated with saline, AG, and UnAG and subjected to in vitro ischemia. FACS analysis was performed to evaluate SC cell‐cycle progression. The results are representative of 5 different experiments performed in triplicate. B and C, Cell extracts from KO‐derived SCs, treated as indicated and subjected to in vitro ischemia, were analyzed by Western blot for Pax‐7, MyoD, Myf5, and myogenin (B) and for p‐p38/MAPK and SOD‐2 (C) content by densitometry (relative amount). Protein levels were normalized to tubulin, p38/MAPK, or α‐actin content. The results are representative of 5 different experiments performed in triplicate (***P<0.001 Pax‐7, MyoD, Myf5, and myogenin content in SCs derived from UnAG‐ vs AG‐ and saline‐treated double‐KO mice; ***P<0.001 p‐p38/MAPK and SOD‐2 in SCs derived from UnAG‐ vs AG‐ and saline‐treated double‐KO mice). D, To evaluate ROS generation, DCF‐DA assay was performed on SCs derived from double‐KO mice, treated as indicated. The percentage of DCF‐DA+ cells (mean±SEM, n=5) is reported (*P<0.05 ROS generation in UnAG‐ vs AG‐ and saline‐treated SCs). AG indicates acylated ghrelin; DCF‐DA, 5‐ (and 6‐)carboxy‐2′,7′‐dichlorofluorescein diacetate; KO, knockout; ROS, reactive oxygen species; SC, satellite cell; SOD‐2, superoxide dismutase‐2; UnAG, unacylated ghrelin.
Figure 15.
Figure 15.
UnAG induces SC cell‐cycle entry by regulating miR‐221/222 expression. A, miR‐221/222 expression was evaluated by qRT‐PCR on SCs from ischemic (ih) and nonischemic (nh) muscles of mice treated as indicated, at days 7 and 21 post surgery. Data normalized to RNU6B are representative of 9 experiments (n=9 each group) (miR‐221/222 expression: ***P<0.001 ih SCs from UnAG‐ vs saline‐treated mice at day 7; **P<0.01 ih SCs from UnAG‐ vs saline‐treated mice for miR‐221 and ***P<0.001 ih SCs from UnAG‐ vs saline‐treated mice for miR‐222 at day 21 [s indicates saline; U, UnAG]). B, p57kip2 and p27kip1 content was analyzed in SCs from ih and nh muscles at days 7 and 21 by densitometry (relative amount) (n=9 each group at days 7 and 21: **P<0.01 p57kip2 in SCs from ischemic muscle of UnAG‐treated mice vs the other experimental groups at day 7; *P<0.05 p57kip2 in ih SCs from UnAG‐ vs saline‐treated mice at day 21). C, miR‐221/222 expression was analyzed by qRT‐PCR on SCs from nh muscles subjected to in vitro ischemia and treated as indicated. Data normalized to RNU6B are representative of 5 different experiments performed in triplicate (***P<0.001 UnAG‐ vs saline‐treated SCs). D, Cell extracts from SCs treated as above were analyzed for p57kip2 and p27kip1 content and normalized to α‐actin content. The results are representative of 5 different experiments performed in triplicate (***P<0.001 p57kip2 in UnAG‐ vs saline‐treated SCs). E, SCs were transfected with pmiR empty vector or pmiR‐3′‐UTR p57kip2 luciferase constructs, treated as indicated and subjected to in vitro ischemia. The relative luciferase expression is reported (***P<0.001 UnAG‐ vs saline‐treated SCs) (n=3). F, SCs, transfected with anti‐miR negative control (neg c) or anti–miR‐221/222 were subjected to in vitro ischemia. SC cell‐cycle progression was analyzed by FACS. Results are representative of 5 different experiments performed in triplicate. G, MyoD, Pax‐7, myogenin, p‐p38/MAPK, and SOD‐2 content was analyzed on SCs stimulated as above. Protein levels were normalized to tubulin, p38/MAPK, or α‐actin content. Results are representative of 5 different experiments performed in triplicate (***P<0.001 Pax‐7, MyoD, myogenin, and p‐p38/MAPK in UnAG‐treated SCs+anti‐miR neg c vs saline‐treated SCs+anti‐miR neg c; ***P<0.001 SOD‐2 in UnAG‐treated SCs+anti‐miR neg c and UnAG‐treated SCs+anti–miR‐221/222 vs saline treatment; ***P<0.001 MyoD, Pax‐7, myogenin, and p‐p38/MAPK content in UnAG‐treated SCs+anti–miR‐221/222 vs UnAG‐treated SCs+anti‐miR neg c). qRT‐PCR indicates quantitative real‐time PCR; miR, microRNA; SC, satellite cell; SOD‐2, superoxide dismutase‐2; UnAG, unacylated ghrelin; FACS, fluorescence‐activated cell sorting.
Figure 16.
Figure 16.
In vitro loss‐of‐function experiments. Following transfection with anti‐miR neg ctrl or anti–miR‐221/222, qRT‐PCR was performed on SCs treated as indicated to evaluate miR‐221 and miR‐222 expression. The reported data are normalized to RNU6B and are representative of 5 experiments (***P<0.001 miR‐221 and miR‐222 expression in UnAG‐treated SCs+anti–miR‐221/222 vs UnAG‐treated SCs+anti‐miR neg ctrl). qRT‐PCR indicates quantitative real‐time PCR; miR, microRNA; SC, satellite cell; UnAG, unacylated ghrelin.
Figure 17.
Figure 17.
In vivo miR‐221/222 expression recapitulates UnAG effects. A, SCs recovered from normo‐perfused muscles were treated for 72 hours with the indicated stimuli and subjected to in vitro ischemia. SOD‐2 content was evaluated in SCs transfected for the past 48 hours with scramble or SOD‐2 siRNA. Protein level was normalized to α‐actin. The results are representative of 3 different experiments performed in triplicate (***P<0.001 SOD‐2 siRNA‐ vs scramble‐transfected SCs). B, miR‐221/222 expression was evaluated by qRT‐PCR on SCs silenced for SOD‐2 and subjected to in vitro ischemia. Data normalized to RNU6B are representative of 4 different experiments performed in triplicate (***P<0.001 UnAG‐treated SCs transfected with scramble vs saline‐treated cells; ***P<0.001 UnAG‐treated SCs transfected with SOD‐2 siRNA vs UnAG‐treated SCs transfected with scramble). C, Representative hematoxylin and eosin–stained sections of ischemic and normo‐perfused (normal) muscles of mice injected with pre‐miR negative control (neg ctrl) or with pre‐miR‐221/222, killed at day 7 post surgery. Scale bar: 80 μm (×20 magnification). Inset shows myofibers at higher magnification; green arrows indicate regenerating myofibers, characterized by central nucleus location at day 7 in mice expressing pre–miR‐221/222. D, Foot damage score of treated mice evaluated for the indicated times. Data are expressed as mean±SEM (n=5) (***P<0.001 ischemic limb of pre–miR‐221/222–treated vs pre‐miR neg ctrl–treated mice). E, Percentage (mean±SEM) of regenerating fibers in pre‐miR neg ctrl or pre–miR‐221/222–treated mice after ischemia (n=5) (***P<0.001 ischemic muscles of pre–miR‐221/222–treated vs pre‐miR neg ctrl–treated mice at day 7; normal muscles vs ischemic muscles of treated mice). F, miR‐221/222 expression was evaluated by qRT‐PCR on SCs recovered from mice treated as indicated 7 days after ischemia. Data normalized to RNU6B are representative of 5 different experiments (***P<0.001 miR‐221/222 expression in ischemic SCs from pre–miR‐221/222–treated vs pre‐miR neg ctrl–treated mice). G, MyoD, p‐p38/MAPK, myogenin and Pax‐7 content was analyzed in SCs recovered from mice treated as above and normalized to tubulin content. The results are representative of 5 different experiments (***P<0.001 MyoD, and myogenin content in ischemic SCs from pre–miR‐221/222–treated vs pre‐miR neg ctrl mice; *P<0.05 p‐p38/MAPK content in ischemic SCs from pre–miR‐221/222–treated vs pre‐miR neg ctrl mice). qRT‐PCR indicates quantitative real‐time PCR; miR, microRNA; SC, satellite cell; SOD‐2, superoxide dismutase‐2; UnAG, unacylated ghrelin.
Figure 18.
Figure 18.
Schematic representation of the molecular events activated by UnAG treatment following ischemia. Left: SC proliferation in response to muscle damage. Following muscle damage in response to microenvironmental stimuli, quiescent SCs undergo proliferation and differentiation to form new myofibers. Right: Proposed mechanism of UnAG action in response to ischemia. Following ischemic damage, quiescent SCs, protected from ROS generation by UnAG‐mediated SOD‐2 expression and miR‐221/222–driven p57Kip2 posttranscriptional regulation, proliferate. As UnAG treatment leads to skeletal muscle regeneration, we hypothesize that the balance between p27Kip1 and p57Kip2 content or, alternatively, the expression of miRs different from miR‐221/222 or regulated by miR‐221/222 might be relevant for the entire regenerative process. FGF indicates fibroblast growth factor; HGF, hepatocyte growth factor; IGF‐1, insulin‐like growth factor‐1; miR, microRNA; ROS, reactive oxygen species; SC, satellite cell; SOD‐2, superoxide dismutase‐2; UnAG, unacylated ghrelin.

Similar articles

Cited by

References

    1. Weitz JI, Byrne J, Clagett GP, Farkouh ME, Porter JM, Sackett DL, Strandness DE, Jr, Taylor LM. Diagnosis and treatment of chronic arterial insufficiency of the lower extremities: a critical review. Circulation. 1996; 94:3026-3049 - PubMed
    1. Alexander CM, Landsman PB, Teutsch SM, Haffner SMThird National Health and Nutrition Examination Survey (NHANES III); National Cholesterol Education Program (NCEP) NCEP‐defined metabolic syndrome, diabetes, and prevalence of coronary heart disease among NHANES III participants age 50 years and older. Diabetes. 2003; 52:1210-1214 - PubMed
    1. Gray BH, Conte MS, Dake MD, Jaff MR, Kandarpa K, Ramee SR, Rundback J, Waksman RAmerican Heart Association Writing Group 7 Atherosclerotic Peripheral Vascular Disease Symposium II: lower‐extremity revascularization: state of the art. Circulation. 2008; 118:2864-2872 - PubMed
    1. Cieri E, Lenti M, De Rango P, Isernia G, Marucchini A, Cao P. Functional ability in patients with critical limb ischaemia is unaffected by successful revascularisation. Eur J Vasc Endovasc Surg. 2011; 41:256-263 - PubMed
    1. Pipinos II, Judge AR, Selsby JT, Zhu Z, Swanson SA, Nella AA, Dodd SL. The myopathy of peripheral arterial occlusive disease: Part 2. Oxidative stress, neuropathy, and shift in muscle fiber type. Vasc Endovascular Surg. 2008; 42:101-112 - PubMed

Publication types

MeSH terms