. 2013 Dec 5;3(12):e004277.
doi: 10.1136/bmjopen-2013-004277.

Do healthier foods and diet patterns cost more than less healthy options? A systematic review and meta-analysis

Affiliations

Do healthier foods and diet patterns cost more than less healthy options? A systematic review and meta-analysis

Mayuree Rao et al. BMJ Open. .

Abstract

Objective: To conduct a systematic review and meta-analysis of prices of healthier versus less healthy foods/diet patterns while accounting for key sources of heterogeneity.

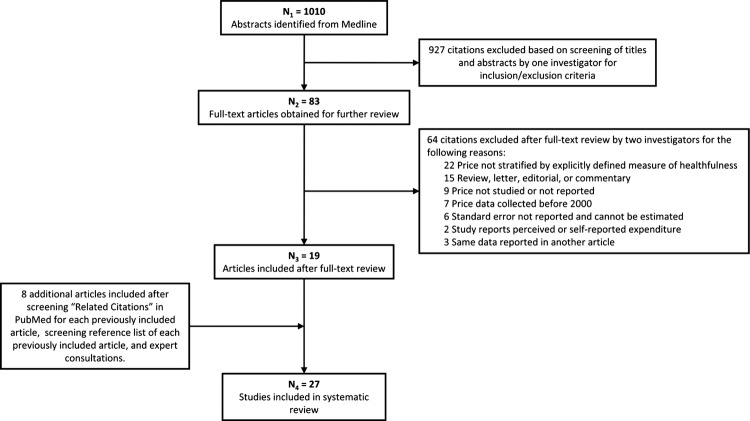
Data sources: MEDLINE (2000-2011), supplemented with expert consultations and hand reviews of reference lists and related citations.

Design: Studies reviewed independently and in duplicate were included if reporting mean retail price of foods or diet patterns stratified by healthfulness. We extracted, in duplicate, mean prices and their uncertainties of healthier and less healthy foods/diet patterns and rated the intensity of health differences for each comparison (range 1-10). Prices were adjusted for inflation and the World Bank purchasing power parity, and standardised to the international dollar (defined as US$1) in 2011. Using random effects models, we quantified price differences of healthier versus less healthy options for specific food types, diet patterns and units of price (serving, day and calorie). Statistical heterogeneity was quantified using I(2) statistics.

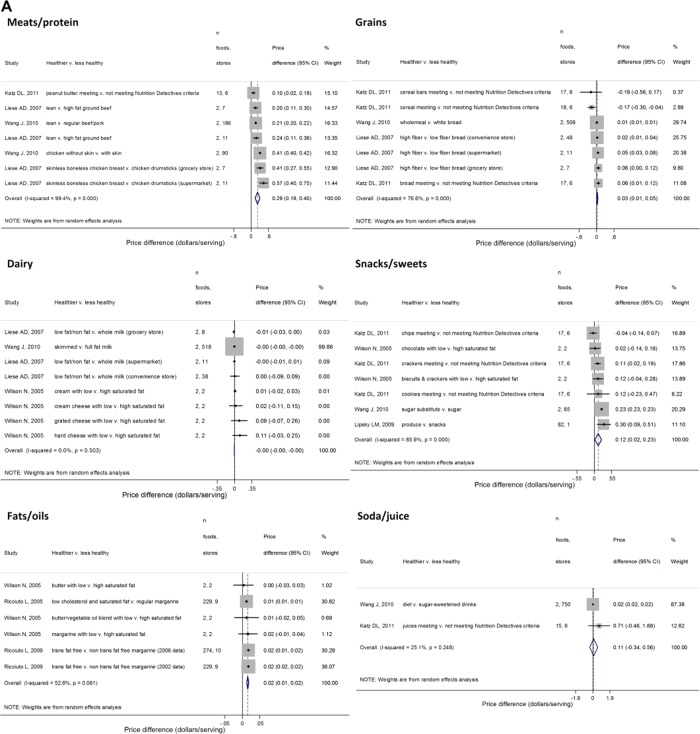
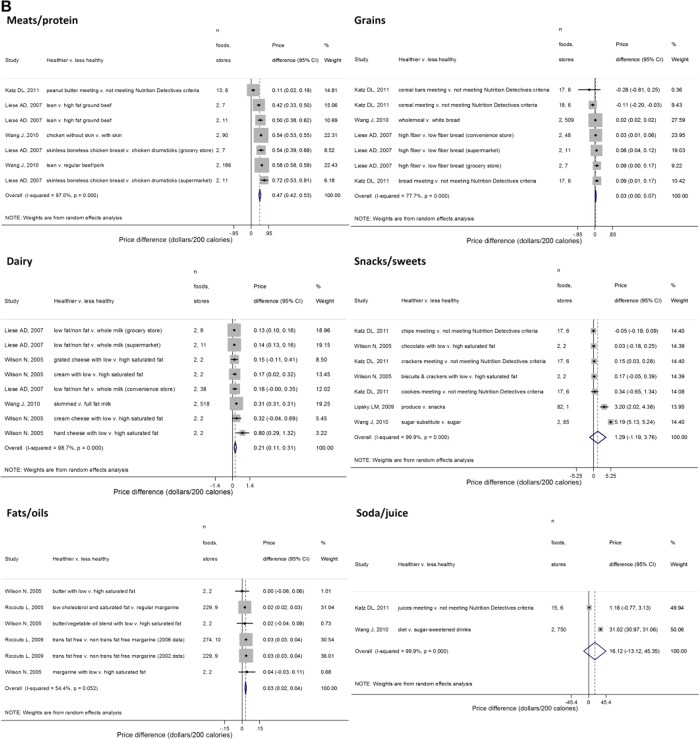
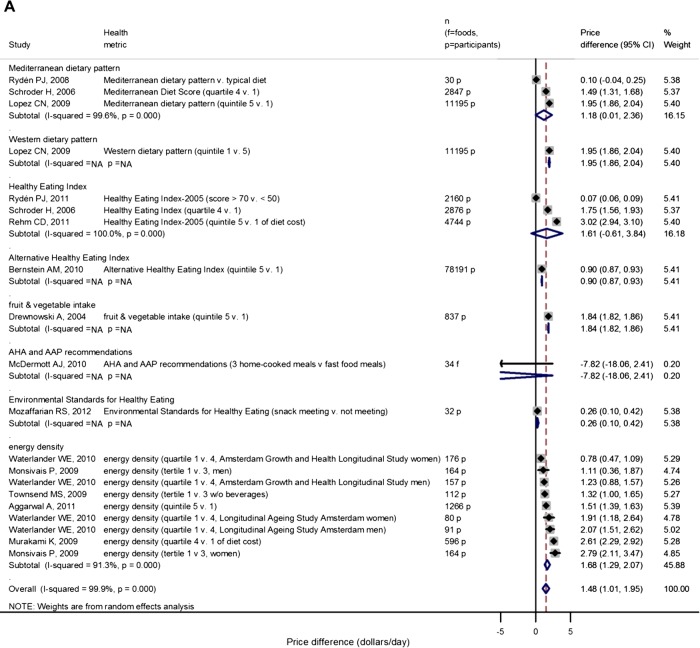
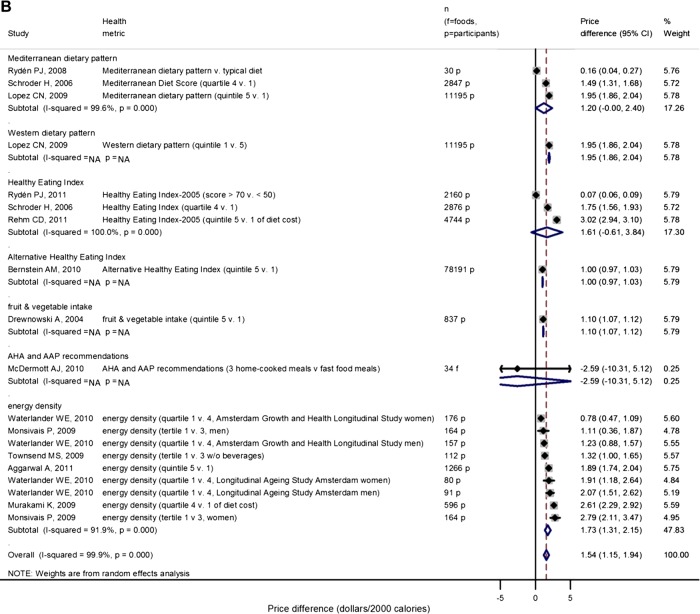
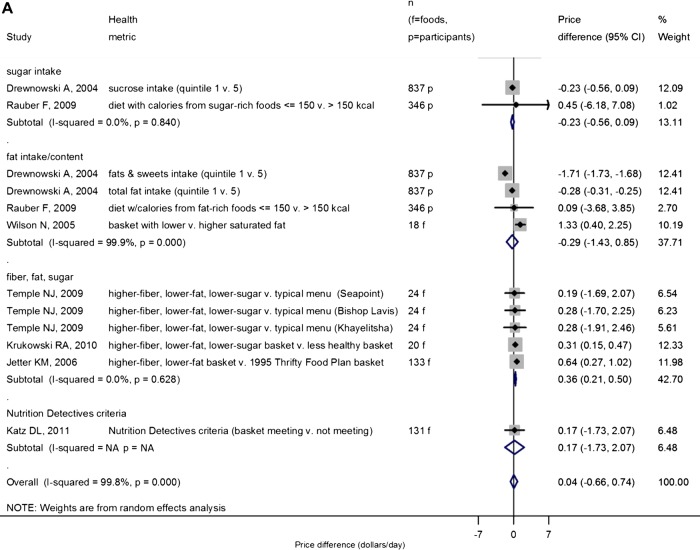
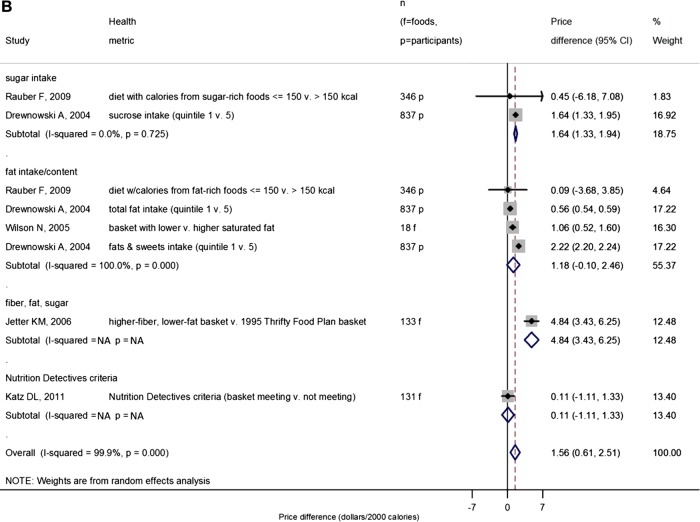
Results: 27 studies from 10 countries met the inclusion criteria. Among food groups, meats/protein had largest price differences: healthier options cost $0.29/serving (95% CI $0.19 to $0.40) and $0.47/200 kcal ($0.42 to $0.53) more than less healthy options. Price differences per serving for healthier versus less healthy foods were smaller among grains ($0.03), dairy (-$0.004), snacks/sweets ($0.12) and fats/oils ($0.02; p<0.05 each) and not significant for soda/juice ($0.11, p=0.64). Comparing extremes (top vs bottom quantile) of food-based diet patterns, healthier diets cost $1.48/day ($1.01 to $1.95) and $1.54/2000 kcal ($1.15 to $1.94) more. Comparing nutrient-based patterns, price per day was not significantly different (top vs bottom quantile: $0.04; p=0.916), whereas price per 2000 kcal was $1.56 ($0.61 to $2.51) more. Adjustment for intensity of differences in healthfulness yielded similar results.

Conclusions: This meta-analysis provides the best evidence until today of price differences of healthier vs less healthy foods/diet patterns, highlighting the challenges and opportunities for reducing financial barriers to healthy eating.

Keywords: HEALTH ECONOMICS; PREVENTIVE MEDICINE; PUBLIC HEALTH; SOCIAL MEDICINE.


Figures

Figure 1
Figure 1
Search and screening of studies comparing prices of healthier and less healthy foods or diet patterns.
Figure 2
Figure 2
Price difference between healthier and less healthy foods per serving (A) and per 200 kcal (B). Price difference defined as the healthier category minus the less healthy category. Standardised serving sizes were derived from the 2011 United States Department of Agriculture (USDA) MyPlate guidelines or, if not available from MyPlate, nutrition labels from a major grocery website. Calorie-adjustment of price differences based on the USDA database. Summary estimates were generated using a random effects model in which the studies were weighted according to the inverse variance of the price difference. All estimates were adjusted for inflation and purchasing power parity—standardised to the international dollar, defined as US$1—by country to reflect the prices in 2011.
Figure 2
Figure 2
Price difference between healthier and less healthy foods per serving (A) and per 200 kcal (B). Price difference defined as the healthier category minus the less healthy category. Standardised serving sizes were derived from the 2011 United States Department of Agriculture (USDA) MyPlate guidelines or, if not available from MyPlate, nutrition labels from a major grocery website. Calorie-adjustment of price differences based on the USDA database. Summary estimates were generated using a random effects model in which the studies were weighted according to the inverse variance of the price difference. All estimates were adjusted for inflation and purchasing power parity—standardised to the international dollar, defined as US$1—by country to reflect the prices in 2011.
Figure 3
Figure 3
Price difference between healthier and less healthy food-based diet patterns per day (A) and per 2000 kcal (B). Price difference defined as the healthier category minus the less healthy category. Dollars/day was defined as dollars/three meals. One serving of any food was assumed to comprise one-fourth of a meal, except for condiments, fats and oils for which one serving was assumed to comprise one-eighth of a meal. Calorie-adjustment of price differences based on the United States Department of Agriculture (USDA) database. Information reported was not sufficient to perform calorie-adjustment for Mozaffarian et al. Energy density was included as a food-based pattern since this metric represents a set of foods more than it represents any single nutrient. For studies reporting price across quantiles of healthfulness, the most extreme quantile comparison was selected for meta-analysis. Number of participants reported for dietary surveys (studies comparing diets across samples of participants), and number of foods reported for market surveys (studies comparing samples of foods). Summary estimates were generated using a random effects model in which studies were weighted according to the inverse variance of the price difference. All estimates were adjusted for inflation and purchasing power parity—standardised to the international dollar, defined as one US$—by country to reflect prices in 2011.
Figure 3
Figure 3
Price difference between healthier and less healthy food-based diet patterns per day (A) and per 2000 kcal (B). Price difference defined as the healthier category minus the less healthy category. Dollars/day was defined as dollars/three meals. One serving of any food was assumed to comprise one-fourth of a meal, except for condiments, fats and oils for which one serving was assumed to comprise one-eighth of a meal. Calorie-adjustment of price differences based on the United States Department of Agriculture (USDA) database. Information reported was not sufficient to perform calorie-adjustment for Mozaffarian et al. Energy density was included as a food-based pattern since this metric represents a set of foods more than it represents any single nutrient. For studies reporting price across quantiles of healthfulness, the most extreme quantile comparison was selected for meta-analysis. Number of participants reported for dietary surveys (studies comparing diets across samples of participants), and number of foods reported for market surveys (studies comparing samples of foods). Summary estimates were generated using a random effects model in which studies were weighted according to the inverse variance of the price difference. All estimates were adjusted for inflation and purchasing power parity—standardised to the international dollar, defined as one US$—by country to reflect prices in 2011.
Figure 4
Figure 4
Price difference between healthier and less healthy nutrient-based diet patterns per day (A) and per 2000 kcal (B). One outlying, implausible estimate from Aggarwal et al (mean adequacy ratio) was excluded ($17.23; 95% CI $14.35 to $20.11). Price difference was defined as the healthier category minus the less healthy category. Dollars/day was defined as dollars/three meals. One serving of any food was assumed to comprise one-fourth of a meal, except for condiments, fats and oils for which one serving was assumed to comprise one-eighth of a meal. Calorie-adjustment of price differences based on the United States Department of Agriculture (USDA) database. Information reported was not sufficient to perform calorie-adjustment for Temple et al and Krukowski et al. For studies reporting price across quantiles of healthfulness, the most extreme quantile comparison was selected for meta-analysis. Number of participants reported for dietary surveys (studies comparing diets across samples of participants), and number of foods reported for market surveys (studies comparing samples of foods). Summary estimates were generated using a random effects model in which studies were weighted according to the inverse variance of the price difference. All estimates were adjusted for inflation and purchasing power parity—standardised to the international dollar, defined as US$1—by country to reflect prices in 2011.
Figure 4
Figure 4
Price difference between healthier and less healthy nutrient-based diet patterns per day (A) and per 2000 kcal (B). One outlying, implausible estimate from Aggarwal et al (mean adequacy ratio) was excluded ($17.23; 95% CI $14.35 to $20.11). Price difference was defined as the healthier category minus the less healthy category. Dollars/day was defined as dollars/three meals. One serving of any food was assumed to comprise one-fourth of a meal, except for condiments, fats and oils for which one serving was assumed to comprise one-eighth of a meal. Calorie-adjustment of price differences based on the United States Department of Agriculture (USDA) database. Information reported was not sufficient to perform calorie-adjustment for Temple et al and Krukowski et al. For studies reporting price across quantiles of healthfulness, the most extreme quantile comparison was selected for meta-analysis. Number of participants reported for dietary surveys (studies comparing diets across samples of participants), and number of foods reported for market surveys (studies comparing samples of foods). Summary estimates were generated using a random effects model in which studies were weighted according to the inverse variance of the price difference. All estimates were adjusted for inflation and purchasing power parity—standardised to the international dollar, defined as US$1—by country to reflect prices in 2011.

References

    1. Banks J, Marmot M, Oldfield Z, et al. Disease and disadvantage in the United States and in England. JAMA 2006;295:2037–45 - PubMed
    1. Kant AK, Graubard BI. Secular trends in the association of socio-economic position with self-reported dietary attributes and biomarkers in the US population: National Health and Nutrition Examination Survey (NHANES) 1971–1975 to NHANES 1999-2002. Public Health Nutr 2007;10:158–67 - PubMed
    1. Mackenbach JP, Stirbu I, Roskam AJ, et al. Socioeconomic inequalities in health in 22 European countries. N Engl J Med 2008;358:2468–81 - PubMed
    1. Darmon N, Drewnowski A. Does social class predict diet quality? Am J Clin Nutr 2008;87:1107–17 - PubMed
    1. Bittman M. Is junk food really cheaper? The New York Times 24 September 2011

LinkOut - more resources