Review
. 2013:207:435-56.
doi: 10.1016/B978-0-444-63327-9.00018-7.

Decoding speech for understanding and treating aphasia

Affiliations
Review

Decoding speech for understanding and treating aphasia

Brian N Pasley et al. Prog Brain Res. 2013.

Abstract

Aphasia is an acquired language disorder with a diverse set of symptoms that can affect virtually any linguistic modality across both the comprehension and production of spoken language. Partial recovery of language function after injury is common but typically incomplete. Rehabilitation strategies focus on behavioral training to induce plasticity in underlying neural circuits to maximize linguistic recovery. Understanding the different neural circuits underlying diverse language functions is a key to developing more effective treatment strategies. This chapter discusses a systems identification analytic approach to the study of linguistic neural representation. The focus of this framework is a quantitative, model-based characterization of speech and language neural representations that can be used to decode, or predict, speech representations from measured brain activity. Recent results of this approach are discussed in the context of applications to understanding the neural basis of aphasia symptoms and the potential to optimize plasticity during the rehabilitation process.

Keywords: aphasia; decoding; language; neural encoding; speech.


Figures

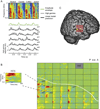
FIGURE 1
FIGURE 1
(A) Example of single-trial ECoG responses in superior temporal gyrus (STG) to four spoken words. Top panel, spectrogram of four spoken words presented to the subject. Bottom panel, amplitude envelope of the speech stimuli (green), high-gamma ECoG neural responses at four different electrodes (gray), and predicted response from the spectrogram model (black). The ECoG responses are taken from five representative electrodes in STG (shown in yellow in C). (B) Spectrogram model, represented as h(f, t), where h is the weight matrix as a function of frequency f and time t. This representation is equivalent to the standard linear spectrotemporal receptive field (STRF). Positive weights (red) indicate stimulus components correlated with increased high-gamma activity, negative weights (blue) indicate components correlated with decreased activity, and nonsignificant weights (green) indicate no relationship. STRFs for each site in the electrode grid are shown (white curve marks the sylvian fissure). Anatomical distribution of these sites is shown in (C). Yellow circles indicate electrodes that are shown in (A).
FIGURE 2
FIGURE 2
(A) Fitted spectrogram models for 2 STG sites. Right panels; pure-tone frequency tuning (black curves) matches frequency tuning derived from fitted frequency models (red curves). Pure tones (375–6000 Hz, logarithmically spaced) were presented for 100 ms at 80 dB. Pure-tone tuning curves were calculated as the amplitudes of the evoked high-gamma response across tone frequencies. Model-derived tuning curves were calculated by first setting all inhibitory weights to zero and then summing across the time dimension (David et al., 2007). At these two sites, frequency tuning is either high-pass (top) or low-pass (bottom). (Reproduced from Pasley et al., 2012.) (b) Distribution of sites with significant modulation model predictive accuracy in the temporal, parietal, and frontal cortex.
FIGURE 3
FIGURE 3
Top panel, spectrogram model. The neural response across time r(t) is modeled as a linear function h(f, t) of the spectrogram representation of sound S(f, t) where t is time, f is acoustic frequency, r is high-gamma neural activity, h is the weight matrix (STRF), and S is the acoustic spectrogram. For a single frequency channel, the instantaneous output may be high or low and does not directly indicate the modulation rate of the envelope. Bottom panel, modulation model. The neural response r(t) is modeled as a linear function h(s, r, f, t) of the modulation representation M(s, r, f, t), where s is spectral modulation (scale) and r is temporal modulation (rate). The modulation encoding model explicitly estimates the modulation rate by taking on a constant value for a constant rate (Adelson and Bergen, 1985; Chi et al., 2005).
FIGURE 4
FIGURE 4
(A) Example stimulus and response predictions from a representative electrode in the STG. High-gamma field potential responses (gray curve, bottom panel) evoked as the subject passively listened to a validation set of English sentences (spectrogram, top panel) not used in model fitting. Neural response predictions are shown for spectrogram (blue) and modulation models (red). The modulation model provides the highest prediction accuracy (r=0.44). (B) Example of fitted encoding models and response prediction procedure at an individual electrode site (same as in A). Top right panel; spectrogram model. Convolution of the STRF with the stimulus spectrogram generates a neural response prediction (bottom left panel, blue curve). Prediction accuracy is assessed by the correlation coefficient between the actual (bottom left panel, gray curve) and predicted responses. Bottom right panel; an example modulation energy model in the rate domain (for visualization, the parameters have been marginalized over frequency and scale axes). The energy model is convolved with the modulation energy stimulus representation (middle left panel) to generate a predicted neural response (bottom left panel, red curve). The energy and envelope models capture different aspects of the stimulus–response relationship and generate different response predictions. (C) Prediction accuracy of envelope versus modulation energy model across all predictive sites (n=199). The modulation energy model has higher prediction accuracy (p<0.005, paired t-test).
FIGURE 5
FIGURE 5
(A) Top, the spectrogram of four English words presented aurally to the subject. Middle, the energy-based reconstruction of the same speech segment, which is linearly decoded from a set of responsive electrodes. Bottom, the envelope-based reconstruction, linearly decoded from the same set of electrodes. (B) The contours delineate the regions of 80% spectral power in the original spectrogram (black), energy-based reconstruction (top, red), and envelope-based reconstruction (bottom, blue). (C) Mean reconstruction accuracy (correlation coefficient) for the joint spectrotemporal modulation space across all subjects (N=15). Energy-based decoding accuracy is significantly higher compared to envelope-based decoding for temporal rates >2 Hz and spectral scales >2 cyc/oct (p<0.05, paired t-tests). Envelope decoding accuracy is maintained (r~0.3, p<0.05) for lower rates (<4 Hz rate, <4 cyc/oct scale), suggesting the possibility of a dual energy and envelope coding scheme for slower temporal modulations. Shaded gray regions indicate SEM (Pasley et al., 2012).
FIGURE 6
FIGURE 6
The word and phonetic transcription of a sentence is shown. The vowel [ux] (TIMIT phonetic alphabet) occurs twice during the sentence. The spectrogram for the two instances differs as shown. The spectrogram encoding model assumes neural responses are sensitive to acoustic variation across phone instances. A phonetic model assumes neural responses are invariant to acoustic variability across phone instances.
FIGURE 7
FIGURE 7
Vowel-sensitive cortical sites and multisyllable responsivity. (A) The average high-gamma response difference (vowels, V, minus consonants, C) across all single syllable sites (n=5). Gray curves denote SEM over C/V occurrences. (B) The fitted energy models are used to filter a large set of English sentences and the average predicted response difference for consonants versus vowels is compared to the measured high-gamma response difference between the two classes. Across electrodes, the measured high-gamma CV response difference is highly correlated with that predicted from the energy model (r=0.77, p<10−7). (C) The average high-gamma response difference (VCV–CCV) across all multisyllable sites (n=8). Time from phoneme onset is time-locked to the final vowel in the CCV or VCV sequence. (D) Left panel; example modulation model in the rate domain at a vowel-sensitive site. Right panel; average high-gamma response to consonants (C, blue curve) and vowels (V, red curve) embedded in English sentences. The high-gamma time series was first normalized by converting to z-scores. Gray curves denote SEM over CV occurrences.
FIGURE 8
FIGURE 8
Distribution of categorical responses to syllable perception in STG (Chang et al., 2010). Color indicates STG sites that discriminate specific pairs of syllables. Red: discriminates ba versus da; green: da versus ga; blue: ba versus ga. Mixed colors: electrode discriminates more than one pair. Phoneme decoding depends on distributed, interwoven networks with little overlap.
FIGURE 9
FIGURE 9
Articulatory-based encoding model. (A) Upper panel, a hypothesized mapping of articulators to motor cortex. Muscles corresponding to various articulators in the vocal tract likely have anatomical representations in the motor homunculus. A “gestural score” (Browman and Goldstein, 1989) describes the temporal sequence of articulator activity during an utterance. The physical movement illustrated by the gestural score might then be “readout” via neural activity in the motor cortex. (B) Anatomical sites of three articulators in the motor map for a representative patient. Sites are determined both by electrical stimulation mapping performed during presurgical evaluation and by the presence of ECoG activity during movement of individual articulators. (C) Left panel, high-gamma ECoG activity during the articulation of three CV monosyllables. Right panel, linear estimates of the articulator movement response (e.g., “gestural score”) for the same three consonants. The linear articulator response was derived from electromagnetic articulography measurements provided by the MOCHA speech corpus. Neural and articulator responses are qualitatively similar, indicating that motor map neural activity can be used to distinguish individual phonemes on the basis of articulatory patterns.

Similar articles

Cited by

References

    1. Adelson EH, Bergen JR. Spatiotemporal energy models for the perception of motion. J. Opt. Soc. Am. A. 1985;2:284–299. - PubMed
    1. Aertsen AM, Johannesma PI. The spectro-temporal receptive field. A functional characteristic of auditory neurons. Biol. Cybern. 1981;42:133–143. - PubMed
    1. Bialek W, Rieke F, De Ruyter Van Steveninck RR, Warland D. Reading a neural code. Science. 1991;252:1854–1857. - PubMed
    1. Bouchard KE, Mesgarani N, Johnson K, Chang EF. Functional organization of human sensorimotor cortex for speech articulation. Nature. 2013;495(7441):327–332. http://dx.doi.org/10.1038/nature11911. Epub 2013 Feb 20. - DOI - PMC - PubMed
    1. Breiman L. Statistical Modeling: The Two Cultures. Stat. Sci. 2001;16:199–231.