Review
. 2014 May;232(5):1509-22.
doi: 10.1007/s00221-013-3794-8. Epub 2013 Dec 6.

Gamma band activity in the RAS-intracellular mechanisms

Affiliations
Review

Gamma band activity in the RAS-intracellular mechanisms

E Garcia-Rill et al. Exp Brain Res. 2014 May.

Erratum in

  • Exp Brain Res. 2014 May;232(5):1523

Abstract

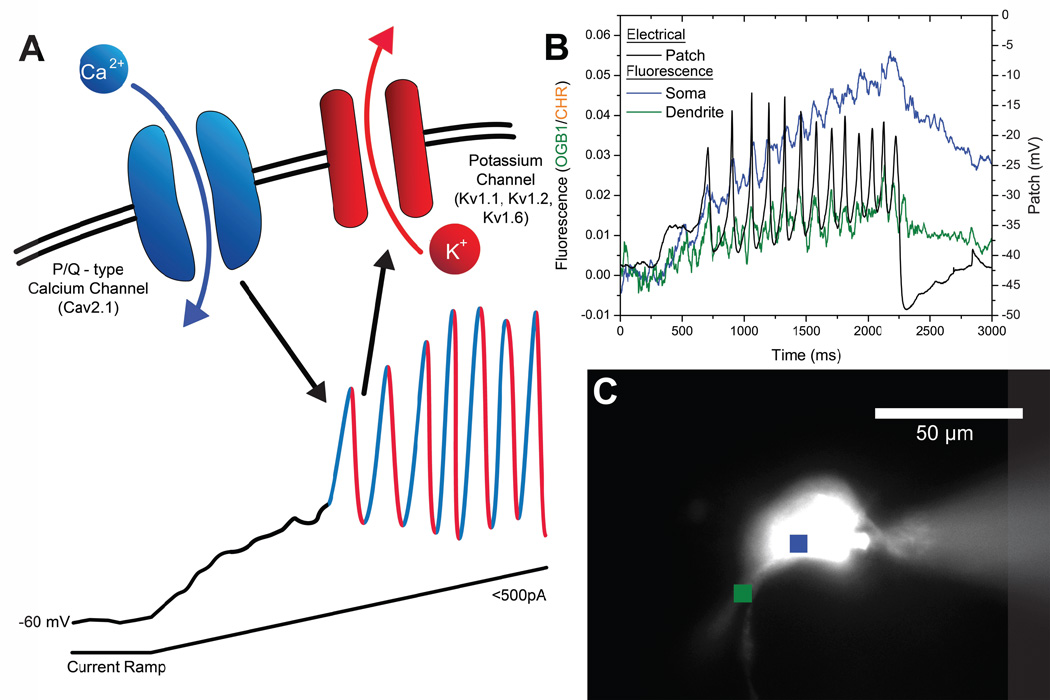
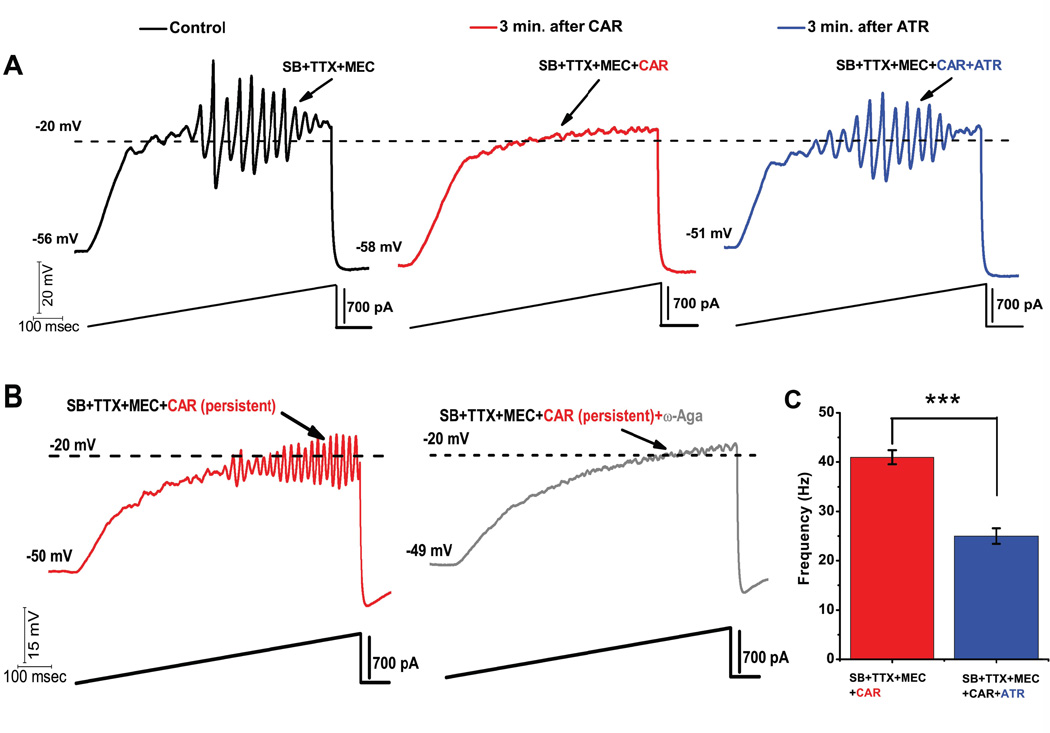
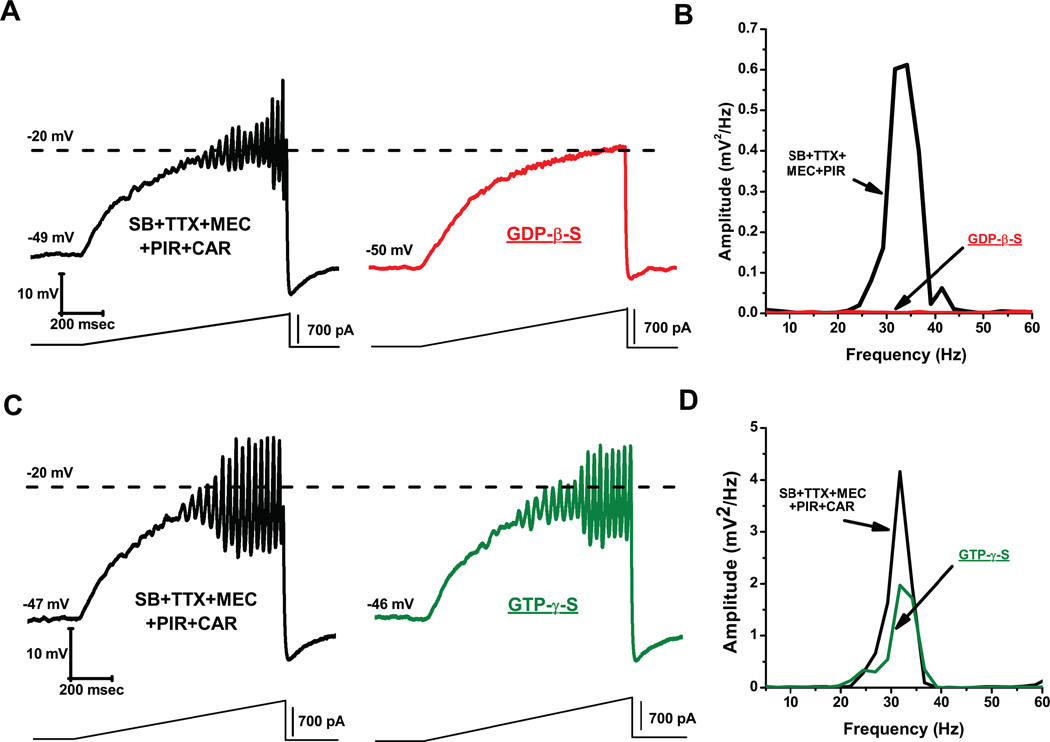
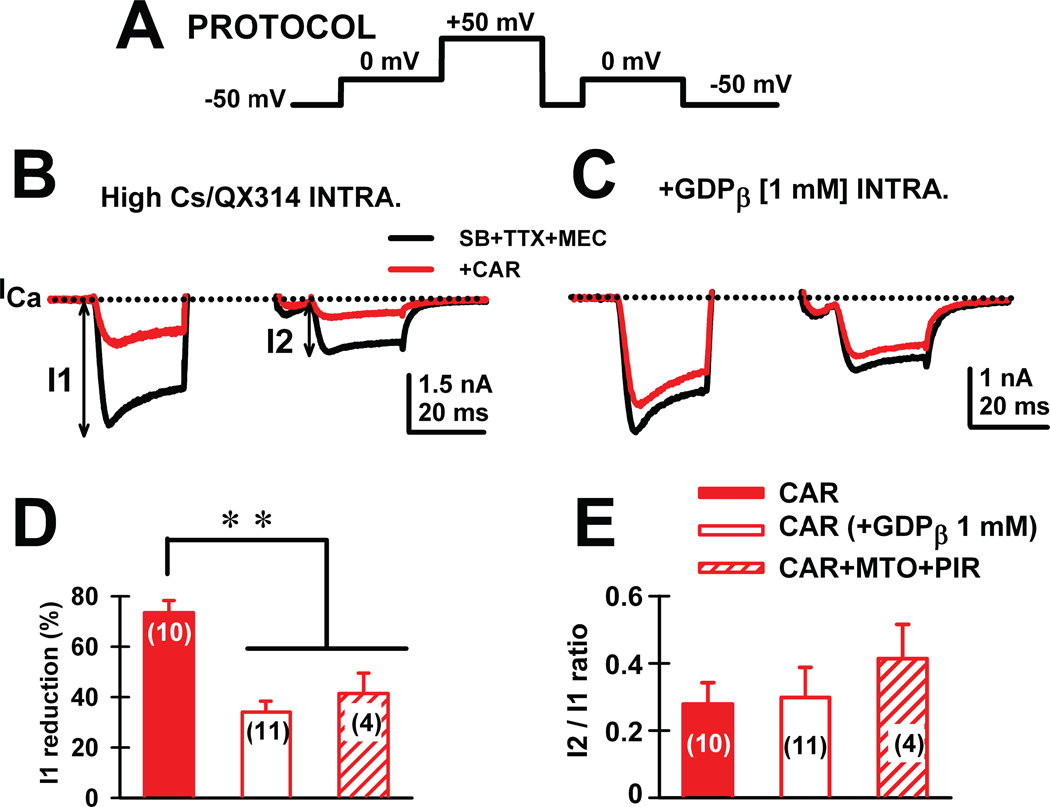
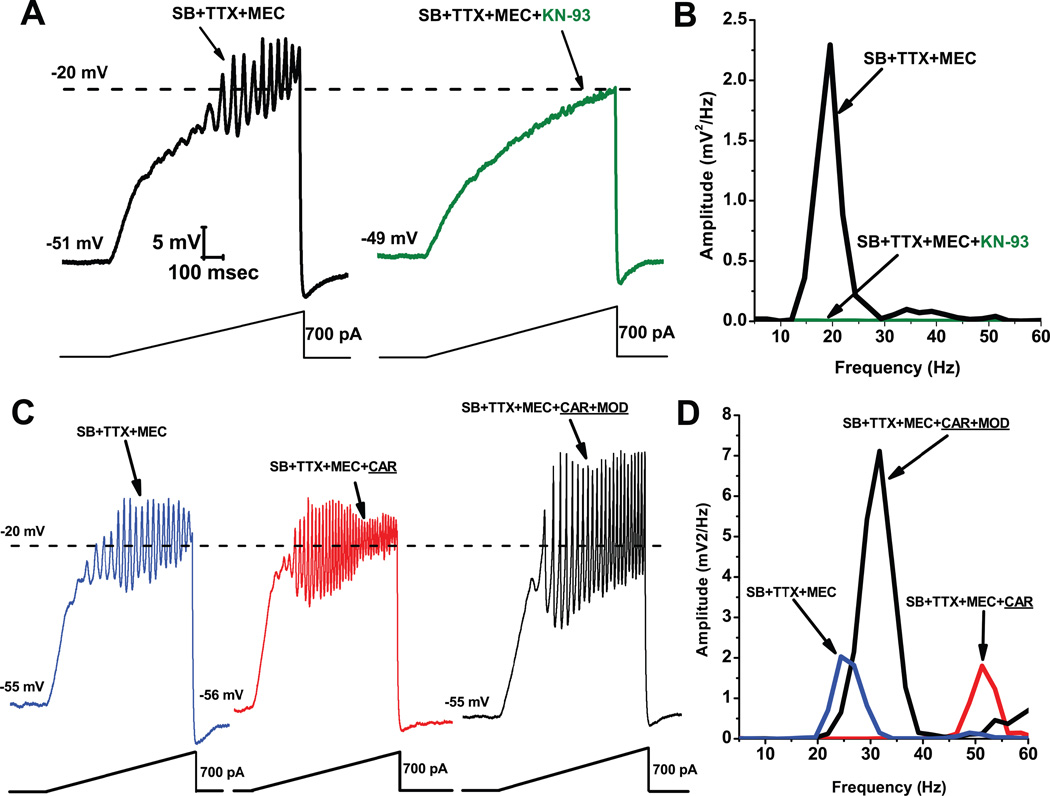
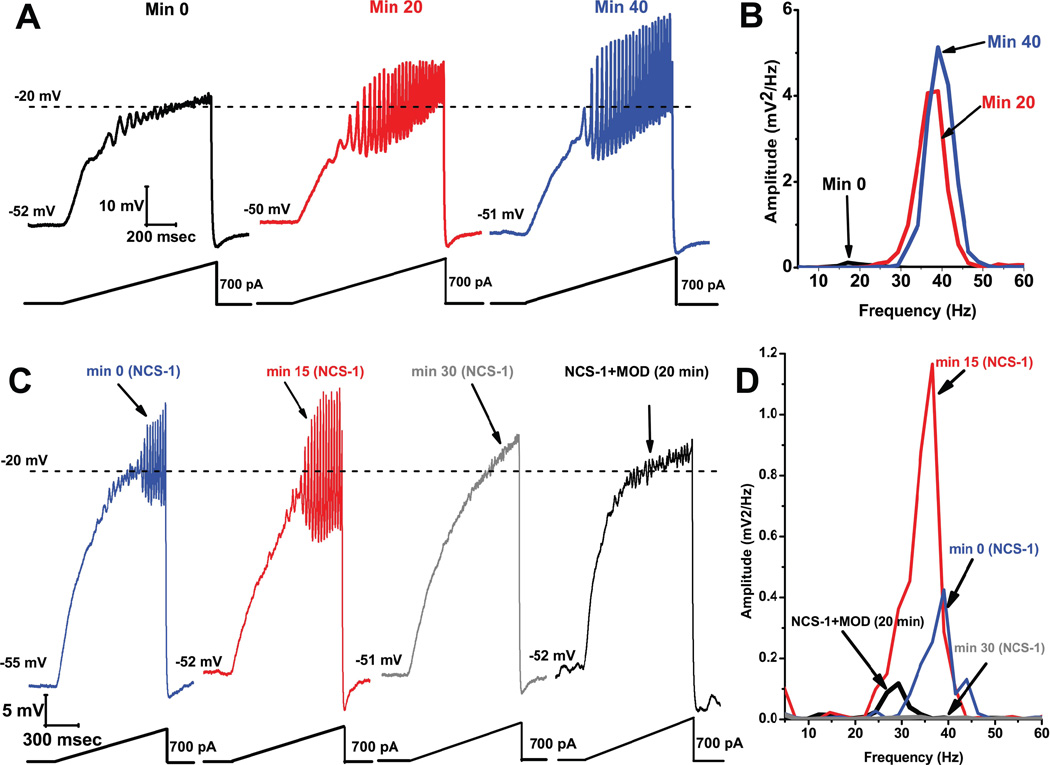
Gamma band activity participates in sensory perception, problem solving, and memory. This review considers recent evidence showing that cells in the reticular activating system (RAS) exhibit gamma band activity, and describes the intrinsic membrane properties behind such manifestation. Specifically, we discuss how cells in the mesopontine pedunculopontine nucleus, intralaminar parafascicular nucleus, and pontine SubCoeruleus nucleus dorsalis all fire in the gamma band range when maximally activated, but no higher. The mechanisms involve high-threshold, voltage-dependent P/Q-type calcium channels, or sodium-dependent subthreshold oscillations. Rather than participating in the temporal binding of sensory events as in the cortex, gamma band activity in the RAS may participate in the processes of preconscious awareness and provide the essential stream of information for the formulation of many of our actions. We address three necessary next steps resulting from these discoveries: an intracellular mechanism responsible for maintaining gamma band activity based on persistent G-protein activation, separate intracellular pathways that differentiate between gamma band activity during waking versus during REM sleep, and an intracellular mechanism responsible for the dysregulation in gamma band activity in schizophrenia. These findings open several promising research avenues that have not been thoroughly explored. What are the effects of sleep or REM sleep deprivation on these RAS mechanisms? Are these mechanisms involved in memory processing during waking and/or during REM sleep? Does gamma band processing differ during waking versus REM sleep after sleep or REM sleep deprivation?


Figures

Figure 1
Figure 1. Model of high threshold, voltage-dependent P/Q-type calcium channel oscillations, and visualization of calcium transients in the dendrite of a PPN neuron
A) Application of a ramp stimulus in the presence of synaptic blockers and TTX slowly depolarizes the membrane, avoiding activation of potassium channels. Once the voltage-dependent high threshold of calcium channels is reached, ~ −30 mV, membrane oscillations are observed. Addition of the specific P/Q-type calcium channel blocker ω-agatoxin-IVA will eliminate the oscillations, demonstrating that the depolarizing phase is due to P/Q-type calcium channels (Cav2.1). Addition of the delayed rectifier-like potassium channel blocker dendrotoxin also blocks the oscillations, demonstrating that the repolarizing phase is due to these potassium channels (Kv1.1, Kv1.2, Kv1.6) (Kezunovic et al. 2012). B) Electrophysiological recording of a PPN cell during ramp-induced membrane oscillations (black record), while region of interest calcium transients were imaged from the cell body (blue record) and one of the dendrites (green record). The peaks of the calcium oscillations coincided with the peaks in the electrical recording, and different dendrites (not shown) manifested calcium transients coinciding with different of the peaks of the soma recording (Hyde et al 2013b). C) Locations of the regions of interest shown in B in a photomicrograph of a PPN cell injected with fluorescent dye, with the microelectrode evident on the right.
Figure 2
Figure 2. Acute vs persistent effect of CAR on the oscillatory behavior of PPN neurons
A) Representative 1 sec long current ramp-induced oscillations of a PPN neuron in SB+TTX+MEC extracellular solution (left record, black). After 3 min of CAR in the extracellular solution, the oscillatory activity diminished (middle record, red). However, the acute effect of CAR on oscillations was reversed by adding ATR to the solution (after 3 min of perfusion with a solution containing CAR+ATR) (right record, blue). This established that cholinergic muscarinic receptors were responsible for the effect. B) Representative 1 sec long current ramp recording of a PPN neuron in the presence of SB+TTX+MEC+CAR (red record, top), recorded after persistent exposure to CAR (>20 min of exposure). Beside is the record of the same neuron showing that oscillations were blocked after adding ω-Aga (200 nM) to the extracellular solution (grey record, middle). These recordings confirm that P/Q-type calcium channel-mediated oscillatory activity in PPN neurons was induced by persistent activation by CAR. C) Bar graph showing the mean frequency of oscillatory activity in the presence of SB+TTX, the nicotinic receptor blocker MEC, persistent exposure to CAR (red column), and in the presence of SB+TTX+CAR and nonspecific cholinergic antagonist ATR (blue column). Note that the mean oscillatory frequency of PPN neurons was significantly higher during persistent exposure to CAR compared to the condition with ATR in the extracellular solution. This suggests that CAR increased the frequency of oscillations in PPN cells.
Figure 3
Figure 3. Blockade and stimulation of G-proteins. GDP-β-S blocks oscillatory activity in PPN neurons
A) Representative membrane potential oscillation recorded during 1 sec ramp immediately after rupturing the membrane, in the presence of SB+TTX+MEC+PIR (left record, black). Note the blocking effect of GDP-β-S in the pipette (1 mM) on the oscillations in the same neuron after 10 min (right record, gray). B) Power spectrum of the records in A showing elimination of gamma band oscillations by GDP-β-S. GTP-γ-S does not amplify oscillatory activity in PPN cells. C) Representative membrane oscillations in the presence of SB+TTX+MEC+PIR+CAR following rupturing the membrane (left record, black). Note that activation of G-proteins by GTP-γ-S did not decrease or further increase the frequency of oscillations (right record, gray). D) Power spectrum of the records in C showing that high frequency oscillation frequency remained similar before (black line) vs after (gray line) GTP-γ-S.
Figure 4
Figure 4. Persistent voltage-independent G-protein modulation of voltage-gated calcium currents in PPN
A) Three-pulse protocol was used to study the voltage dependence of G-protein modulation of calcium currents (ICa) in PPN neurons. B) In the presence of synaptic receptor blockers (SB: gabazine-GBZ+strychnine-STR+ NMDA blocker-AP5+AMPA/KA blocker-CNQX), TTX and Mecamylamine-MEC (nicotinic receptor antagonist), calcium currents (ICa; black record) were reduced in amplitude when the three-pulse protocol was applied. Indeed, the ICa observed after the second 0 mV pulse (I2) was always of lower amplitude than the one observed after the first pulse (I1), yielding a I2/I1 <1 in all neurons recorded. CAR (30 M) reduced the total amount of current during both pulses without affecting calcium current amplitude I2/I1 ratios (red record). C) The effects of CAR were prevented after adding GDP-β-S to the intracellular solution (1 mM). D) The effect of CAR (red bar) was significantly reduced when either intracellular GDP-β-S (blank bar) or extracellular muscarinic receptor antagonists (M2 antagonist methoctramine-MTO+ M1 antagonist pirenzepine-PIR) (hatched bar) were used. E) Calcium current I2/I1 ratio values (%) were unchanged by CAR under any of the experimental conditions. These results suggest that CAR reduces calcium currents through activation of muscarinic receptors that activate G-proteins.
Figure 5
Figure 5. Effects of the CaMKII blocker KN-93
A. Ramps induced oscillations in the beta range (black record). Following slice superfusion with KN-93 (10 M) for 10 min, ramps no longer elicited oscillations (green record). B. Power spectrum showing amplitude and frequency of ramp-induced oscillations before (black record, beta range) and after KN-93 (green record, no oscillations). Effects of MOD on CAR-induced oscillations. A. Recordings of a PPN neuron before administration of CAR (30 M) (blue record), 20 min after continuous superfusion with CAR (red record), and 20 min after continuous superfusion with MOD and CAR (black record). B. Power spectrum before CAR (blue line, beta range), after CAR (red line, gamma range), and after CAR+MOD (black line, beat/gamma range).
Figure 6
Figure 6. Effects of NCS-1 at 1 µM in the recording pipette on oscillations induced at −30 mV to −10 mV by a ramp (bottom record) applied to a PPN cell held at −50 mV
A) Oscillations were of low amplitude and frequency at the start (before NCS-1 diffused into the cell) but increased and were maintained after 20 min (red record) and 40 min (blue record). B. The power spectrum of the recordings in A showed that oscillations increased in amplitude and frequency for prolonged periods. Effects of NCS-1 at 10 µ in the recording pipette on ramp-induced oscillations in a PPN cell. C) Soon after patching oscillations were in the gamma range (blue record), and remained for 15 min (red record), but were eliminated after 30 min (gray record), and returned 20 min after adding MOD (black record). D) Power spectrum showing that NCS-1 at 10 mM had an immediate effect on oscillation amplitude and frequency (blue line), which persisted for 15 min (red line), but was then blocked by 30 min of exposure to high levels of NCS-1 (gray line), an effect partially reversed by MOD (black line).

References

    1. Aserinsky E, Kleitman N. Regularly occurring periods of eye motility, and concomitant phenomena, during sleep. Science. 1953;118:273–274. - PubMed
    1. Baghdoyan HA, Rodrigo-Angulo ML, McCarley RW, Hobson JA. A neuroanatomical gradient in the pontine tegmentum for the cholinoceptive induction of desynchronized sleep signs. Brain Res. 1987;414:245–261. - PubMed
    1. Beck P, Odle A, Wallace-Huitt T, Skinner RD, Garcia-Rill E. Modafinil increases arousal determined by P13 potential amplitude; An effect blocked by gap junction antagonists. Sleep. 2008;31:1647–1654. - PMC - PubMed
    1. Berger M, Riemann D. Symposium: Normal and abnormal REM sleep regulation: REM sleep in depression- an overview. J Sleep Res. 1993;2:211–223. - PubMed
    1. Bergson C, Levenson R, Goldman-Rakic P, Lidow MS. Dopamine receptor-interacting proteins: the Ca2+ connection in dopamine signaling. Trends Pharmacol Sci. 2003;24:486–492. - PubMed

Publication types

Substances

LinkOut - more resources