. 2014 Feb 1;74(3):738-750.
doi: 10.1158/0008-5472.CAN-13-2650. Epub 2013 Dec 5.

Extracellular vesicles modulate the glioblastoma microenvironment via a tumor suppression signaling network directed by miR-1

Affiliations

Extracellular vesicles modulate the glioblastoma microenvironment via a tumor suppression signaling network directed by miR-1

Agnieszka Bronisz et al. Cancer Res. .

Abstract

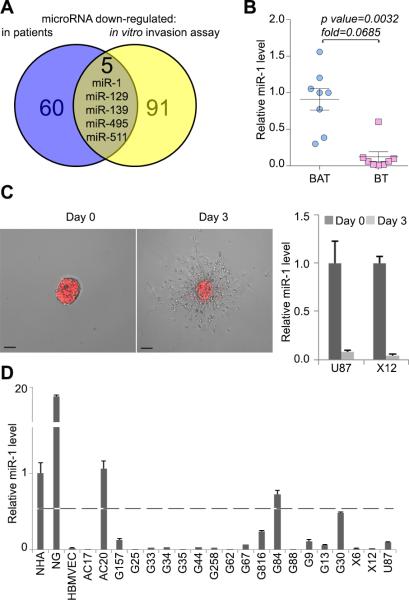
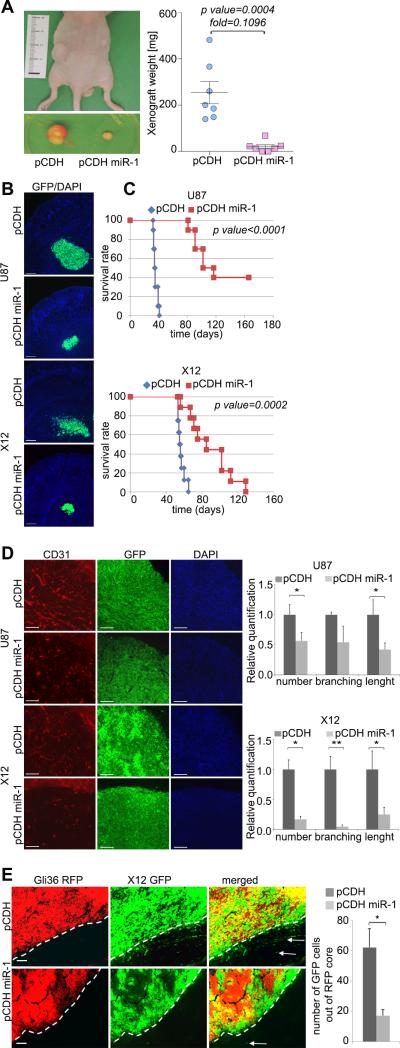
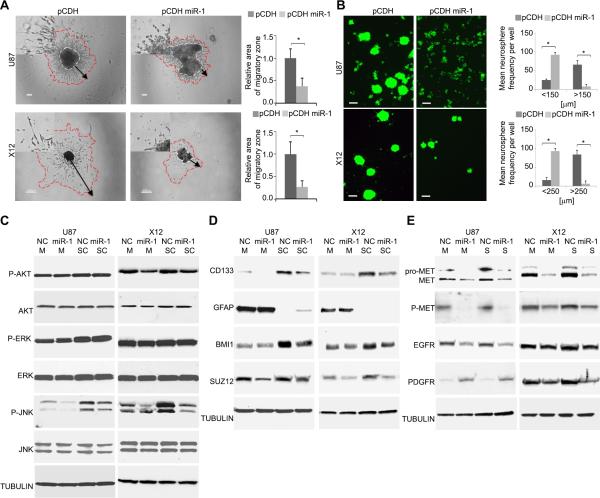
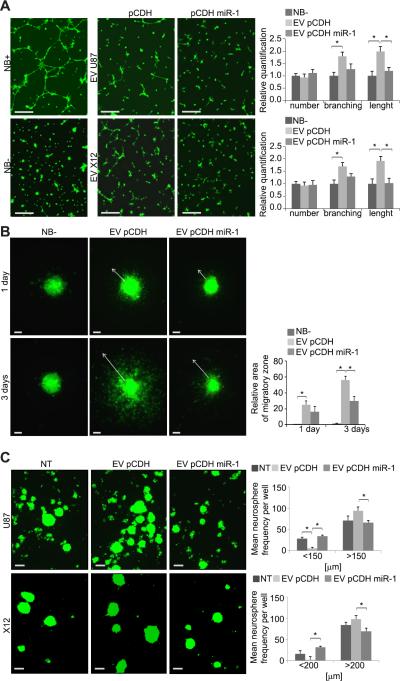
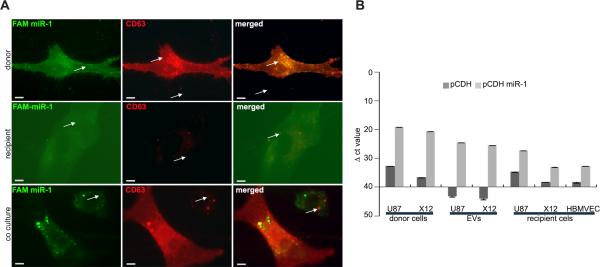
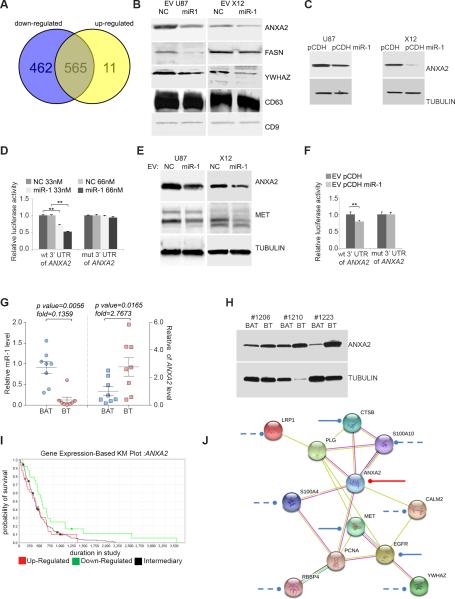
Extracellular vesicles have emerged as important mediators of intercellular communication in cancer, including by conveying tumor-promoting microRNAs between cells, but their regulation is poorly understood. In this study, we report the findings of a comparative microRNA profiling and functional analysis in human glioblastoma that identifies miR-1 as an orchestrator of extracellular vesicle function and glioblastoma growth and invasion. Ectopic expression of miR-1 in glioblastoma cells blocked in vivo growth, neovascularization, and invasiveness. These effects were associated with a role for miR-1 in intercellular communication in the microenvironment mediated by extracellular vesicles released by cancer stem-like glioblastoma cells. An extracellular vesicle-dependent phenotype defined by glioblastoma invasion, neurosphere growth, and endothelial tube formation was mitigated by loading miR-1 into glioblastoma-derived extracellular vesicles. Protein cargo in extracellular vesicles was characterized to learn how miR-1 directed extracellular vesicle function. The mRNA encoding Annexin A2 (ANXA2), one of the most abundant proteins in glioblastoma-derived extracellular vesicles, was found to be a direct target of miR-1 control. In addition, extracellular vesicle-derived miR-1 along with other ANXA2 extracellular vesicle networking partners targeted multiple pro-oncogenic signals in cells within the glioblastoma microenvironment. Together, our results showed how extracellular vesicle signaling promotes the malignant character of glioblastoma and how ectopic expression of miR-1 can mitigate this character, with possible implications for how to develop a unique miRNA-based therapy for glioblastoma management.


Figures

FIGURE 1
FIGURE 1. MiR-1 is downregulated in patient GBM specimens and in GBM cells during migration in vitro
A. Venn diagram depicting the overlap between miRs identified as downregulated in GBM specimens compared to matching (i.e. from the same individual) adjacent brain (blue) and miRs identified as downregulated in GBM cells in time course of a migration assay (yellow). B. Relative expression of miR-1 was validated by qPCR in GBM brain tumor (BT) specimens versus matching brain adjacent to tumor (BAT) (n = 8). Values are expressed as mean relative miR-1 expression level ± SD. C. Representative images of RFP-X12 GBM cells in the migration assay at day 0 and day 3 are shown. RNA was extracted from multiple spheroids for subsequent analysis. Scale bars: 200μm. Relative expression of miR-1 was validated by qPCR in U87 and X12 GBM cell lines at day 0 and day 3 of migration in the spheroid assay. Values are expressed as mean relative miR-1 expression level ± SD. D. Relative expression of miR-1 was validated by qPCR in: normal human astrocytes (NHA), neuroglia (NG), human brain microvasculature endothelial cells (HBMVEC) and collection of GBM primary stem cells and established cell line U87. Values are expressed as mean relative miR-1 expression level ± SD. Dashed line shows 50% of expression measured in astrocytes.
FIGURE 2
FIGURE 2. Overexpression of miR-1 in GBM cells mitigates tumorigenicity, reduces invasiveness and angiogenesis in vivo
A. Representative images of tumor xenografts before and after excision from mice injected with U87 cells stably expressing pCDH-GFP control vector (pCDH) or pCDH-GFP miR-1 vector (pCDH miR-1). Tumor mass was quantified (n = 7), and the data are expressed as mean ± SD. B. Representative images of intracranial tumors formed by U87 (2 weeks after injection) and X12 (3 weeks after injection) GBM cells stably expressing pCDH-GFP control vector (pCDH) or pCDH-GFP miR-1 vector (pCDH miR-1). Scale bars: 250μm. C. Kaplan–Meier survival curve of animals injected with GBM tumor cells U87 (upper) and X12 (lower). Cells were stably expressing pCDH-GFP control vector (pCDH) (U87: n = 10; X12: n= 8) or pCDH-GFP miR-1 vector (pCDH miR-1) (U87: n = 10; X12: n= 9). Log-rank test was used to compare the survival probabilities between the two groups. D. Angiogenesis was determined by CD31 (red) and DAPI (blue) staining of intracranial tumors formed by U87 (5 weeks after injection) and X12 (7 weeks after injection) GBM cells stably expressing pCDH GFP control vector (pCDH) or pCDH-GFP miR-1 vector (pCDH miR-1). Scale bars: 150μm. Data are expressed as mean ±SD, *P < 0.05, **P < 0.01. E. Invasiveness in vivo was determined by co-injection of non-invasive RFP-Gli36 cells with invasive GFP-X12 cells stably expressing either pCDH-GFP control vector (pCDH) or pCDH-GFP miR-1 vector (pCDH miR-1). Scale bars: 100μm. Data are expressed as mean ±SD, *P < 0.05.
FIGURE 3
FIGURE 3. Overexpression of miR-1 in GBM cells impairs cell-cell adhesion, spheroid migration and neurosphere formation by affecting multiple effectors
A. Migration of GBM cells was measured by a spheroid dispersal assay. Representative images of spheroid migration of U87 (upper panels) and X12 (lower panels) GBM cells transiently transfected with either negative control miR (NC) or miR-1. Scale bars: 100μm (upper panels) and 200μm (lower panels). The insets in all panels are magnified × 2.5. Migratory zones were quantified after indicated time, expressed as mean ± SD. *P < 0.05. B. Neurosphere formation capacity was determined by a self-renewal assay. Representative images of U87 and X12 cells stably expressing pCDH-GFP control vector (pCDH) or pCDH-GFP miR-1 vector (pCDH miR-1). Scale bars: 200μm. Neurosphere frequency were quantified after 72h, expressed as mean ± SD. *P < 0.05. C. Cellular signaling was monitored by Western blot analysis of U87 and X12 cell lines cultured as monolayer (M) or stem cell-like neurospheres (SC). Cells were transiently transfected with either negative control miR (NC) or miR-1. Cell lysates were blotted with anti-phospho-specific antibodies, and compared with total kinase antibodies. Tubulin was used as a loading control. D. Stemness was monitored by Western blot analysis of U87 and X12 cell lines cultured as monolayer (M) or stem cell-like neurospheres (SC). Cells were transiently transfected with either negative control miR (NC) or miR-1. Cell lysates were blotted with indicated antibodies. Tubulin was used as a loading control. E. Expression of cellular receptors was monitored by Western blot analysis of U87 and X12 cell lines cultured as monolayer (M) or stem cell-like neurospheres (SC). Cells were transiently transfected with either negative control miR (NC) or miR-1. Cell lysates were blotted with anti-phospho-specific antibodies and with total protein antibodies. Tubulin was used as a loading control.
FIGURE 4
FIGURE 4. The EV-dependent phenotype is mitigated by miR-1
A. Tube-like formation of HBMVEC in unsupplemented (NB-) and supplemented (NB+) Neurobasal medium and upon the presence of EVs was monitored by 3-D Matrigel assay. EVs were collected from U87 (EV U87) and X12 (EV X12) cells stably infected with either pCDH-GFP control vector (pCDH) or pCDH-GFP miR-1 expressing vector (pCDH miR-1). Representative images are shown. Scale bars: 250μm. Data are expressed as mean ±SD, *P < 0.05. B. Migration of GBM stem-like neurospheres upon the presence of NB- medium neurospheres upon the presence of EVs was measured by spheroid dispersal assay. Representative images of non-transfected X12 spheroid migration after indicated time are shown. EVs were collected from X12 cells stably expressing pCDH-GFP control vector (EV pCDH) or pCDH-GFP miR-1 vector (EV pCDH miR-1). Scale bars: 100μm. Migratory zones were quantified after indicated time, expressed as mean ± SD. *P < 0.05. C. Neurosphere formation capacity in the presence of EVs was determined by self-renewal assay. Representative images of GFP-labeled U87 and X12 cells either non-treated (NT) or cultured in the presence of EVs are shown. EVs were collected from corresponding cell lines stably expressing pCDH-GFP control vector (EV pCDH) or pCDH-GFP miR-1 vector (EV pCDH miR-1). Scale bars: 200μm. Neurosphere frequency were quantified after 72h, expressed as mean ± SD. *P < 0.05.
FIGURE 5
FIGURE 5. MiR-1 is transferred between GBM cells by EV transport
A. Uptake of GBM-derived EVs was monitored using co-labeled EVs and miR. Donor U87 cells were stably infected with lentiviral particles of RFP-CD63 and transiently transfected with FAM labeled miR-1. Representative images show partial co-localization of miR-1 (green) and EVs (red) in donor cells (upper panels) in recipient U87 cells treated with EVs from donor cells (middle panels) and in donor and recipient cells in co-culture (lower panels). Scale bars, 50 μm. Arrows indicate FAM signal alone (left panels), RFP signal alone (middle panels) and both signals co-localized (right panels). B. Expression of miR-1 in donor cells, EVs and recipient cells was validated by qPCR. RNA was isolated from: donor cells (U87, X12) stably infected with either pCDH-GFP control vector (pCDH) or pCDH-GFP miR-1 expressing vector (pCDH miR-1), EVs collected from donor cells, and recipient U87, X12 and HBMVEC cells upon the treatment with EVs. Data is shown as the mean raw ΔCt value ± SD.
FIGURE 6
FIGURE 6. MiR-1 directly targets EV ANXA2 overexpressed in human GBM
A. Venn diagram depicting differential protein composition of EV's derived from U87 cells stably infected with pCDH-GFP miR-1 expressing vector (downregulated: blue, upregulated: yellow) compared to EVs derived from U87 cells stably infected with pCDH-GFP control vector. B. EV proteins were validated by Western blotting analysis. EVs were derived from U87 and X12 cells lines stably infected with either pCDH-GFP control vector (pCDH) or pCDH-GFP miR-1 expressing vector (pCDH miR-1). EV lysates were blotted with specific antibodies against indicated proteins. CD9 and CD63 were used as a loading control. C. Effects of miR-1 on the expression of ANXA2 were validated by Western blotting analysis. U87 and X12 GBM cell lines were stably expressing pCDH-GFP control vector (pCDH) or pCDH-GFP miR-1 expressing vector (pCDH miR-1). Cell lysates were blotted with antibodies against ANXA2. Tubulin was used as a loading control. D. Direct targeting of ANXA2 3′UTR by miR-1 was validated using a luciferase/3’UTR reporter assay. COS7 cells were co-transfected with luciferase/ANXA2 wild type 3′UTR reporter vector (wt) and33 nM or 66 nM negative control miR (NC) or miR-1. A reporter vector with a mutated miR-1 binding site in the ANXA2 3′UTR (mut) was used as a control. Luciferase levels are expressed as mean relative to controls ± SD; **P < 0.01. E. Effects of EV-carried miR-1 on the expression of ANXA2 and MET were validated by Western blotting analysis. U87 and X12 cells were exposed to the presence of EVs derived from corresponding cells transiently transfected with either negative control miR (NC) or miR-1 oligonucleotides. Cell lysates were blotted with antibodies against ANXA2, MET and tubulin as a loading control. F. Direct targeting of ANXA2 3′UTR by EV-carried miR-1 was validated using luciferase/3’UTR reporter assay. U87 and X12 cells were exposed to the presence of EVs derived from corresponding cells transiently transfected with either negative control miR (NC) or miR-1 and after 24h transfected with luciferase/ANXA2 3′UTR wild type (wt) and mutant (mut) reporter vector. Luciferase levels are expressed as mean relative to controls ± SD; **P < 0.01. G. Relative expression of miR-1 (left) and ANXA2 mRNA (right) levels were validated by qPCR in GBM brain tumor (BT) specimens vs. matching brain adjacent to tumor (BAT) (n = 8). Values are expressed as mean relative miR-1 expression level ± SD. H. ANXA2 protein level was validated in GBM by Western blotting analysis. Cell lysates from GBM brain tumor (BT) specimens vs. matching brain adjacent to tumor (BAT) (n = 3) were blotted with antibodies against ANXA2. Tubulin was used as a loading control. I. Association of ANXA2 expression with patient survival (Kaplan–Meier [KM] plot) in GBM. Data was obtained from The Cancer Genome Atlas. Upregulated (n = 31), downregulated (n = 24), and intermediary samples (n = 156) were analyzed. Up- vs. downregulated P = 0.05; up-regulated vs. intermediary P = 0.7134; down-regulated vs. intermediary P = 0.0147. J. MiR-1 dependent targeting of EV ANXA2 network. ANXA2 partners were selected from EV proteins carried differentially in miR-1-dependent manner. Experimentally validated miR-1 targeting of ANXA2 is shown as a red line; targeting based on published data are shown as a solid blue lines, putative targeting based on target prediction software only are shown as a dashed lines. Networking was analyzed with STRING software.

References

    1. Hess KR, Broglio KR, Bondy ML. Adult glioma incidence trends in the United States, 1977-2000. Cancer. 2004;101:2293–9. - PubMed
    1. Stupp R, Mason WP, van den Bent MJ, Weller M, Fisher B, Taphoorn MJ, et al. Radiotherapy plus concomitant and adjuvant temozolomide for glioblastoma. N Engl J Med. 2005;352:987–96. - PubMed
    1. Furnari FB, Fenton T, Bachoo RM, Mukasa A, Stommel JM, Stegh A, et al. Malignant astrocytic glioma: genetics, biology, and paths to treatment. Genes Dev. 2007;21:2683–710. - PubMed
    1. Lefranc F, Brotchi J, Kiss R. Possible future issues in the treatment of glioblastomas: special emphasis on cell migration and the resistance of migrating glioblastoma cells to apoptosis. J Clin Oncol. 2005;23:2411–22. - PubMed
    1. Lathia JD, Heddleston JM, Venere M, Rich JN. Deadly teamwork: neural cancer stem cells and the tumor microenvironment. Cell stem cell. 2011;8:482–5. - PMC - PubMed

Publication types

MeSH terms