. 2011 Jan 4;3(1):12-33.
doi: 10.3390/pharmaceutics3010012.

The pharmacokinetics and pharmacodynamics of iron preparations

Affiliations

The pharmacokinetics and pharmacodynamics of iron preparations

Peter Geisser et al. Pharmaceutics. .

Abstract

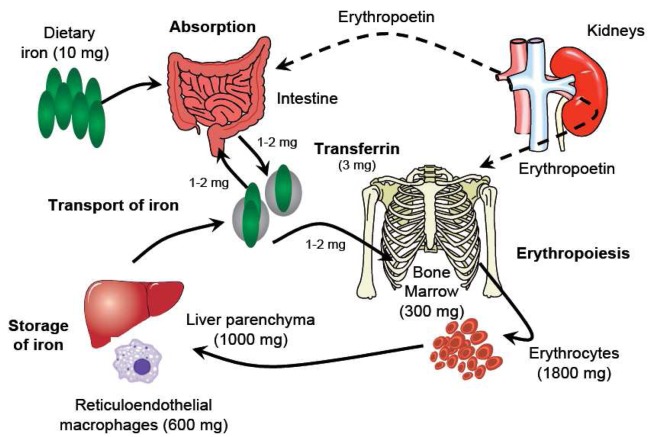
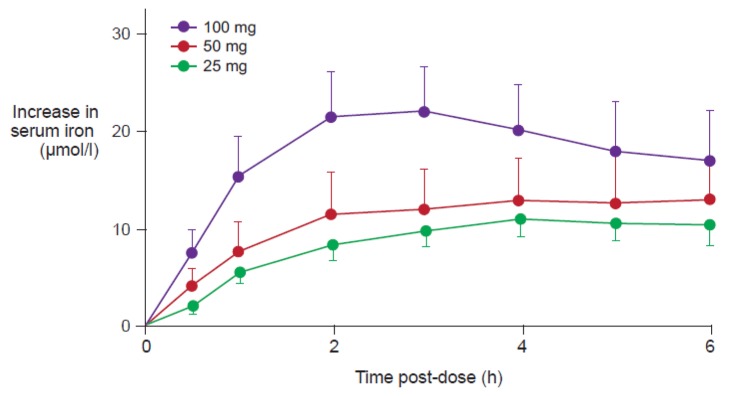
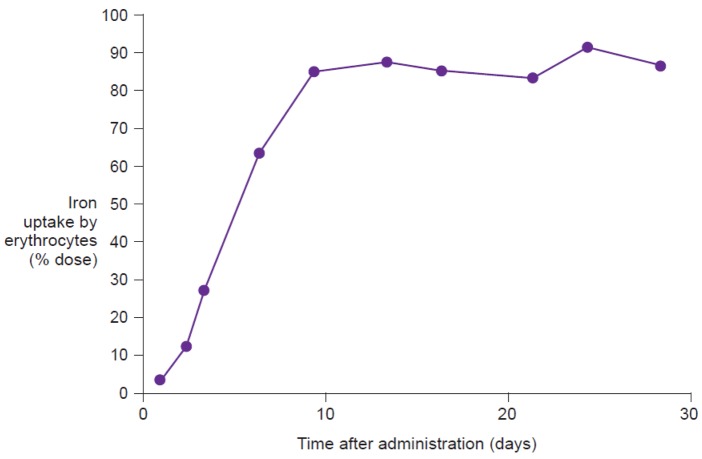
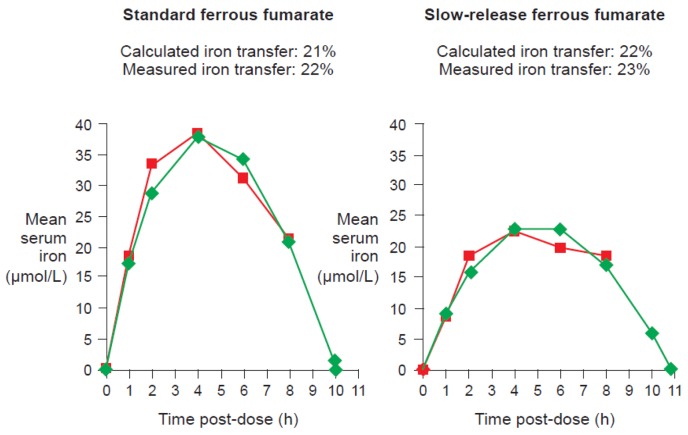
Standard approaches are not appropriate when assessing pharmacokinetics of iron supplements due to the ubiquity of endogenous iron, its compartmentalized sites of action, and the complexity of the iron metabolism. The primary site of action of iron is the erythrocyte, and, in contrast to conventional drugs, no drug-receptor interaction takes place. Notably, the process of erythropoiesis, i.e., formation of new erythrocytes, takes 3-4 weeks. Accordingly, serum iron concentration and area under the curve (AUC) are clinically irrelevant for assessing iron utilization. Iron can be administered intravenously in the form of polynuclear iron(III)-hydroxide complexes with carbohydrate ligands or orally as iron(II) (ferrous) salts or iron(III) (ferric) complexes. Several approaches have been employed to study the pharmacodynamics of iron after oral administration. Quantification of iron uptake from radiolabeled preparations by the whole body or the erythrocytes is optimal, but alternatively total iron transfer can be calculated based on known elimination rates and the intrinsic reactivity of individual preparations. Degradation kinetics, and thus the safety, of parenteral iron preparations are directly related to the molecular weight and the stability of the complex. High oral iron doses or rapid release of iron from intravenous iron preparations can saturate the iron transport system, resulting in oxidative stress with adverse clinical and subclinical consequences. Appropriate pharmacokinetics and pharmacodynamics analyses will greatly assist our understanding of the likely contribution of novel preparations to the management of anemia.


Figures

Figure 1.
Figure 1.
Schematic representation of iron metabolism. Under normal conditions, the iron in the body is in a dynamic equilibrium between different compartments (solid arrows). From approximately 10 mg of iron ingested with food, 1–2 mg are absorbed by duodenal enterocytes and the same amount is lost, e.g., via skin exfoliation. In the circulation, iron is bound to transferrin (ca. 3 mg), which safely transports it e.g., to the bone marrow for hemoglobin synthesis. Approximately two-thirds of the iron in the body is found in the form of hemoglobin, in red blood cells (1800 mg) and in erythroid precursors in the bone marrow (300 mg), whereas 10–15% is present in myoglobin and in a variety of different essential enzymes. Iron is stored in parenchymal cells of the liver (ca. 1000 mg). Reticuloendothelial macrophages temporarily store the iron recycled from senescent red blood cells (600 mg) in a readily available form. Erythropoetin, produced in the kidneys, regulates duodenal iron absorption and erythropoiesis (dashed lines). Adapted from Crichton, 2008 [7].
Figure 2.
Figure 2.
In vitro reactivity of Ferinject®, Venofer® and Ferrlecit® with apotransferrin. Urea polyacrylamide gel electrophoresis (PAGE) of transferrin incubated with different amounts of various intravenous iron preparations. Apo-Tf, transferrin with no iron; Fe-Tf, transferrin with one iron-binding site occupied; Fe2-Tf, transferrin with both iron-binding sites occupied [holotransferrin]. The reactivity towards apotransferrin was the lowest with the most stable complex, i.e. Ferinject®. At concentrations equivalent to those expected in the serum of an adult after a therapeutic dose of ∼200 or ∼2,000 mg of iron, transferrin saturation was observed with Ferrlecit® and Venofer® but not with Ferinject® (Technical communication, Vifor Pharma – Vifor International Inc).
Figure 3.
Figure 3.
Normalized simulated single first-order elimination kinetics for different intravenous iron preparations, depicted as fraction of total serum iron over time. Values of the terminal elimination rates given in Table 2 were used to calculate an overall first-order kinetics and t1/2 values. The figure clearly shows that the AUC is negatively correlated to the elimination rate constants.
Figure 4.
Figure 4.
Serum concentration of non-transferrin bound iron (NTBI) and percentage transferrin saturation (TSAT) following administration of a single oral dose of 100 mg iron in the form of three different ferrous salts to healthy adult volunteers. Broken blue lines indicate the percentage transferrin saturation (right-hand axis). Solid red lines indicate NTBI concentration (left-hand axis). Values shown are mean ± SD. Modified from Dresow et al. 2008 [34].
Figure 5.
Figure 5.
Increase in serum iron concentration after administration of 25, 50 and 100 mg ferrous iron in 6 healthy subjects [37]. Data are shown as mean ± SEM. The data clearly show that there is no linear relationship between serum iron increase (Cmax and AUC) and dose.
Figure 6.
Figure 6.
Utilization of iron following a single intravenous administration of radiolabeled iron sucrose (Venofer®) in a patient with iron deficiency anemia (modified from Beshara et al. 1999 [10]).
Figure 7.
Figure 7.
Illustration of the mean measured serum iron concentration (red lines) and the calculated curve (green lines) based on the following equation: C(t) = a (1−e−kin*t) − k0t, where C(t) is the serum iron concentration at time t, a is a constant, kin is the rate constant for iron absorption, and k0 is the rate constant for elimination. Data are from an open-label, single-dose, randomized, crossover bioequivalence study in 20 healthy female volunteers given standard oral ferrous fumarate or slow-release ferrous fumarate at a dose equivalent to 100 mg iron per intake (Modified from Geisser et al., 2009 [13]).

References

    1. Gotloib L., Silverberg D., Fudin R., Shostak A. Iron deficiency is a common cause of anemia in chronic kidney disease and can often be corrected with intravenous iron. J. Nephrol. 2006;19:161–167. - PubMed
    1. Nanas P.N., Matsouka C., Karageorgopoulos D., Leonti A., Tsolakis E., Drakos S.G., Tsagalou E.P., Maroulidis G.D., Alexopoulos G.P., Kanakakis J.E., et al. Etiology of anemia in patients with advanced heart failure. J. Amer. Coll. Cardiol. 2006;48:2485–2489. - PubMed
    1. Gasche C., Lomer M.C.E., Cavill I., Weiss G. Iron, anaemia, and inflammatory bowel diseases. Gut. 2004;53:1190–1197. - PMC - PubMed
    1. Kalantar-Zadeh K., Streja E., Miller J.E., Nissenson A.R. Intravenous iron versus erythropoiesis-stimulating agents: friends or foes in treating chronic kidney disease anemia? Adv. Chronic Kidney Dis. 2009;16:143–151. - PubMed
    1. Schümann K., Classen H.G., Hages M., Prinz-Langenohl R., Pietrzik K., Biesalski H.K. Bioavailability of oral vitamins, minerals, and trace elements in perspective. Drug Res. 1997;47:369–380. - PubMed

LinkOut - more resources