. 2014 Jan 17;343(6168):313-317.
doi: 10.1126/science.1246829. Epub 2013 Dec 5.

Vaccine activation of the nutrient sensor GCN2 in dendritic cells enhances antigen presentation

Affiliations

Vaccine activation of the nutrient sensor GCN2 in dendritic cells enhances antigen presentation

Rajesh Ravindran et al. Science. .

Abstract

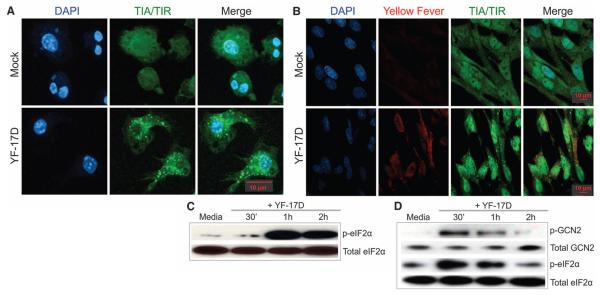
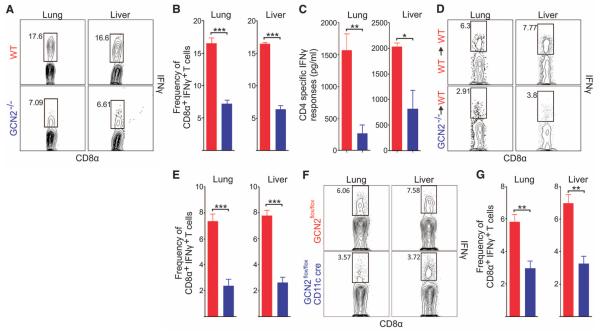
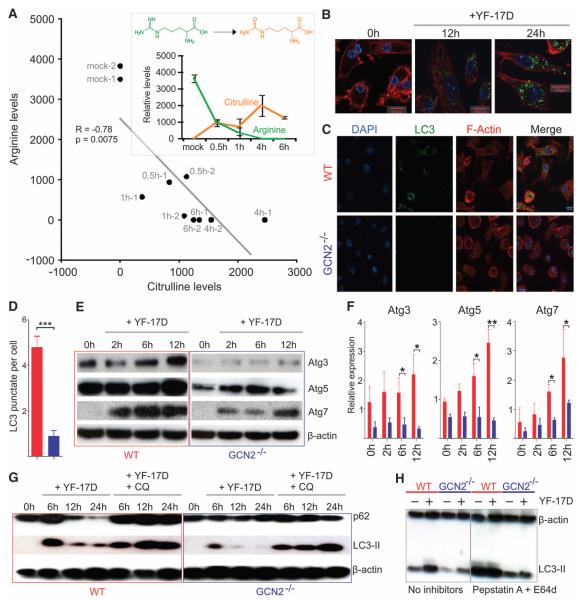
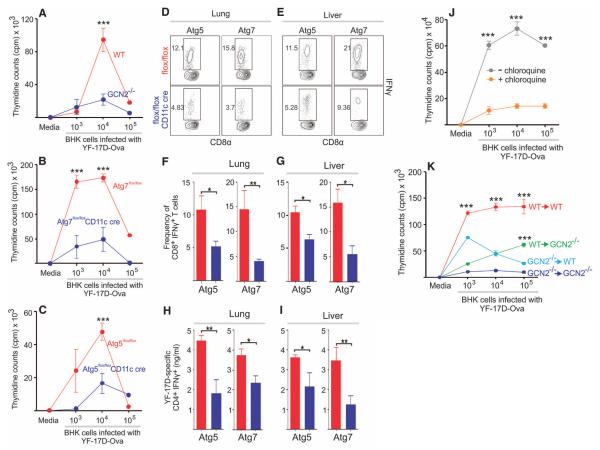
The yellow fever vaccine YF-17D is one of the most successful vaccines ever developed in humans. Despite its efficacy and widespread use in more than 600 million people, the mechanisms by which it stimulates protective immunity remain poorly understood. Recent studies using systems biology approaches in humans have revealed that YF-17D-induced early expression of general control nonderepressible 2 kinase (GCN2) in the blood strongly correlates with the magnitude of the later CD8(+) T cell response. We demonstrate a key role for virus-induced GCN2 activation in programming dendritic cells to initiate autophagy and enhanced antigen presentation to both CD4(+) and CD8(+) T cells. These results reveal an unappreciated link between virus-induced integrated stress response in dendritic cells and the adaptive immune response.


Figures

Fig. 1
Fig. 1. YF-17D induces activation of the GCN2/eIF2α–mediated stress response in DCs
(A) hmDCs or (B) BHK cells were mock-treated or cultured with YF-17D (24 hours), fixed, stained with TIA/TIR and 4,6-diamidino-2-phenylindole to visualize stress granule formation. Mouse BMDCs (C) or hmDCs (D) were mock-treated or cultured with YF-17D for the times indicated. “Media” represents cells not exposed to the virus. (C and D) Phosphorylation of GCN2 and eIF2α was assessed by means of Western blotting.
Fig. 2
Fig. 2. Lack of GCN2 in dendritic cells leads to impaired CD8+ and CD4+ T cell responses to YF-17D
Mice were immunized subcutaneously with 2 × 10⁶ plaque-forming units of YF-17D and euthanized on day 7. The magnitude of YF-17D–specific CD8 T cells was determined in the lung and liver with flow cytometry. (A and B) Representative fluorescence-activated cell sorting (FACS) plots (A) and frequencies (B) of CD8+ T cells producing IFN-γ in the lung and liver of wild-type versus GCN2−/− mice. (C) Assessment of YF-17D–specific CD4+ T cells producing IFN-γ in culture after 4-day ex vivo restimulation with class II restricted peptides from YF-17D. (D and E) Representative FACS plots gated on CD8+ T cells producing IFN-γ (D) and frequencies (E) of CD8+ T cells producing IFNγ in the lung and liver of chimeric mice in which the hematopoietic compartment of wild-type mice was reconstituted with bone marrow from either wild-type or GCN2−/− mice. (F and G) Representative FACS plots gated on CD8+ T cells producing IFN-γ in the lung and liver of GCN2flox flox × CD11c cre versus littermate control mice. In (E), (F), and (G), red indicates wild type, and blue indicates GCN2−/−. The graphs represent the averages of CD8+ IFN-γ–producing cells in the liver and lung in 5 mice per group. Data are representative of four independent experiments. ***P < 0.0005; **P < 0.005; *P < 0.05, calculated by Student’s t test. Graphs show mean ± SEM.
Fig. 3
Fig. 3. YF-17D induces autophagy in dendritic cells via a mechanism dependent on GCN2
(A) Inverse correlation between the concentrations of free arginine and citrulline in hmDCs stimulated with YF-17D. Mock-treated DCs at 6 hours (without virus) are shown as controls. (Inset) Mean relative abundance ± SD of arginine and citrulline. (B) Culture of hmDCs with YF-17D induces autophagy as visualized by means of confocal microscopy. (C) Comparison of autophagy (LC3 punctate staining) in mBMDCs from wild-type or GCN2−/− mice, cultured in vitro with YF-17D for 6 hours. (D) Counts of LC3 granules per cell. (E) Comparison of the autophagy proteins in BMDC from wild-type or GCN2−/− mice cultured in vitro with YF-17D. 0h represents 30 min after DCs are cultured in low volume of low fetal bovine serum medium with YF-17D. Basal levels of Atg5 and Atg7 in freshly isolated DC were similar in wild-type and GCN2−/− mice (fig. S20). (F) Densitometric analysis of Western blots from three independent experiments. (G) Autophagy flux experiments depicting p62 and LC3II accumulation by chloroquine after culture with YF-17D. (H) Autophagy flux showing accumulation of LC3II 6 hours after YF-17D culture after treatment with lysosomal inhibitors (pepstatin and E64D). Data are representative of three independent experiments. *P < 0.05; **P < 0.005, Student’s t test. Error bars indicate mean ± SEM
Fig. 4
Fig. 4. YF-17D enhances the ability of DCs to cross-present antigens via a mechanism dependent on GCN2 and autophagy
BMDCs from wild-type mice, or GCN2−/−, Atg5−/−, or Atg7−/− mice were cultured with lysates from BHK cells previously infected with YF-17D-Ova for 4 hours. The DCs were then cocultured with naïve OT-1 T cells. (A to C) Increased thymidine uptake showing increased proliferation by OT 1+ T cells stimulated by wild-type DCs as compared with (A) GCN2−/−, (B) Atg5−/−, and (C) Atg7−/− DCs. (D to I) YF-17D–specific (D to G) CD8+ T cell responses and (H and I) CD4+ T cell responses in Atg5flox/flox CD11c cre and Atg7flox/flox CD11c cre mice compared with littermate controls 7 days after vaccination with YF-17D. (J) Inhibition of autophagy by chloroquine results in impaired cross-presentation. (K) MEFs from either wild-type or GCN2−/− mice were first infected with YF-17D-Ova and then irradiated and then cocultured with either wild-type or GCN2−/− BMDCs. Then OT-1 T cells were added, and their proliferation was evaluated 72 hours later. Representative of three individual experiments. ***P < 0.0005; **P < 0.005; *P < 0.05, calculated by Student’s t test. Graphs show mean ± SEM.

References

    1. Querec TD, et al. Nat. Immunol. 2009;10:116–125. - PMC - PubMed
    1. Hinnebusch AG. Proc. Natl. Acad. Sci. U.S.A. 1984;81:6442–6446. - PMC - PubMed
    1. Sood R, Porter AC, Olsen DA, Cavener DR, Wek RC. Genetics. 2000;154:787–801. - PMC - PubMed
    1. Hao S, et al. Science. 2005;307:1776–1778. - PubMed
    1. Lu J, O’Hara EB, Trieselmann BA, Romano PR, Dever TE. J. Biol. Chem. 1999;274:32198–32203. - PubMed

Publication types

MeSH terms