. 2014 Jan 3;343(6166):72-6.
doi: 10.1126/science.1241328. Epub 2013 Dec 5.

Targeted therapy resistance mediated by dynamic regulation of extrachromosomal mutant EGFR DNA

Affiliations

Targeted therapy resistance mediated by dynamic regulation of extrachromosomal mutant EGFR DNA

David A Nathanson et al. Science. .

Abstract

Intratumoral heterogeneity contributes to cancer drug resistance, but the underlying mechanisms are not understood. Single-cell analyses of patient-derived models and clinical samples from glioblastoma patients treated with epidermal growth factor receptor (EGFR) tyrosine kinase inhibitors (TKIs) demonstrate that tumor cells reversibly up-regulate or suppress mutant EGFR expression, conferring distinct cellular phenotypes to reach an optimal equilibrium for growth. Resistance to EGFR TKIs is shown to occur by elimination of mutant EGFR from extrachromosomal DNA. After drug withdrawal, reemergence of clonal EGFR mutations on extrachromosomal DNA follows. These results indicate a highly specific, dynamic, and adaptive route by which cancers can evade therapies that target oncogenes maintained on extrachromosomal DNA.


Figures

Fig. 1
Fig. 1. Resistance to EGFR TKIs in preclinical models and GBM patients treated with an EGFR TKI is associated with a decreasing ratio of EGFRvIIIHigh/EGFRvIIILow tumor cells
(A) FACS-sorted EGFRvIIIHigh and EGFRvIIILow cells obtained from GBM39 differ in their PI3K-Akt-mTOR activity as determined by immunoblotting. (B) Immunofluorescence (IF) for EGFRvIII and Ki-67 on isolated GBM39 tumor cells shows differences in basal proliferative rate between EGFRvIIIHigh and EGFRvIIILow tumor cells. *P < 0.005. (C) Terminal deoxynucleotidyl transferase–mediated deoxyuridine triphosphate nick end labeling (TUNEL) stain and EGFRvIII IF indicate a higher basal apoptosis in EGFRvIIILow tumor cells. *P < 0.005. (D and E) Radiopharmaceutical imaging chip analysis of 18F-fluorodeoxyglucose from FACS-sorted EGFRvIIIHigh and EGFRvIIILow cells indicates higher glucose uptake in EGFRvIIIHigh cells. **P < 0.05. (F) FACS-sorted EGFRvIIIHigh and EGFRvIIILow were treated with erlotinib (5 μM) for 24 hours, and cell viability was determined by trypan blue exclusion assay. **P < 0.05. (G and H) Resistance to erlotinib in GBM39 xenografts (n = 4 mice per group). During initial response (blue curve) and at the time of resistance (red curve), there is a relative loss of EGFRvIII-expressing tumor cells. (I and J) In GBM patients, 10 days of treatment with the EGFR tyrosine kinase inhibitor lapatinib reduces EGFRvIII expression relative to pretreatment levels. *P < 0.01; **P < 0.0001; #P < 0.001. All values are mean ± SEM. P values were obtained from unpaired t test.
Fig. 2
Fig. 2. Sorted populations of EGFRvIIIHigh or EGFRvIIILow GBM cells give rise to identical mixed tumors in vivo
(A) Tumor cells from GBM39 xenografts sorted for EGFRvIII expression and injected into mice are equally tumorigenic (n = 4 mice per group). The white line indicates 1 inch. (B) FACS analysis of sorted cells reveals that enriched populations of EGFRvIIIHigh and EGFRvIIILow tumor cells re-establish mixed populations within 2 weeks. (C) Analysis of xenograft models deriving from sorted EGFRvIIIHigh and EGFRvIIILow tumor cell populations from (A) that give rise to tumors with an EGFRvIIIHigh/EGFRvIIILow tumor cell composition similar to that of initial, untreated GBM39 tumors. Values are mean ± SEM. (D and E) GBM39 tumor cells sorted for EGFRvIII expression and plated at a single cell per well and stained for EGFRvIII (red) and 4′,6-diamidino-2-phenylindole (DAPI) (blue) give rise to heterogeneous colonies. (F) Identical EGFRvIIIHigh/EGFRvIIILow composition from tumor cells sorted in (D) and plated at 2 to 5 cells per well. Values are mean ± SEM from n = 5 independent cultures.
Fig. 3
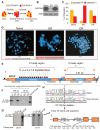
Fig. 3. GBM cells suppress EGFRvIII protein expression on prolonged exposure to erlotinib and up-regulate it upon drug withdrawal by restoring EGFR+ extrachromosomal DNA elements
(A) Schematic model of reversible EGFR TKI resistance model. GBM39 cells were maintained in neurosphere culture and were treated continuously with vehicle (naïve) or erlotinib [5 μM, erlotinib-resistant (ER), 60 days]. Drug was removed from the ER neurospheres for 30 days [drug-removed (DR)]. (B) Immunoblot of EGFRvIII levels for naïve, ER, and DR cells. (C) MIC chip quantification of the ratio of EGFRvIIIHigh and EGFRvIIILow tumor cells in naïve, ER, and DR cells. (D). DAPI-stained metaphases of naïve, ER, and DR cells probed with EGFR (red) and chromosome 7 centromere probes (CEP7, green) with abundant EGFR+ extrachromosomal DNA elements in naïve and DR GBM cells. No extrachromosomal EGFR+ DNA elements were detected in any of the ER metaphase spreads. The white arrow shows EGFR+ HSR-like staining of a marker chromosome lacking centromere 7. One such DNA element was found in metaphases from each ER GBM cell analyzed. They were also detected in some naïve and drug-removed metaphases. (E) Map of EGFR gene between exon 1 and intron 8. (F) Southern blot analysis shows binding of EGFR probe (red line) to low-molecular-weight DNA, which is lost during resistance and reemerges with drug withdrawal. Normal genomic DNA is used as control for EGFR probe. (G) PCR using primers spanning each of the 17 Bam H1 restriction sites from 5′ of exon 1 through intron 8 (see supplementary materials) was used to identify EGFRvIII or wild-type EGFR. Primer pairs 13/17 and 14/17 span regions that are 32 kb apart in wild-type EGFR but only slightly more than 4 kb in EGFRvIII. Primer pairs 13/17 and 14/17 cannot amplify wild-type EGFR but result in amplification of EGFRvIII from low-molecular-weight DNA of naïve and drug-removed GBM39 cells. No EGFRvIII was detected in erlotinib-resistant GBM39 cells. Primers 15 and 16 are both deleted in EGFRvIII but maintained in wild-type EGFR. Primer pair 16/17 yields a 3.3-kb wild-type EGFR band in normal control DNA. Representative images of primer pairs 16/17 and 13/17 are shown. (H and I) Sequencing of the cloned fragments reveals identical intronic breakpoints associated with a 27,785–base pair deletion of exon 3 to 7 sequences and resulting in EGFRvIII transcript and protein in treatment-naïve and drug-removed GBM39 cells.
Fig. 4
Fig. 4. Loss of EGFR extrachromosomal DNA elements in GBM patient samples treated with EGFR TKI
(A) Quantitative PCR analysis of EGFRvIII extrachromosomal DNA in three GBM patient-derived neurosphere lines. Erlotinib resistance for GBM6 and HK296 was established by continuous erlotinib treatment (1 μM) for 30 days. DR for GBM6 and HK296 was established after removing erlotinib from ER cultures for 3 days. Conditions for GBM39 were described above. Values are mean ± SEM from n > 9 replicates. *P < 0.0001 from unpaired t test. (B) Representative images (left) and quantification (right) from dual-colorFISH(CEP7,green;EGFR, red) performed on pre/post matched pairs of GBM tissue sections from n = 2 patients treated with lapatinib for 10 days (patients #2 and #3 from Fig. 1J). Nuclei were counterstained with DAPI. Values are mean ± SD. *P < 0.005 from unpaired t test. (C) Representative images (left) and quantification (right) from dual-color FISH (CEP7, green; EGFR, red) performed on pre/post matched pairs of GBM tissue sections from n = 4 EGFRvIII-positive patients treated with radiation and concomitant chemotherapy using standard dosing of temozolomide. Nuclei were counterstained with DAPI. Values are mean ± SD.

References

    1. Vogelstein B, et al. Science. 2013;339:1546–1558. - PMC - PubMed
    1. Garraway LA, Jänne PA. Cancer Discov. 2012;2:214–226. - PubMed
    1. Glickman MS, Sawyers CL. Cell. 2012;148:1089–1098. - PMC - PubMed
    1. Bonavia R, Inda MM, Cavenee WK, Furnari FB. Cancer Res. 2011;71:4055–4060. - PMC - PubMed
    1. Brennan CW, et al. Cell. 2013;155:462–477. - PMC - PubMed

Publication types

MeSH terms