. 2013 Dec 6;342(6163):1247-50.
doi: 10.1126/science.1244689.

Hedgehog signaling controls T cell killing at the immunological synapse

Affiliations

Hedgehog signaling controls T cell killing at the immunological synapse

Maike de la Roche et al. Science. .

Abstract

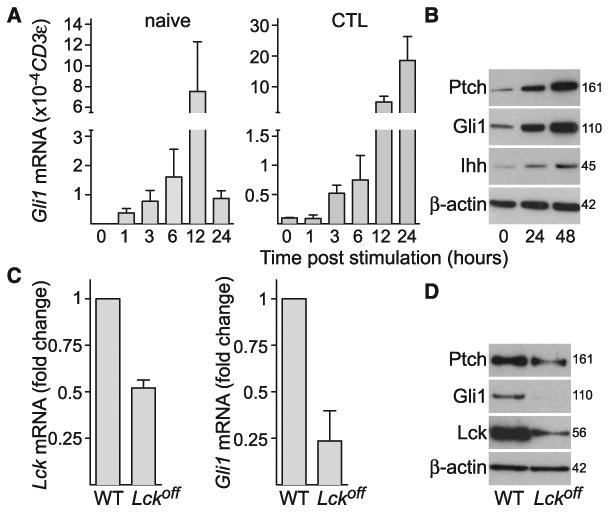
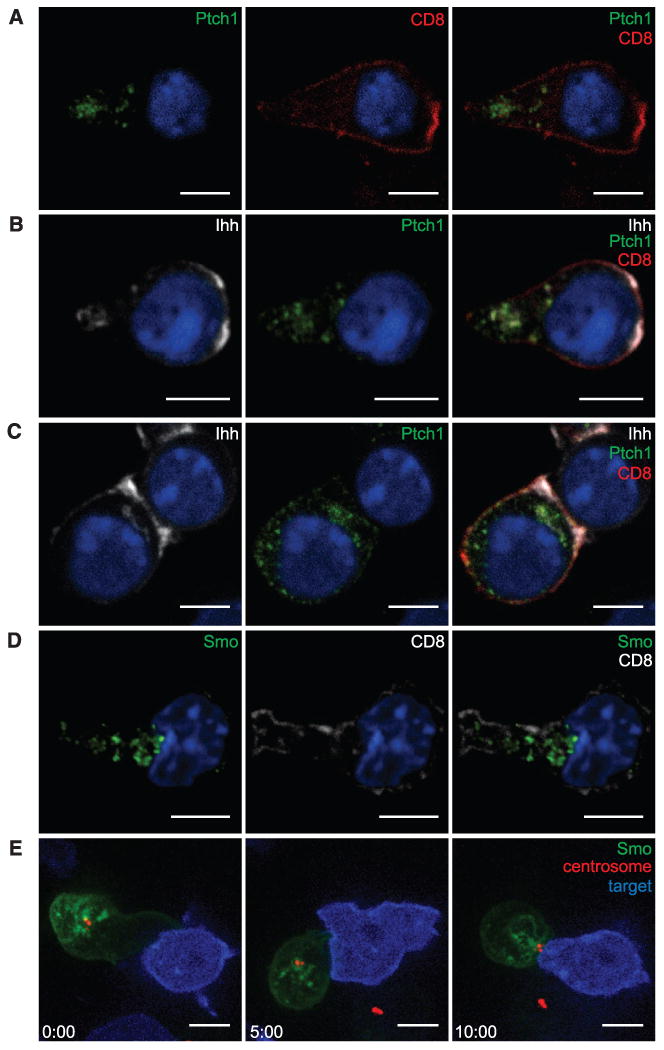
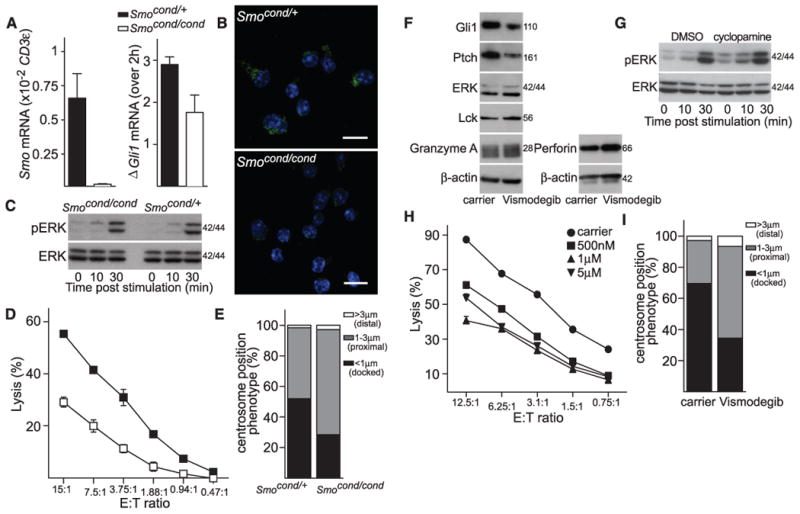
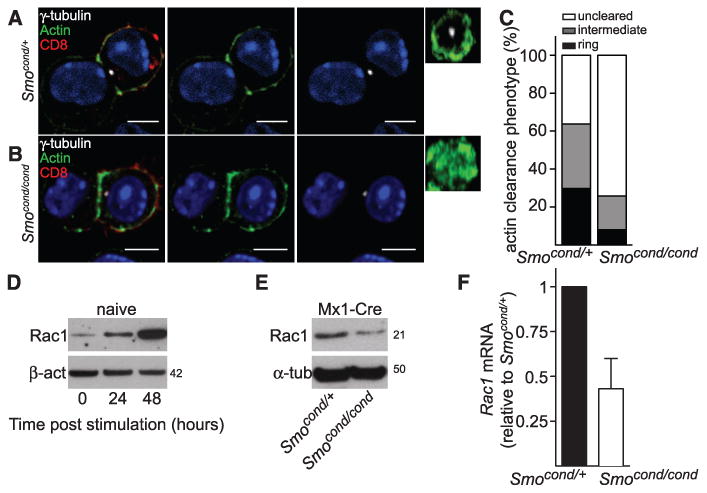
The centrosome is essential for cytotoxic T lymphocyte (CTL) function, contacting the plasma membrane and directing cytotoxic granules for secretion at the immunological synapse. Centrosome docking at the plasma membrane also occurs during cilia formation. The primary cilium, formed in nonhematopoietic cells, is essential for vertebrate Hedgehog (Hh) signaling. Lymphocytes do not form primary cilia, but we found and describe here that Hh signaling played an important role in CTL killing. T cell receptor activation, which "prearms" CTLs with cytotoxic granules, also initiated Hh signaling. Hh pathway activation occurred intracellularly and triggered Rac1 synthesis. These events "prearmed" CTLs for action by promoting the actin remodeling required for centrosome polarization and granule release. Thus, Hh signaling plays a role in CTL function, and the immunological synapse may represent a modified cilium.


Figures

Fig. 1
Fig. 1. TCR activation triggers Hh signaling and expression of Hh components in CD8 T cells
(A) Quantitative polymerase chain reaction (qPCR) showing mRNA levels of Gli1 in naïve CD8 T cells (left) and CTLs (right) at times shown after TCR cross-linking with plate-bound antibody against CD3 relative to CD3ε as a reference gene; n = 3 (naïve) or 2 (CTLs); data are means ± SD. Similar results were obtained using the gene for TATA box–binding protein (Tbp) as a reference gene (not shown). Cells plated without antibody against CD3 showed no Gli1 induction over 12 hours. (B) Immunoblot analysis of protein expression of Ptch, Gli1, Ihh, and actin at 0, 24, and 48 hours after TCR stimulation in naïve CD8 T cells; n = 3. Molecular masses are shown in kilodaltons. Similar results were also obtained from CD8 T cells derived from C57BL/6 and BALB/c mice (not shown). (C and D) Naïve CD8 T cells were purified from spleens of wild-type (WT) or Lckoff mice and stimulated for 12 hours with plate-bound antibody against CD3. (C) Graphs showing mRNA levels of Lck (left) and Gli1 (right) in Lckoff CD8 T cells relative to WT control; n = 2, data are means ± SD. (D) Immunoblot analysis of Ptch, Gli1, Lck, and actin in Lckoff and WT control CD8 T cells after 12 hours of TCR stimulation; n = 3. Molecular masses are shown in kilodaltons.
Fig. 2
Fig. 2. Ihh, Ptch1, and Smo are localized on intracellular vesicles that polarize toward the immunological synapse
OT-I CTLs transduced with Ptch1-EYFP and labeled with antibodies to EYFP (green), CD8 (red), and Ihh (white). (A and B) show OT-1 CTLs alone and (C) conjugated with EL4 target cells. (D) Endogenous Smo (green) and CD8 (white) in OT-I CTLs. Single x-y confocal sections are shown. Nuclei are stained with Hoechst (blue). (A: n > 75;B and C: n > 35;D: n > 85; two to four independent experiments each). (E) Individual frames of a movie (movie S1) showing OT-I CTLs nucleofected with Smo-EGFP and PACT-RFP (centrosome marker, red), forming a synapse with EL4 target cells (blue). Time after initial contact is shown in minutes (n = 33). Scale bars: 5 μm.
Fig. 3
Fig. 3. Hh signaling is required for CTL killing and centrosome polarization to the immunological synapse
(A) qPCR analysis of Smo mRNA expression in Mx1-Cre Smocond/cond and control Mx1-Cre Smocond/+ CTLs relative to CD3ε as a reference gene (left) (n = 4, data are means ± SD); or Gli1 mRNA levels 2 hours after TCR activation with plate-bound antibody against CD3 for Mx1-Cre Smocond/+ and Mx1-Cre Smocond/cond CTLs relative to unstimulated (right); n = 3, data are means ± SD. (B) Representative staining of endogenous Smo (green) expression in Mx1-Cre Smocond/+ and Mx1-Cre Smocond/cond CTLs. Nuclei stained with Hoechst (blue); n > 100. Scale bars: 5 μm. (C) Mx1-Cre Smocond/+ and Mx1-Cre Smocond/cond CTLs were stimulated with plate-bound CD3-specific antibody for times indicated and blotted for protein expression of phosphorylated ERK (pERK) and ERK; n = 2. Molecular masses are shown in kilodaltons. (D) Percentage lysis of P815 target cells by Mx1-Cre Smocond/+ and Mx1-Cre Smocond/cond CTLs at effector:target (E:T) ratios shown (n = 6). (E) Centrosome position relative to clustered Lck was classified as <1 μm (docked), 1 to 3 μm (proximal) or >3 μm (distal) as percentage of conjugates of Mx1-Cre Smocond/+ (n = 129) and Mx1-Cre Smocond/cond (n = 121) with P815 targets as depicted in fig. S4 (n = 3), data are means ± SD. (F) Immunoblots of cell lysates from OT-I CTLs treated with 5 μM vismodegib for 36 hours, probed with antibodies against Gli1, Ptch, ERK, Lck, granzyme A, perforin, and β-actin; n = 2. (G) OT-I CTLs treated with 10 μM cyclopamine for 24 hours, stimulated with plate-bound CD3-specific antibody for times indicated and blotted for protein expression of pERK and ERK; n = 2. Molecular masses are shown in kilodaltons. (H) Percentage lysis of EL4 target cells by OT-I CTLs treated with vismodegib at concentrations stated; n = 5. The x axis shows varying CTL effector:target (E:T) ratios. (I) OT-I CTLs treated with vismodegib (5 μM) were labeled with antibodies against Lck, γ-tubulin, and CD8. Quantification of centrosome polarization after treatment is shown (n > 60).
Fig. 4
Fig. 4. Hh signaling in CTLs controls Rac1 expression and actin reorganization at the immunological synapse
(A to C) Mx1-Cre Smocond/+(A) and Mx1-Cre Smocond/cond CTLs (B) were conjugated to P815 target cells for 15 min, then fixed and stained by using antibodies against CD8, γ-tubulin, and actin. Single x-y confocal sections and en face (y-z) constructions through the synapse are shown, which demonstrate that the actin ring does not form properly in Mx1-Cre Smocond/cond CTLs. Nuclei stained with Hoechst (blue). Scale bars: 5 μm. (C) Quantification of actin clearance at the immunological synapse, depicting the percentage of CTLs in which actin remains distributed throughout the synapse (not cleared), show an intermediate phenotype, or are cleared to form an actin ring (Smocond/+ n = 47; Mx1-Cre Smocond/cond n = 62). Immunoblot analyses of protein expression of Rac1, actin, and calnexin (D) at 0, 24, and 48 hours after TCR stimulation in naïve CD8 T cells (n = 3) and (E) Mx1-Cre Smocond/+ and Mx1-Cre Smocond/cond CTLs (n = 2). Molecular masses are shown in kilodaltons. (F) qPCR showing mRNA levels of Rac1 in Mx1-Cre Smocond/cond CTLs relative to Mx1-Cre Smocond/+ control CTLs n = 3, data are means ± SD.

Comment in

  • Immunology. Do T cells have a cilium?
    Le Borgne M, Shaw AS. Le Borgne M, et al. Science. 2013 Dec 6;342(6163):1177-8. doi: 10.1126/science.1248078. Science. 2013. PMID: 24311670 No abstract available.

References

    1. Stinchcombe JC, Majorovits E, Bossi G, Fuller S, Griffiths GM. Nature. 2006;443:462–465. - PubMed
    1. Monks CR, Freiberg BA, Kupfer H, Sciaky N, Kupfer A. Nature. 1998;395:82–86. - PubMed
    1. Stinchcombe JC, Griffiths GM. Annu Rev Cell Dev Biol. 2007;23:495–517. - PubMed
    1. Wheatley DN. Pathobiology. 1995;63:222–238. - PubMed
    1. Griffiths GM, Tsun A, Stinchcombe JC. J Cell Biol. 2010;189:399–406. - PMC - PubMed

Publication types

MeSH terms