. 2014 Feb;239(2):202-12.
doi: 10.1177/1535370213509213. Epub 2013 Dec 5.

Upregulation of zinc transporter 2 in the blood-CSF barrier following lead exposure

Affiliations

Upregulation of zinc transporter 2 in the blood-CSF barrier following lead exposure

Xue Fu et al. Exp Biol Med (Maywood). 2014 Feb.

Abstract

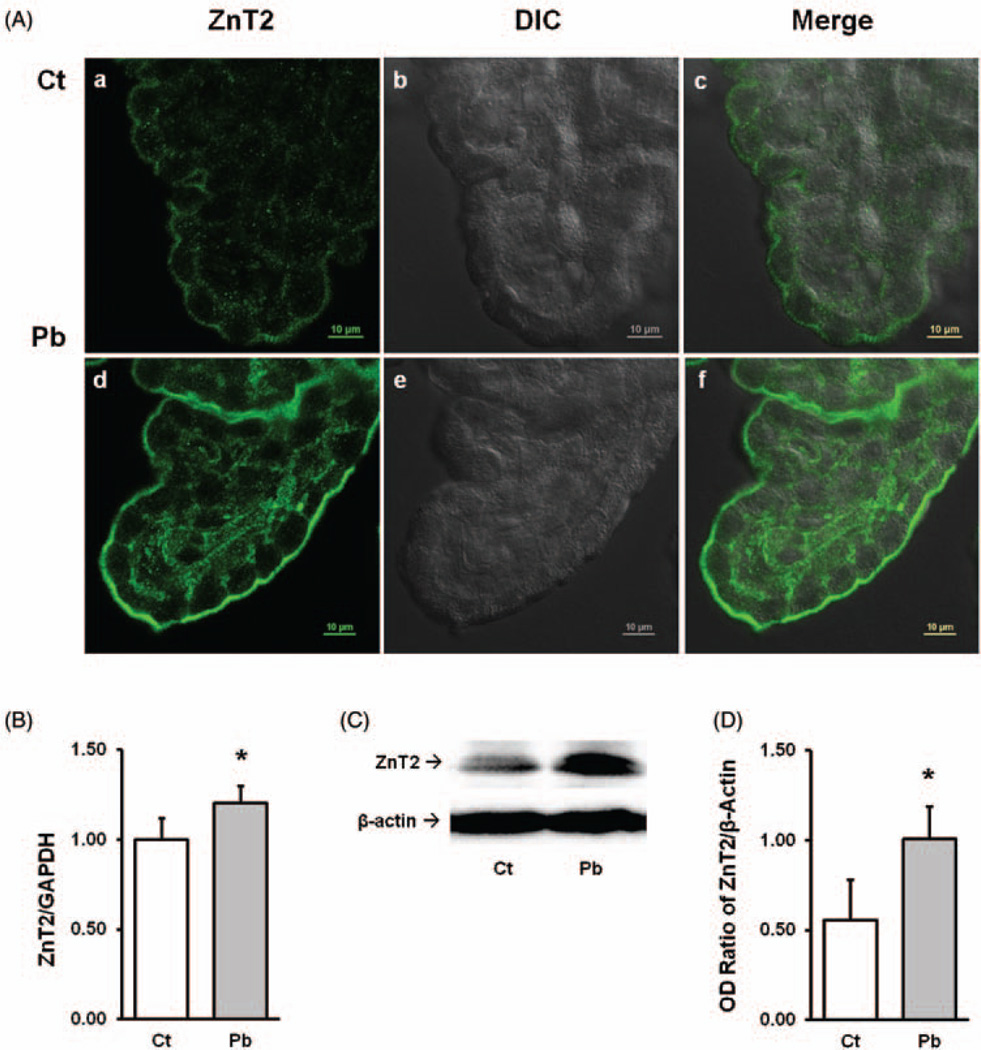
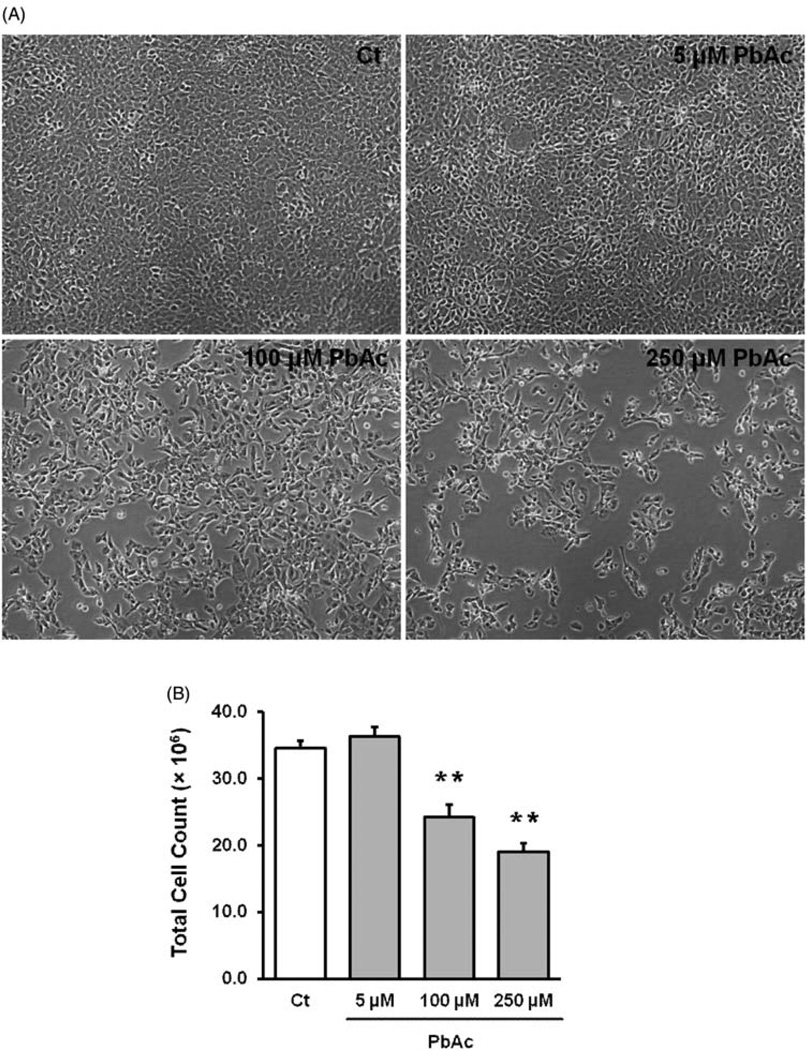
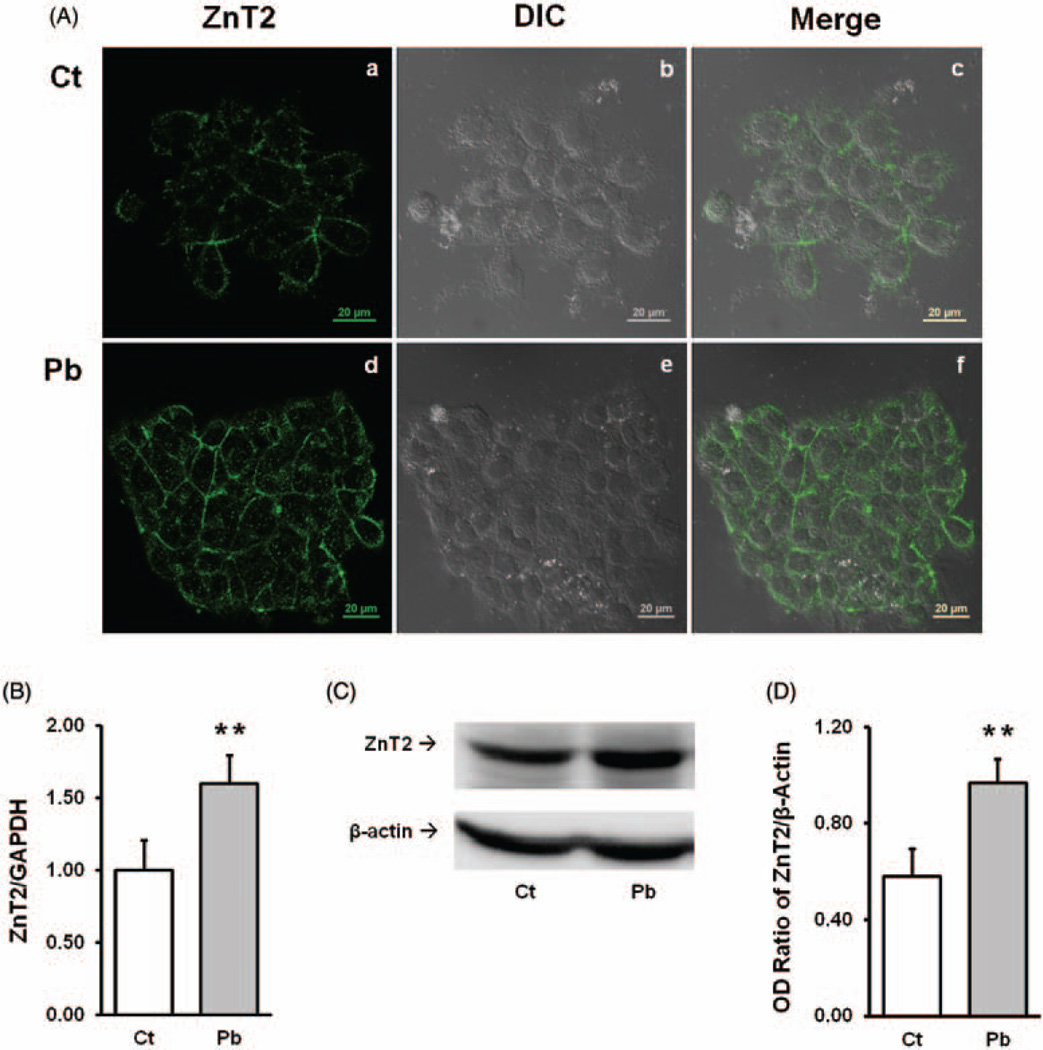
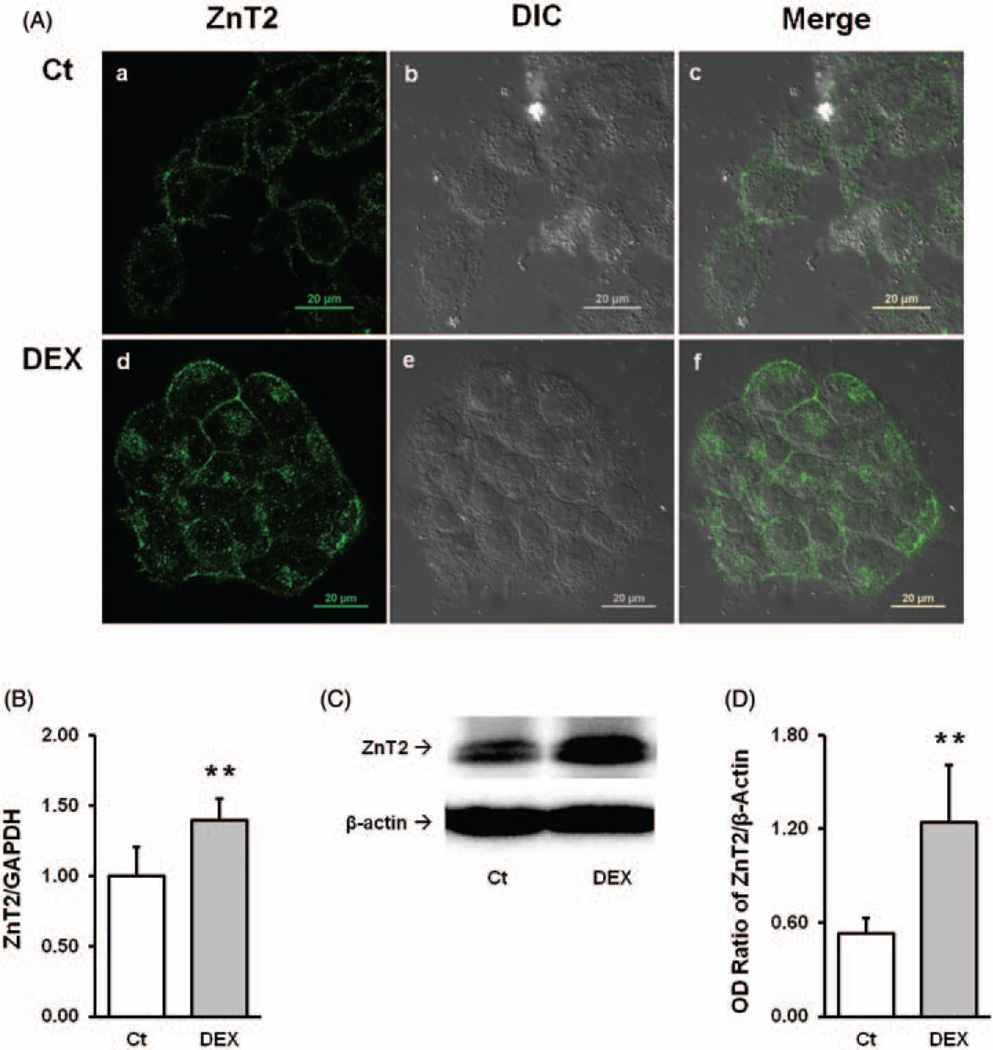
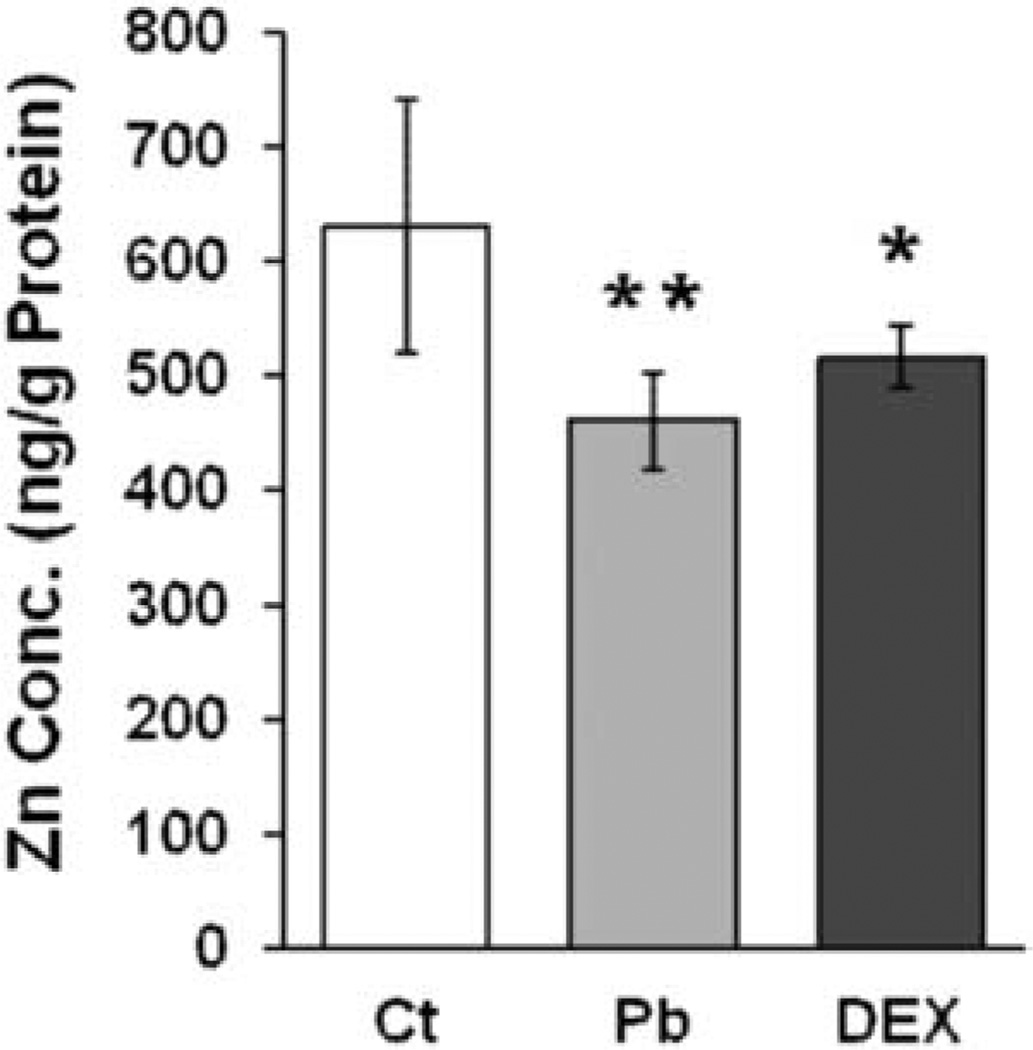
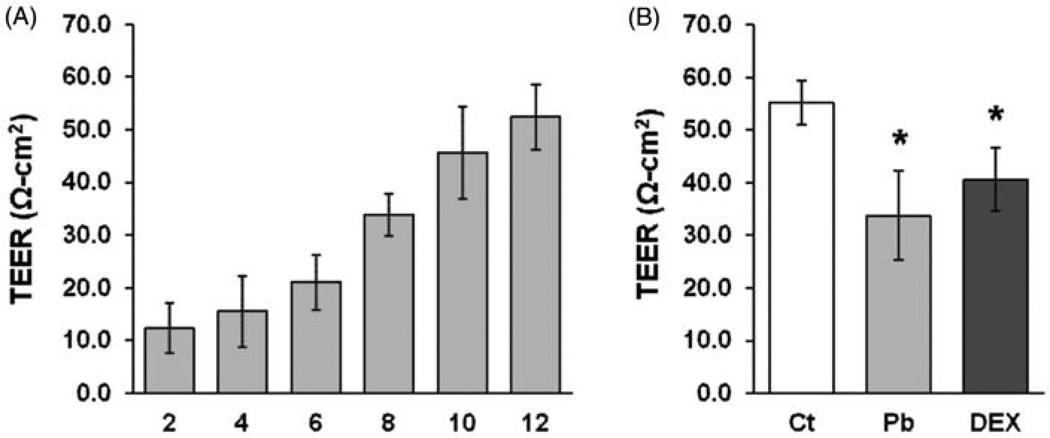
Zinc (Zn) is an essential element for normal brain function; an abnormal Zn homeostasis in brain and the cerebrospinal fluid (CSF) has been implied in the etiology of Alzheimer's disease (AD). However, the mechanisms that regulate Zn transport in the blood-brain interface remain unknown. This study was designed to investigate Zn transport by the blood-CSF barrier (BCB) in the choroid plexus, with a particular focus on Zn transporter-2 (ZnT2), and to understand if lead (Pb) accumulation in the choroid plexus disturbed the Zn regulatory function in the BCB. Confocal microscopy, quantitative PCR and western blot demonstrated the presence of ZnT2 in the choroidal epithelia; ZnT2 was primarily in cytosol in freshly isolated plexus tissues but more toward the peripheral membrane in established choroidal Z310 cells. Exposure of rats to Pb (single ip injection of 50 mg Pb acetate/kg) for 24 h increased ZnT2 fluorescent signals in plexus tissues by confocal imaging and protein expression by western blot. Similar results were obtained by in vitro experiments using Z310 cells. Further studies using cultured cells and a two-chamber Transwell device showed that Pb treatment significantly reduced the cellular Zn concentration and led to an increased transport of Zn across the BCB, the effect that may be due to the increased ZnT2 by Pb exposure. Taken together, these results indicate that ZnT2 is present in the BCB; Pb exposure increases the ZnT2 expression in choroidal epithelial cells by a yet unknown mechanism and as a result, more Zn ions may be deposited into the intracellular Zn pool, leading to a relative Zn deficiency state in the cytoplasm at the BCB.

Keywords: Z310 cells; Zinc (Zn); blood–CSF barrier; lead (Pb); zinc transporter 2 (ZnT2).


Figures

Figure 1
Figure 1
Expression of ZnT2 in choroid plexus tissue and effect of Pb exposure. A(a–c). Choroid plexus tissues were dissected from the lateral ventricles. A(d–f). For in vivo Pb exposure, animals received a single ip injection of 50 mg PbAc for 24 h. A(a) and A(d) show the ZnT2 green fluorescent signal; A(b) and A(c) show the DIC mages; A(c) and A(f) are the merged images of ZnT2 fluorescent signal and DIC. (B) qPCR quantitation of ZnT2 mRNA expression in the choroid plexus. Data represent mean ± SD, n=6, *P < 0.05, as compared with the control. (C) Western blot analysis of ZnT2 in the choroid plexus. β-actin was used as the house-keeping protein. (D) Quantification of western blot was expressed as the OD ratio of ZnT2/β-actin. Data represent mean ± SD, n=3, *P < 0.05 as compared with the control. (A color version of this figure is available in the online journal.)
Figure 2
Figure 2
Effect of Pb exposure on cultured Z3310 cells. (A) Cells were treated with 5,100, and 250 µM Pb for 24 h. The cell morphology appeared normal in the 5 mM Pb group, while the cell numbers were visibly lower in higher Pb dose groups. (B) Dose-response relationship between Pb treatment and total cell counts. Data represent mean ± SD, n=6, **P < 0.01 as compared with the control
Figure 3
Figure 3
Presence of ZnT2 in choroidal Z310 cells and effect of Pb exposure. A(a–c)) Control cells; A(d–f) Pb-treated Z310 cells. A(a) and A(d) show the ZnT2 green fluorescent signal; A(b) and A(c) show the DIC images; A(c) and A(f) are the merged images of ZnT2 fluorescent signal and DIC. (B) qPCR quantitation of ZnT2 mRNA expression. Data represent mean ± SD, n=6, **P < 0.01 as compared with the control. (C) Western blot analysis of ZnT2 in Z310 cells. β-actin was used as the internal control. (D) Western blot quantification. Data represent mean±SD, n=3, *P<0.01, as compared with the control. (A color version of this figure is available in the online journal.)
Figure 4
Figure 4
Upregulation of ZnT2 following DEX exposure. A(a–c)Control images; A(d–f) Pb-treated Z310 cells. A(a) and A(d) show the ZnT2 green fluorescent signal; A(b) andA(c) show the DIC images; A(c) and A(f) are the merged images of ZnT2 fluorescent signal and DIC. (B) qPCR result of increased ZnT2 mRNA expression following DEX exposure. Data represent mean±SD, n=6, **P<0.01 as compared with the control. (C) Western blot result of ZnT2 and β-actin. (D) Quantification of western blot. Data represent mean±SD, n=4, *P<0.01, as compared with the control. (A color version of this figure is available in the online journal.)
Figure 5
Figure 5
Decreased intracellular Zn level following Pband DEX exposure. Cells were incubated 5 µM PbAc and 100nM DEX for 24 h followed by 1 h incubation with 3 µM ZnCl2. The intracellular Zn concentration was determined by AAS. Result shows the intracellular Zn concentrations (ng Zn/g protein) in the control, Pb- and DEX-treated groups. Data represent MD ± SD, n=6, *P < 0.05, **P < 0.01, as compared with the control
Figure 6
Figure 6
Transwell permeability as affected by treatment of Pb and DEX. (A) Primary choroid plexus epithelial cells were cultured in the inner chamber of the Transwell device for 12 days and the TEER values were measured to track the formation of the monolayer. (B) After the monolayer barrier was formed, the primary cells were treated with 5 µM PbAc and 100 nM DEX for 24 h. At the end of the treatment, the TEER values were measured. Data represent MD ± SD, n=4–6, *P < 0.05, as compared with the control.

References

    1. Colvin RA, Davis N, Nipper RW, Carter PA. Zinc transport in the brain: routes of zinc influx and efflux in neurons. J Nutr. 2000;130:1484S–1487S. - PubMed
    1. Prasad AS. The role of zinc in brain and nerve functions. In: Connor, editor. Metals and oxidative damage in neurological disorders. New York, NY: Plenum Press; 1997. pp. 95–111.
    1. Takeda A. Zinc homeostasis and functions of zinc in the brain. BioMetals. 2001;14:343–351. - PubMed
    1. Kim YH, Park JH, Hong SH, Koh JY. Nonproteolytic neuroprotection by human recombinant tissue plasminogen activator. Science. 1999;284:647–650. - PubMed
    1. Kim EY, Koh JY, Kim YH, Sohn S, Joe E, Gwag BJ. Zn2+ entry produces oxidative neuronal necrosis in cortical cell cultures. Eur J Neurosci. 1999;11:327–334. - PubMed

Publication types