. 2014 Jan 31;289(5):2826-38.
doi: 10.1074/jbc.M113.527754. Epub 2013 Dec 5.

Down-modulation of SEL1L, an unfolded protein response and endoplasmic reticulum-associated degradation protein, sensitizes glioma stem cells to the cytotoxic effect of valproic acid

Affiliations

Down-modulation of SEL1L, an unfolded protein response and endoplasmic reticulum-associated degradation protein, sensitizes glioma stem cells to the cytotoxic effect of valproic acid

Monica Cattaneo et al. J Biol Chem. .

Abstract

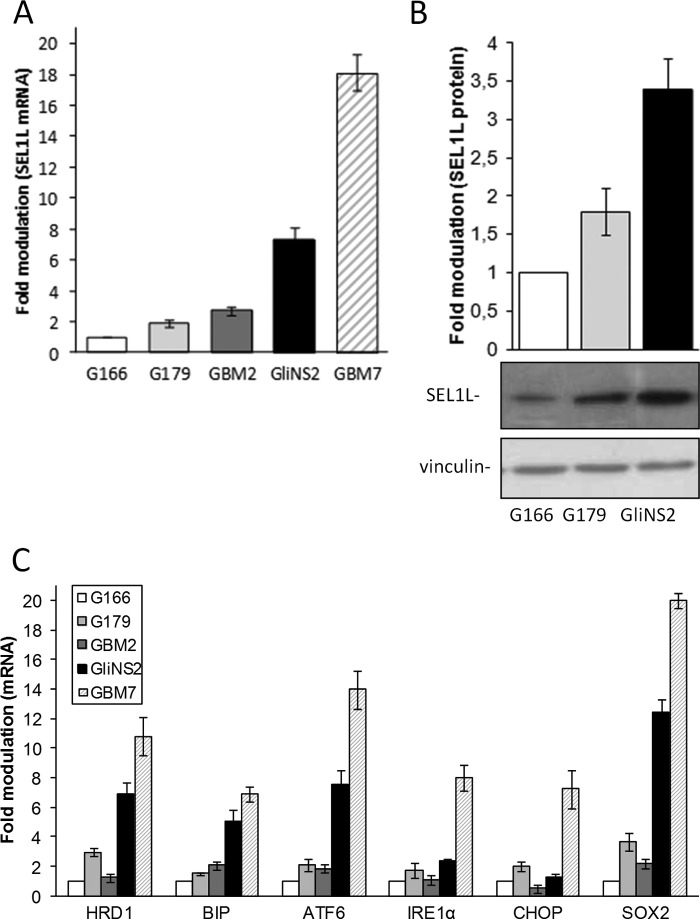
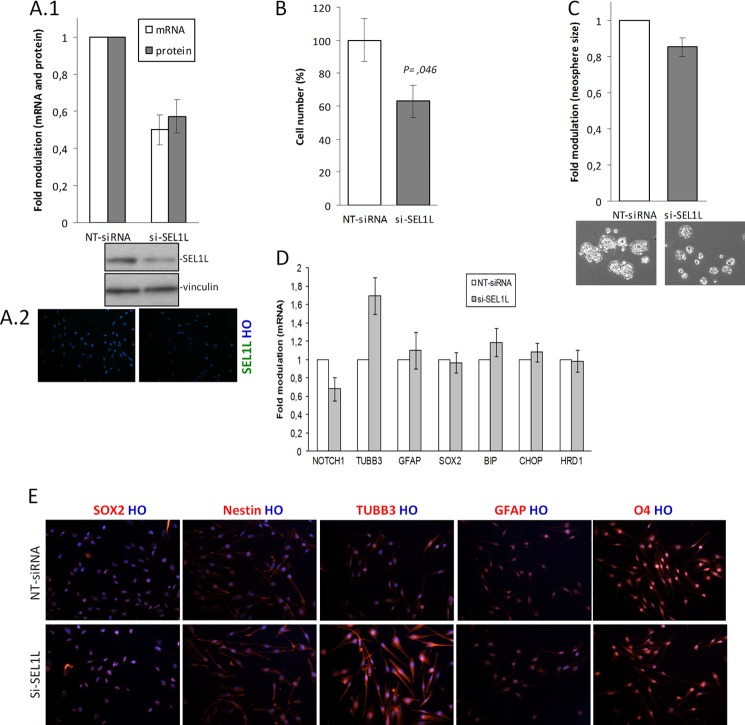
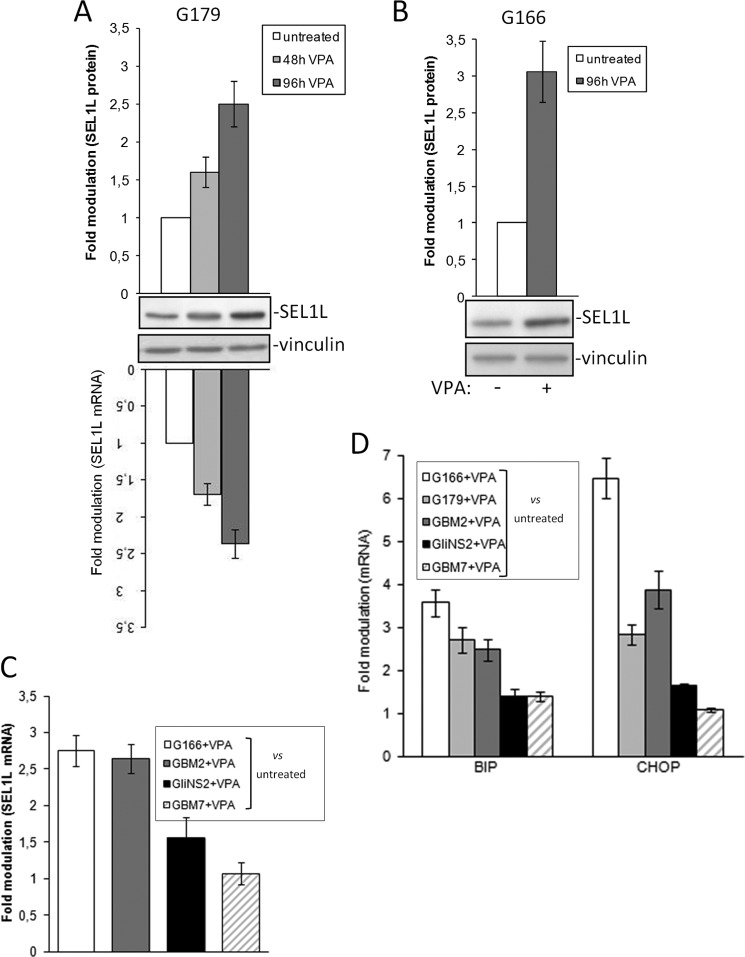
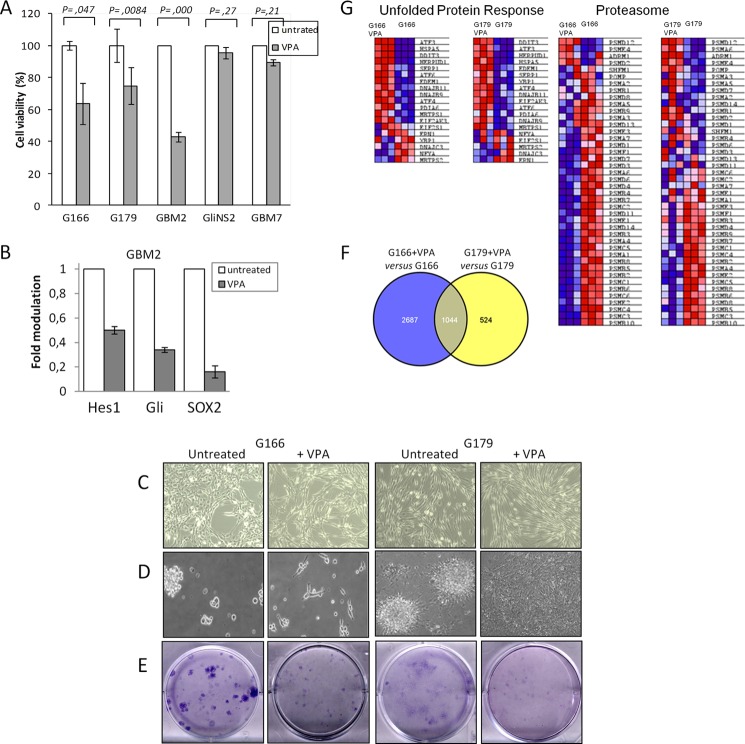
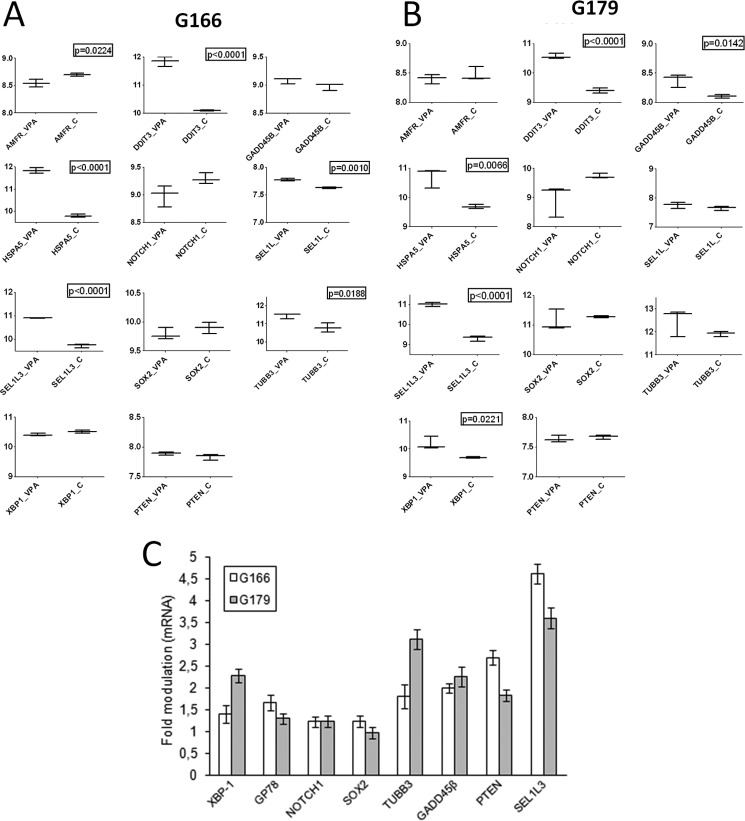
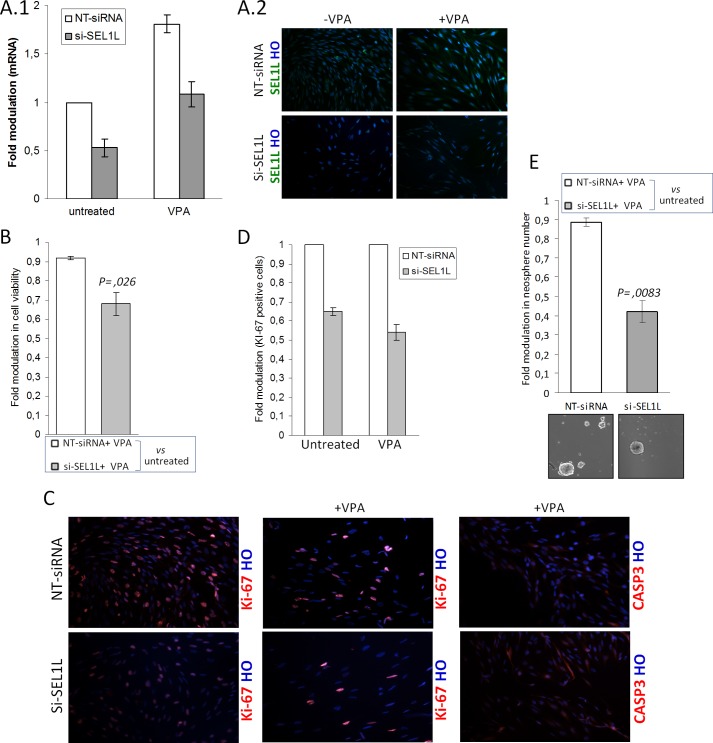
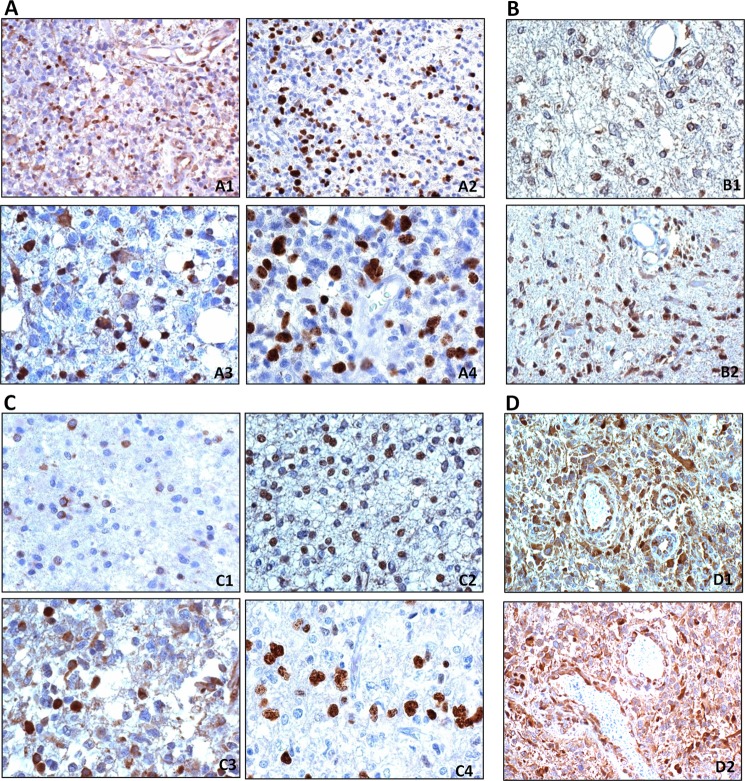
Valproic acid (VPA), an histone deacetylase inhibitor, is emerging as a promising therapeutic agent for the treatments of gliomas by virtue of its ability to reactivate the expression of epigenetically silenced genes. VPA induces the unfolded protein response (UPR), an adaptive pathway displaying a dichotomic yin yang characteristic; it initially contributes in safeguarding the malignant cell survival, whereas long-lasting activation favors a proapoptotic response. By triggering UPR, VPA might tip the balance between cellular adaptation and programmed cell death via the deregulation of protein homeostasis and induction of proteotoxicity. Here we aimed to investigate the impact of proteostasis on glioma stem cells (GSC) using VPA treatment combined with subversion of SEL1L, a crucial protein involved in homeostatic pathways, cancer aggressiveness, and stem cell state maintenance. We investigated the global expression of GSC lines untreated and treated with VPA, SEL1L interference, and GSC line response to VPA treatment by analyzing cell viability via MTT assay, neurosphere formation, and endoplasmic reticulum stress/UPR-responsive proteins. Moreover, SEL1L immunohistochemistry was performed on primary glial tumors. The results show that (i) VPA affects GSC lines viability and anchorage-dependent growth by inducing differentiative programs and cell cycle progression, (ii) SEL1L down-modulation synergy enhances VPA cytotoxic effects by influencing GSCs proliferation and self-renewal properties, and (iii) SEL1L expression is indicative of glioma proliferation rate, malignancy, and endoplasmic reticulum stress statuses. Targeting the proteostasis network in association to VPA treatment may provide an alternative approach to deplete GSC and improve glioma treatments.

Keywords: Brain Tumors; Cancer Stem Cells; Cell Proliferation; Drug Resistance; Histone Deacetylase.


Figures

FIGURE 1.
FIGURE 1.
SEL1L follows ER stress and stemness markers expression in GSC lines. A, SEL1L expression in GSC lines was analyzed by qPCR. The histogram indicates expression values normalized relative to housekeeping signals and expressed as -fold modulation relative to G166. B, Western blot analysis of SEL1L protein level in GSC lines. Lysates (50 μg) were resolved by SDS-PAGE and probed with SEL1L antibody. Vinculin was used as a loading control. The histogram shows expression values normalized relative to housekeeping signals and expressed as -fold modulation relative to G166. C, ER stress and stemness markers were analyzed by qPCR. The histogram shows expression values normalized relative to housekeeping gene and data expressed as -fold modulation relative to G166 cell line.
FIGURE 2.
FIGURE 2.
The effects of SEL1L silencing in G179 line. A, 1 and 2, SEL1L mRNA and protein silencing efficiency. G179 cell line (1 × 10⁶) was nucleofected with 1 NT siRNA or 2 si-SEL1L for 48 h, and silencing efficiency was verified by mRNA using qPCR (1) and protein using Western blot (1) and immunofluorescence staining (2). A1, the histogram shows values normalized relative to housekeeping signals and expressed as-fold modulation relative to controls. The data reflect the average of two si-SEL1L and two independent knockdown experiments. B–E, G179 were treated with NT siRNA or two si-SEL1L for 48 h, harvested and analyzed for the following. B, trypan blue exclusion test. The histogram shows the averages of three independent experiments. Student's t test (p) was used to determine statistical significance. C, neurosphere assay. Cells were plated in six low attached wells (3000 cells/well) and maintained in neurosphere cell conditions for 10 days. The figure is a representative image of three independent experiments. D, qPCR analysis of si-SEL1L-mediated depletion determined a decrease in NOTCH1 expression but a parallel increase in TUBB3 levels. BIP, CHOP, and HRD1 as well as SOX2 and GFAP expression were unchanged after SEL1L depletion. The histogram shows expression values of treated cells normalized relative to housekeeping signals and expressed as -fold modulation relative to untreated samples. E, immunofluorescent analysis. A strong increase of TUBB3 immunoreactivity was observed in si-SEL1L cells with respect to controls. Nestin, SOX2, GFAP, O4, and Hoechst (HO) remained unchanged.
FIGURE 3.
FIGURE 3.
The effect of VPA on SEL1L and UPR expression. A, SEL1L expression in G179 exposed to VPA treatment was evaluated by qPCR and Western blot analysis in a time course experiment. The histograms shows expression values normalized relative to housekeeping signals and are expressed as -fold modulation relative to untreated G179. B, SEL1L protein levels in G166 exposed to VPA were evaluated by Western blot analysis. The histogram shows expression values normalized relative to housekeeping signals and are expressed as -fold modulation relative to untreated G166. C, SEL1L expression in GSC lines exposed to VPA was analyzed by qPCR. The histogram shows expression values normalized relative to housekeeping signals and are expressed as -fold modulation relative to untreated cells. D, UPR activation in GSC lines exposed to VPA was analyzed by qPCR. The histogram shows expression values normalized relative to housekeeping signals and are expressed as -fold modulation relative to untreated controls.
FIGURE 4.
FIGURE 4.
VPA affects phenotypic and molecular characteristics of GSC lines. A, an MTT assay was applied to evaluate the viability of GSC lines after VPA treatment. The histogram shows cell viability values expressed as -fold modulation relative to untreated samples. p was used to determine statistical significance. B, pPCR of GBM2 VPA-treated. GBM2 were exposed to VPA treatment and analyzed for genes expression using qPCR. The histogram shows expression values of VPA-treated cells normalized relative to the housekeeping gene and are expressed as -fold modulation relative to untreated cell line. C and D, representative images of GSC lines plated on laminin-coated flasks (C) or maintained in neurosphere conditions (D) in the absence or presence of VPA. E, GSC lines (800 cells/well-6) were exposed to VPA and assayed for colony formation. The drug was replaced with fresh growth medium, and cells were allowed to form colonies for a further 12 days. Colonies were stained with Giemsa. The images are representative of three independent treatments. F, a Venn diagram shows the number of overlapping genes differentially expressed in VPA-treated GSC lines. G, UPR and a proteasome heat map in VPA-treated and untreated GSC lines.
FIGURE 5.
FIGURE 5.
Array validation. Box plots of gene expression levels of selected genes in VPA-treated and untreated GSC line (A and B) and qPCR of the same genes (C).
FIGURE 6.
FIGURE 6.
Effects of si-SEL1L and VPA combined treatments in G179. A, 1 and 2, SEL1L mRNA and protein silencing efficiency after VPA treatment. G179 cell line (1 × 10⁶) was nucleofected with NT siRNA or two si-SEL1L for 48 h and maintained in the absence or presence of VPA for an additional 4 days. The data reflect the average of two si-SEL1L and two independent knockdown experiments. Silencing efficiency was verified by mRNA using qPCR (1) and protein using immunofluorescent staining (2). 1, the histogram shows values normalized relative to housekeeping signals and are expressed as -fold modulation relative to controls. HO, Hoechst. B–E, the G179 was treated with NT siRNA or si-SEL1L for 48 h and analyzed as follows. B, MTT cell viability assay. Nucleofected cells were seeded in 96-well plates at a density of 2000. After 24 h, cells were treated with VPA and analyzed for viability. The histogram shows cell viability values expressed as -fold modulation relative to drug-treated (VPA) versus untreated samples. p was used to determine statistical significance. C, Immunofluorescence analysis. Nucleofected cells were seeded on 12-well cover glass and maintained in the absence or presence of VPA for 4 days. A decrease in the number of positive Ki-67 cells was observed in si-SEL1L G179s with respect to control either in the absence or presence of VPA. Scattered areas with faint CASP3 immunoreactivity were observed in treated si-SEL1L G179 cells. D, Ki-67 was evaluated in terms of % of positively stained nuclei counted in at least 800 cells per group. E, Neurosphere assay. Nucleofected cells were seeded in 6 low attachment plates wells at density of 3000 and maintained in neurosphere cell conditions in the absence or presence of VPA for 4 days. Then the culture was allowed to recover from drug treatment by adding fresh medium in excess for an additional 7 days. The figure is a representative image of three independent experiment. p was is used to determine statistical significance.
FIGURE 7.
FIGURE 7.
Immunohistochemistry of SEL1L in gliomas. A, glioblastoma. A1, SEL1L-positive cells are mainly seen in the nucleus of proliferating area. A2, the parallel section was stained for Ki-67/MIB.1, DAB, 200×; A3, cells with SEL1L nuclear and cytoplasmic expression distributed as Ki-67/MIB.1-positive nuclei (A4). DAB, 400×. B, astrocytoma. B1, in diffuse WHO grade II astrocytoma, SEL1L cytoplasmic and perinuclear expression is very low; B2, WHO grade III astrocytoma show higher numbers of nuclei-positive SEL1L cells. DAB, 400×. C, oligodendroglioma. C1, WHO grade II oligodendroglioma, variable SEL1L nuclear, perinuclear, and cytoplasmic expression; the distribution of the most intense nuclei parallels (C2) that of Ki-67/MIB.1-positive nuclei; C3, WHO grade III oligodendroglioma, high frequency of SEL1L-positive nuclei show the same distribution as those positive for Ki-67/MIB.1 (C4). DAB, 400×. D, tumor vessels. D1 and D2, SEL1L-positive staining in the cytoplasm of hypertrophic endothelial cells. DAB, 200×.

References

    1. Baylin S. B., Ohm J. E. (2006) Epigenetic gene silencing in cancer. A mechanism for early oncogenic pathway addiction? Nat. Rev. Cancer 6, 107–116 - PubMed
    1. Walkinshaw D. R., Yang X. J. (2008) Histone deacetylase inhibitors as novel anticancer therapeutics. Curr. Oncol. 15, 237–243 - PMC - PubMed
    1. Sun P., Xia S., Lal B., Eberhart C. G., Quinones-Hinojosa A., Maciaczyk J., Matsui W., Dimeco F., Piccirillo S. M., Vescovi A. L., Laterra J. (2009) DNER, an epigenetically modulated gene, regulates glioblastoma. Derived neurosphere cell differentiation and tumor propagation. Stem Cells 27, 1473–1486 - PMC - PubMed
    1. Das C. M., Aguilera D., Vasquez H, Prasad P, Zhang M, Wolff JE, Gopalakrishnan V. (2007) Valproic acid induces p21 and topoisomerase-II (α/β) expression and synergistically enhances etoposide cytotoxicity in human glioblastoma cell lines. J. Neurooncol. 85, 159–170 - PubMed
    1. Mottet D., Castronovo V. (2008) Histone deacetylases. Target enzymes for cancer therapy. Clin. Exp. Metastasis 25, 183–189 - PubMed

Publication types

MeSH terms