

Dose-response relationship of physical activity to premature and total all-cause and cardiovascular disease mortality in walkers
- PMID: 24312170
- PMCID: PMC3843666
- DOI: 10.1371/journal.pone.0078777
Dose-response relationship of physical activity to premature and total all-cause and cardiovascular disease mortality in walkers
Abstract
Purpose: To assess the dose-response relationships between cause-specific mortality and exercise energy expenditure in a prospective epidemiological cohort of walkers.
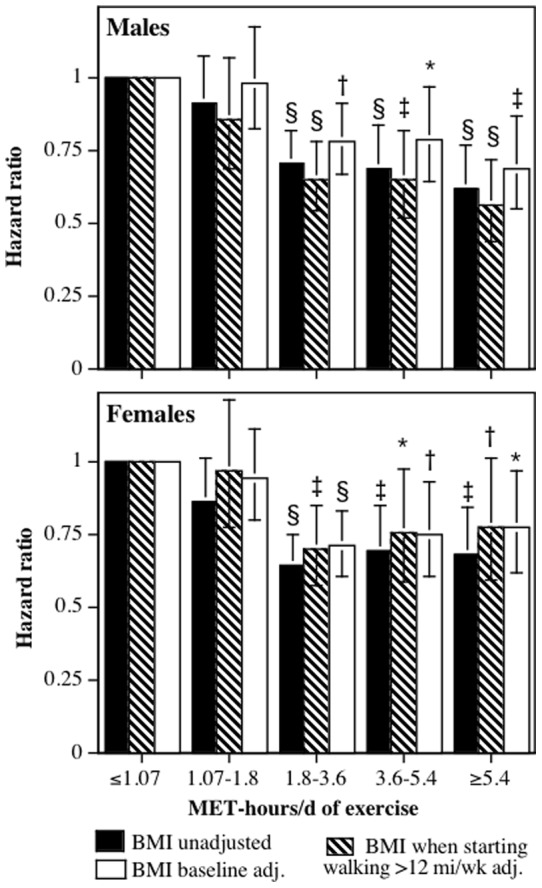
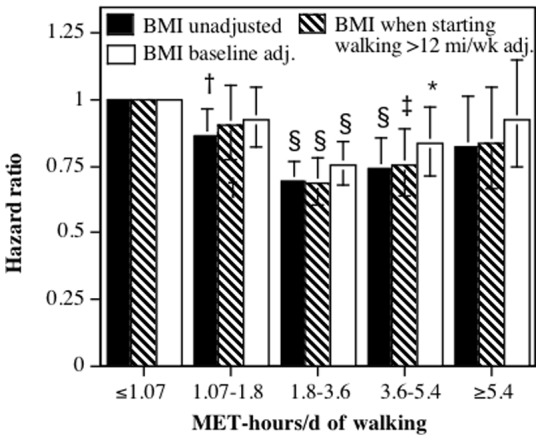
Methods: The sample consisted of the 8,436 male and 33,586 female participants of the National Walkers' Health Study. Walking energy expenditure was calculated in metabolic equivalents (METs, 1 MET = 3.5 ml O2/kg/min), which were used to divide the cohort into four exercise categories: category 1 (≤ 1.07 MET-hours/d), category 2 (1.07 to 1.8 MET-hours/d), category 3 (1.8 to 3.6 MET-hours/d), and category 4 (≥ 3.6 MET-hours/d). Competing risk regression analyses were use to calculate the risk of mortality for categories 2, 3 and 4 relative to category 1.
Results: 22.9% of the subjects were in category 1, 16.1% in category 2, 33.3% in category 3, and 27.7% in category 4. There were 2,448 deaths during the 9.6 average years of follow-up. Total mortality was 11.2% lower in category 2 (P = 0.04), 32.4% lower in category 3 (P<10(-12)) and 32.9% lower in category 4 (P = 10(-11)) than in category 1. For underlying causes of death, the respective risk reductions for categories 2, 3 and 4 were 23.6% (P = 0.008), 35.2% (P<10(-5)), and 34.9% (P = 0.0001) for cardiovascular disease mortality; 27.8% (P = 0.18), 20.6% (P = 0.07), and 31.4% (P = 0.009) for ischemic heart disease mortality; and 39.4% (P = 0.18), 63.8% (P = 0.005), and 90.6% (P = 0.002) for diabetes mortality when compared to category 1. For all related mortality (i.e., underlying and contributing causes of death combined), the respective risk reductions for categories 2, 3 and 4 were 18.7% (P = 0.22), 42.5% (P = 0.001), and 57.5% (P = 0.0001) for heart failure; 9.4% (P = 0.56), 44.3% (P = 0.0004), and 33.5% (P = 0.02) for hypertensive diseases; 11.5% (P = 0.38), 41.0% (P<10(-4)), and 35.5% (P = 0.001) for dysrhythmias: and 23.2% (P = 0.13), 45.8% (P = 0.0002), and 41.1% (P = 0.005) for cerebrovascular diseases when compared to category 1.
Conclusions: There are substantial health benefits to exceeding the current exercise guidelines.
Conflict of interest statement
Figures
References
-
- Physical Activity Guidelines Advisory Committee (2008) Physical Activity Guidelines Advisory Committee Report, 2008. Washington, DC: U.S. Department of Health and Human Services 2008: A1–H14.
-
- Nelson ME, Rejeski WJ, Blair SN, Duncan PW, Judge JO, et al. (2007) Physical activity and public health in older adults: recommendation from the American College of Sports Medicine and the American Heart Association. Circulation. 116: 1094–105. - PubMed
-
- Pate RR, Pratt M, Blair SN Haskell WL, Macera CA, et al. (1995) Physical activity and public health. A recommendation from the Centers for Disease Control and Prevention and the American College of Sports Medicine. JAMA. 273: 402–7. - PubMed
-
- Haskell WL, Lee IM, Pate RR, Powell KE, Blair SN, et al. (2007) Physical activity and public health: updated recommendation for adults from the American College of Sports Medicine and the American Heart Association. Med Sci Sports Exerc 39: 1423–34. - PubMed
-
- Ainsworth BE, Haskell WL, Whitt MC, Irwin ML, Swartz AM, et al. (2000) Compendium of physical activities: an update of activity codes and MET intensities. Med Sci Sports Exerc. 32: S498–504. - PubMed
Publication types
MeSH terms
Grants and funding
LinkOut - more resources
Full Text Sources
Other Literature Sources
Medical
Miscellaneous
