. 2013 Nov 27;8(11):e80244.
doi: 10.1371/journal.pone.0080244. eCollection 2013.

A new methodology for studying dynamics of aerosol particles in sneeze and cough using a digital high-vision, high-speed video system and vector analyses

Affiliations

A new methodology for studying dynamics of aerosol particles in sneeze and cough using a digital high-vision, high-speed video system and vector analyses

Hidekazu Nishimura et al. PLoS One. .

Abstract

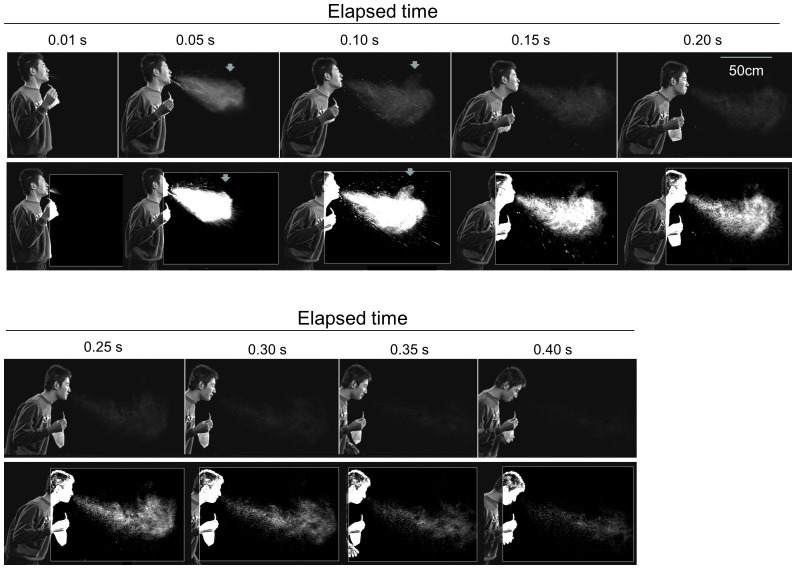
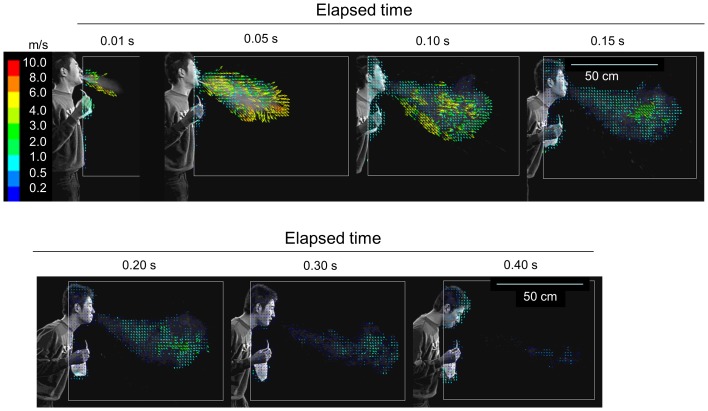
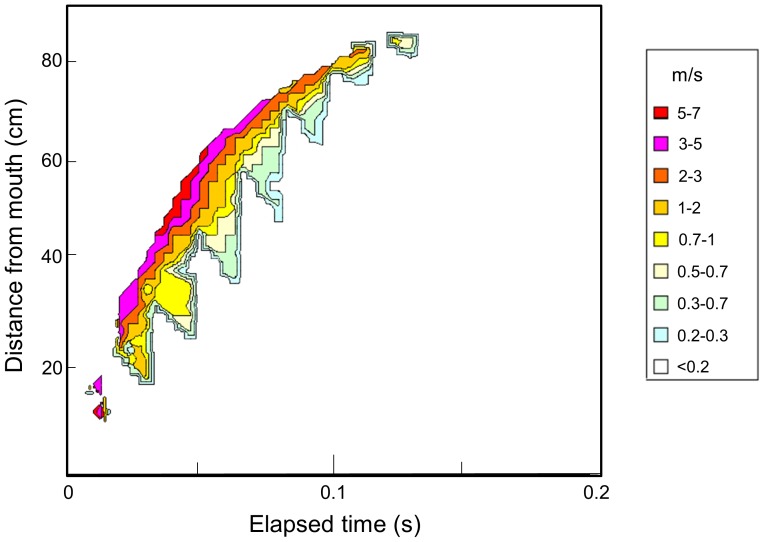
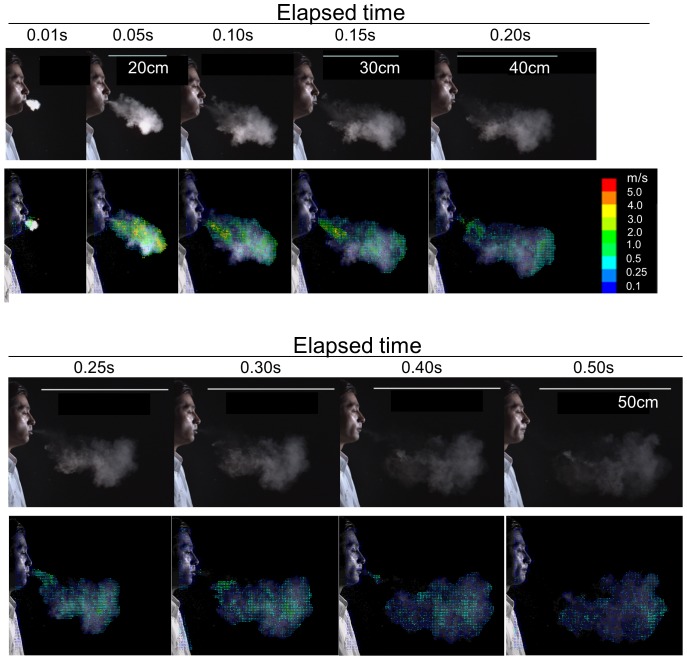
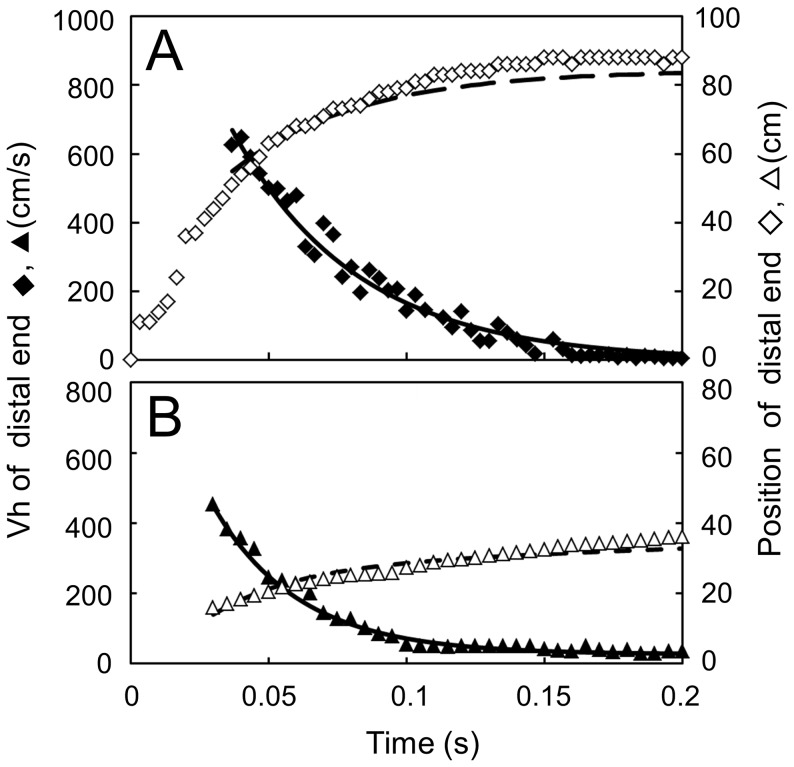
Microbial pathogens of respiratory infectious diseases are often transmitted through particles in sneeze and cough. Therefore, understanding the particle movement is important for infection control. Images of a sneeze induced by nasal cavity stimulation by healthy adult volunteers, were taken by a digital high-vision, high-speed video system equipped with a computer system and treated as a research model. The obtained images were enhanced electronically, converted to digital images every 1/300 s, and subjected to vector analysis of the bioparticles contained in the whole sneeze cloud using automatic image processing software. The initial velocity of the particles or their clusters in the sneeze was greater than 6 m/s, but decreased as the particles moved forward; the momentums of the particles seemed to be lost by 0.15-0.20 s and started a diffusion movement. An approximate equation of a function of elapsed time for their velocity was obtained from the vector analysis to represent the dynamics of the front-line particles. This methodology was also applied for a cough. Microclouds contained in a smoke exhaled with a voluntary cough by a volunteer after smoking one breath of cigarette, were traced as the visible, aerodynamic surrogates for invisible bioparticles of cough. The smoke cough microclouds had an initial velocity greater than 5 m/s. The fastest microclouds were located at the forefront of cloud mass that moving forward; however, their velocity clearly decreased after 0.05 s and they began to diffuse in the environmental airflow. The maximum direct reaches of the particles and microclouds driven by sneezing and coughing unaffected by environmental airflows were estimated by calculations using the obtained equations to be about 84 cm and 30 cm from the mouth, respectively, both achieved in about 0.2 s, suggesting that data relating to the dynamics of sneeze and cough became available by calculation.


Conflict of interest statement

Competing Interests: Among authors, HN and AK have no competing interests as have declared in the Competing Interest section. SS is an employee of a company; Takasago Thermal Engineering Co., Ltd., Tokyo, as was pointed out. He works mainly for basics of airflow which does not link directly to the patent or products development, and this does not alter the authors' adherence to all the PLOS ONE policies on sharing data and materials.

Figures

Figure 1
Figure 1. Serial photographs of a sneeze extracted from the video image.
Original (upper rows) and enhanced (lower rows) images of the sneeze of a healthy adult male volunteer. The photographs were extracted from the video image recorded by a digital high-vision, high-speed video system at 0.01 s and every 0.05 sec. The mist of the sneeze advanced forward as a mass, associated with gradual diffusion and fading followed by disappearance. A part of the mist cloud looked swirled in the peripheral area (arrows).
Figure 2
Figure 2. Vector analysis of particles movement in the sneeze.
The video image was converted to digital images collected every 1/300 s. Each brightness pattern of the aerosol particles or particle clusters, recognized as a particular granular signal, was automatically traced during 1/300 s using image processing software. The vectors are color graduated according to their velocity levels.
Figure 3
Figure 3. Velocity distribution of particles moving forward as a mass in the sneeze.
Information on the position and horizontal velocity of each particle/particle cluster was extracted from the results of the vector analysis of the sneeze and is plotted along with the elapsing time on a two-dimensional graph. The velocity levels are expressed by color graduation.
Figure 4
Figure 4. Image of cough movement represented by smoke cough.
Image analysis of the cough of a smoker healthy adult male volunteer after one breath of smoke. The image of the natural cough was substituted with that of cigarette smoke used as the tracing marker. The photographs were extracted from the video image using a digital high-vision, high-speed video system (upper rows). Vector analysis was performed on the microcloud identified with various densities of white tones of the smoke (lower rows), as it was done for the particles/particle clusters of sneeze.
Figure 5
Figure 5. Position and velocity of particles at the distal margin of the sneeze and cough.
Measured maximum horizontal velocity Vh (♦,▴) and its position: horizontal distance h, from the mouth (,△) of the sneeze (A) and cough (B). Values for Vh (solid line) calculated from the approximate equations for the sneeze (I) and for the cough (II), and their relative positions acquired by integration of Vh (dotted line) with respect to the elapsed time t after release.

Similar articles

Cited by

References

    1. Jennison MW (1942) Atomizing of mouth and nose secretions into the air as revealed by high-speed photography. In: Moulton F R, editor. Aerobiology. Washington, D. C: American Association for the Advancement of Science. pp. 106–128.
    1. Zhu S, Kato S, Yang J-H (2006) Study on transport characteristics of saliva droplets produced by coughing in a calm indoor environment. Build Environ 41: 1691–1702.
    1. Tang JW, Liebner TJ, Craven BA, Settles GS (2009) A schlieren optical study of the human cough with and without wearing masks for aerosol infection control. J. R. Soc. Interface 6: S727–S736. - PMC - PubMed
    1. Kwon SB, Park J, Jang J, Cho Y, Park DS, et al. (2012) Study on the initial velocity distribution of exhaled air from coughing and speaking. Chemosphere 87: 1260–1264. - PMC - PubMed
    1. Chao CYH, Wan MP, Morawska L, Johnson GR, Ristovski ZD, et al. (2009) Characterization of expiration air jets and droplet size distributions immediately at the mouth opening. J Aerosol Sci 40: 122–133. - PMC - PubMed

Publication types