. 2013 Nov 27;8(11):e80423.
doi: 10.1371/journal.pone.0080423. eCollection 2013.

A novel pulse-chase SILAC strategy measures changes in protein decay and synthesis rates induced by perturbation of proteostasis with an Hsp90 inhibitor

Affiliations

A novel pulse-chase SILAC strategy measures changes in protein decay and synthesis rates induced by perturbation of proteostasis with an Hsp90 inhibitor

Ivo Fierro-Monti et al. PLoS One. .

Abstract

Standard proteomics methods allow the relative quantitation of levels of thousands of proteins in two or more samples. While such methods are invaluable for defining the variations in protein concentrations which follow the perturbation of a biological system, they do not offer information on the mechanisms underlying such changes. Expanding on previous work [1], we developed a pulse-chase (pc) variant of SILAC (stable isotope labeling by amino acids in cell culture). pcSILAC can quantitate in one experiment and for two conditions the relative levels of proteins newly synthesized in a given time as well as the relative levels of remaining preexisting proteins. We validated the method studying the drug-mediated inhibition of the Hsp90 molecular chaperone, which is known to lead to increased synthesis of stress response proteins as well as the increased decay of Hsp90 "clients". We showed that pcSILAC can give information on changes in global cellular proteostasis induced by treatment with the inhibitor, which are normally not captured by standard relative quantitation techniques. Furthermore, we have developed a mathematical model and computational framework that uses pcSILAC data to determine degradation constants kd and synthesis rates Vs for proteins in both control and drug-treated cells. The results show that Hsp90 inhibition induced a generalized slowdown of protein synthesis and an increase in protein decay. Treatment with the inhibitor also resulted in widespread protein-specific changes in relative synthesis rates, together with variations in protein decay rates. The latter were more restricted to individual proteins or protein families than the variations in synthesis. Our results establish pcSILAC as a viable workflow for the mechanistic dissection of changes in the proteome which follow perturbations. Data are available via ProteomeXchange with identifier PXD000538.


Conflict of interest statement

Competing Interests: The authors have declared that no competing interests exist.

Figures

Figure 1
Figure 1. Labeling, measurable parameters and data obtained from pcSILAC experiments.
A) Protein labeling scheme for pcSILAC experiments. Two cell cultures were fully labelled only on Arg residues before cell treatments. For example, cells to be treated later with HSP90 inhibitor were fully labelled with 13C6 15N4-L-arginine (R10/K0) (“heavy” cells) while cells to be used as control were fully labelled with 13C6-L-arginine (R6/KO) (“medium” cells). At the start of the experiment, “heavy” cells were transferred into a medium containing light R (R0) and “heavy” K (13C6 15N2-L-Lys, referred to as R0/K8 medium), while “medium” cells were transferred to a medium containing light R (R0) and “medium” K (2H4-L-lysine, referred to as R0/K4 medium). GA or DMSO as a control were added either simultaneously or later, depending on the experiment. Cells were harvested and lysed at various time points to produce extracts that were mixed before analysis. B) Conceptual view of the levels of a hypothetical protein in a mixture of two (control and treated) pcSILAC-labeled samples. Pre-existing protein is fully labeled R6/K0 and R10/K0 (light and dark brown), respectively for the control and treated sample. Newly synthesized protein is labeled R0/K4 (control, pink) and R0/K8 (treated, blue). The SILAC (H/M) ratios for R- and K-containing peptides therefore measure the ratios of preexisting and newly synthesized proteins at time t. C) examples of pcSILAC spectra for peptides from the tyrosine kinase LCK (left, peptide IPYPGMTNPEVIQNLER at t = 6h, z = 2) and the chaperone DNAJB1 ( = Hsp40) (right, peptide EGDQTSNNIPADIVFVLK at t = 20h, z = 2).
Figure 2
Figure 2. Raw and normalized (H/M)K, (H/M)R ratios measured in pcSILAC experiments.
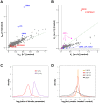
A),B) Scatter plots of global ratios of pre-existing protein ((H/M)R) and newly synthesized protein ((H/M)K) after correction for mixing ratio and normalization around the median. Values shown are for pcSILAC experiment 1 (average of two replicates) at t = 6h (A) and t = 20h (B). Reference (red) and other proteins discussed in the text (blue) are indicated. C) Evolution in time after start of GA treatment of normalized ratios of total protein (stSILAC, blue), newly synthesized proteins ((H/M)K, green) and pre-existing protein ((H/M)R, red). Data points refer to values at t = 6,12,20h after addition of GA (t = 0). pcSILAC ratios were normalized (i.e. centered around population median) to facilitate comparison with changes in total protein levels. Fitting of the values for DNAJB1 to the model was very poor due to its complex behavior, therefore decay and synthesis rates could not be calculated for this early induced protein. D) Box plots (experiment 1) of global log2(H/M)K and log2(H/M)R ratios after mixing ratio correction but before normalization E) same as D), but values are shown after correction for mixing ratio and normalization.
Figure 3
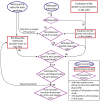
Figure 3. Computational workflow for the determination of kinetic parameters kd and VB/VA from pcSILAC data.
The individual steps of the computational workflow are described in detail in the supplementary information S1. Briefly, (1) using the total peak intensities (similar to iBAQ scores), the global mixing ratio between both samples is computed. (2) The equations describing the evolution of the protein concentrations in the cells are converted into equations describing the evolution of the protein abundances using the mixing ratio values. (3) These equations can then be used for a global fit of the experimental data for multiple proteins at the same time. (4) The global fit results in estimates for the coefficients describing the peptide cleavage rates (or efficiencies) - these coefficients are then set to be identical for all protein species. (5) The estimates of the cleavage efficiencies are inserted into the model describing the evolution of protein abundances in the samples; the experimental data from each protein species can then be fitted, for each protein species independently. (6) Instead of directly doing these fits to the experimental data, some random artificial noise is added through a bootstrap-like method - this increases the confidence in the results (as noise cannot be avoided in the experimental measurements, and we repeat the fit with various simulated noise values to compare the outcomes). (7) The fit of the model to the bootstrapped data results in one set of estimates of synthesis and degradation rate constants for the normal and drug-treated conditions for each protein. (8) The final estimates are the average values from the different estimates that were obtained by repeating the fitting step multiple times with different bootstrapped data values for each protein species.
Figure 4
Figure 4. Results from calculations of decay constants, synthesis rates and evolution of total protein levels.
Indexes of variables are A (as in kA, VA) for control (+DMSO) and B (as in kB, VB) for treated (+GA) cells. A) Scatter plot of the values of the degradation constants for the control and treated sample (experiment 2, 911 proteins). The position of reference proteins is indicated. The dashed line indicates a 1:1 relationship B) Scatter plot of VA and VB (same dataset as A). Other heat shock proteins are shown in pink. The dashed line indicates a 1:1 relationship C) Kernel density estimate of log2 of ratios of synthesis rates (VB/VA) and degradation constants (kB,d/kA,d) after correction for cell growth. D) Comparison of distributions of log2 of ratios S of net protein levels (treated/control) calculated from pcSILAC data at t = 6, 12, 20h vs. ratios at steady-state (t = infinite) calculated from the model. S values were corrected for mixing inequalities.
Figure 5
Figure 5. Changes in degradation and synthesis rates induced by Hsp90 inhibition and relationship with changes in net total protein levels and protein families.
Indexes of variables are A (as in kA, VA) for control (+DMSO) and B (as in kB, VB) for treated (+GA) cells. A) Scatter plot of the values of ratios of intrinsic degradation constants kB,d/kA,d vs. the ratios of synthesis rates VB/VA. The median values of kB,d/kA,d and VB/VA for the population are indicated with dashed lines. Coloring of points is according to the calculated treated /control total protein ratio at t = 20h (ratio S). B) Same as A) but with coloring of ribosomal, proteasome and heat shock proteins. Groups I and II are discussed in the main text. All values are log2.
Figure 6
Figure 6. Changes in degradation and synthesis rates in subsets of net decreasing, invariant and increasing proteins.
Indexes of variables are A (as in kA, VA) for control (+DMSO) and B (as in kA, VA) for treated (+GA) cells. Probability density functions of decay constant ratios kB,d/kA,d (A) and synthesis rate ratios VB/VA. (B) are shown for the 10% most strongly increased proteins, the 10% most strongly decreased proteins and a 20% of proteins which were around the median of the concentration change (invariant proteins). The ratio of protein levels at steady-state (pB/pA parameter) was used for the selection.

References

    1. Selbach M, Schwanhäusser B, Thierfelder N, Fang Z, Khanin R, et al. (2008) Widespread changes in protein synthesis induced by microRNAs. Nature 455: 58–63 10.1038/nature07228 - DOI - PubMed
    1. Conaway JW (2012) Introduction to theme “Chromatin, epigenetics, and transcription”. Annu Rev Biochem 81: 61–64 10.1146/annurev-biochem-090711-093103 - DOI - PubMed
    1. Rabani M, Levin JZ, Fan L, Adiconis X, Raychowdhury R, et al. (2011) Metabolic labeling of RNA uncovers principles of RNA production and degradation dynamics in mammalian cells. Nat Biotechnol 29: 436–442 10.1038/nbt.1861 - DOI - PMC - PubMed
    1. Jackson RJ, Hellen CUT, Pestova TV (2010) The mechanism of eukaryotic translation initiation and principles of its regulation. Nat Rev Mol Cell Biol 11: 113–127 10.1038/nrm2838 - DOI - PMC - PubMed
    1. Gingold H, Pilpel Y (2011) Determinants of translation efficiency and accuracy. Mol Syst Biol 7: 481 10.1038/msb.2011.14 - DOI - PMC - PubMed

Publication types

Substances

LinkOut - more resources