. 2013 Nov 27;8(11):e80481.
doi: 10.1371/journal.pone.0080481. eCollection 2013.

Estimating influenza deaths in Canada, 1992-2009

Affiliations

Estimating influenza deaths in Canada, 1992-2009

Dena L Schanzer et al. PLoS One. .

Abstract

Background: Poisson regression modelling has been widely used to estimate the disease burden attributable to influenza, though not without concerns that some of the excess burden could be due to other causes. This study aims to provide annual estimates of the mortality and hospitalization burden attributable to both seasonal influenza and the 2009 A/H1N1 pandemic influenza for Canada, and to discuss issues related to the reliability of these estimates.

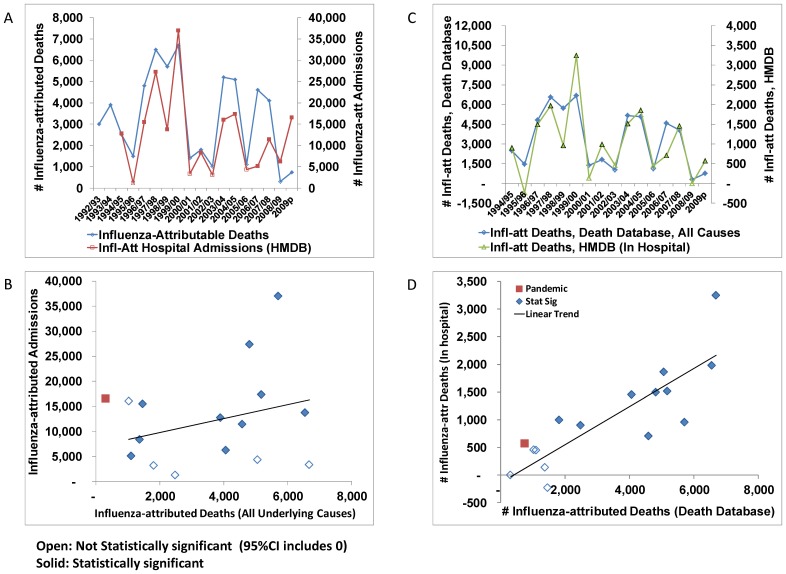
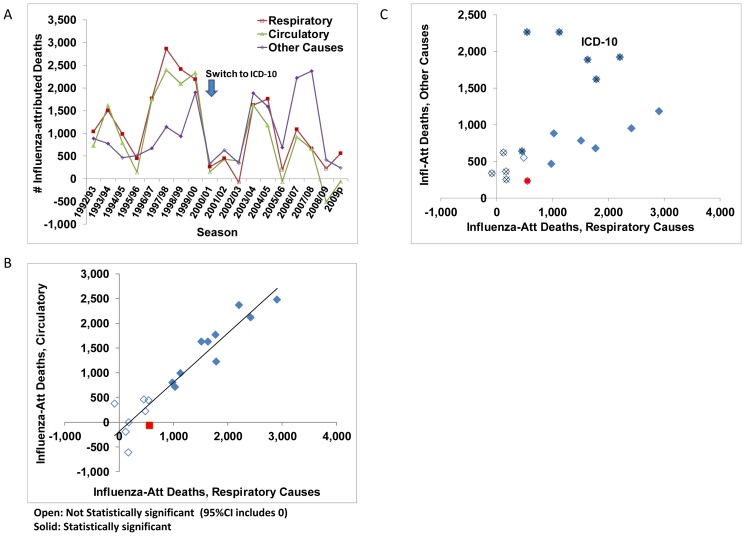
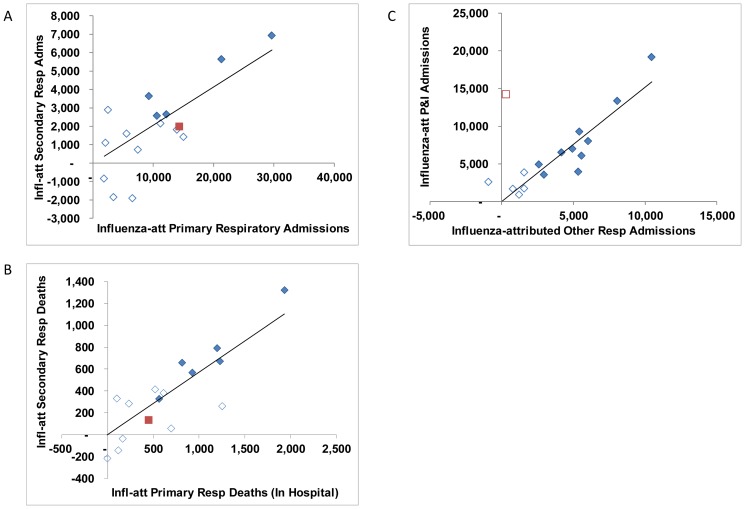
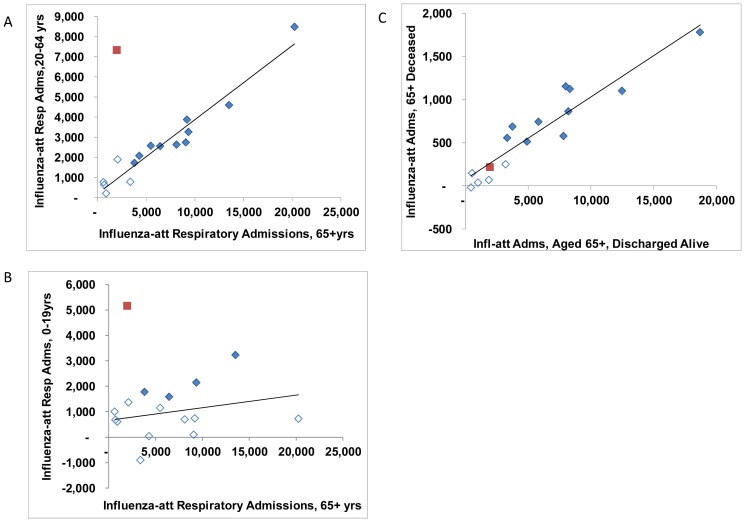
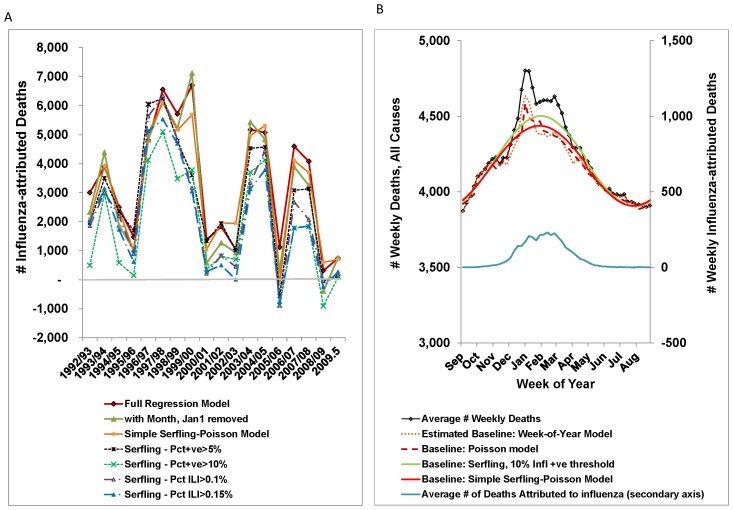
Methods: Weekly time-series for all-cause mortality and regression models were used to estimate the number of deaths in Canada attributable to influenza from September 1992 to December 2009. To assess their robustness, the annual estimates derived from different parameterizations of the regression model for all-cause mortality were compared. In addition, the association between the annual estimates for mortality and hospitalization by age group, underlying cause of death or primary reason for admission and discharge status is discussed.

Results: The crude influenza-attributed mortality rate based on all-cause mortality and averaged over 17 influenza seasons prior to the 2009 A/H1N1 pandemic was 11.3 (95%CI, 10.5 - 12.1) deaths per 100 000 population per year, or an average of 3,500 (95%CI, 3,200 - 3,700) deaths per year attributable to seasonal influenza. The estimated annual rates ranged from undetectable at the ecological level to more than 6000 deaths per year over the three A/Sydney seasons. In comparison, we attributed an estimated 740 deaths (95%CI, 350-1500) to A(H1N1)pdm09. Annual estimates from different model parameterizations were strongly correlated, as were estimates for mortality and morbidity; the higher A(H1N1)pdm09 burden in younger age groups was the most notable exception.

Interpretation: With the exception of some of the Serfling models, differences in the ecological estimates of the disease burden attributable to influenza were small in comparison to the variation in disease burden from one season to another.


Conflict of interest statement

Competing Interests: The authors have declared that no competing interests exist.

Figures

Figure 1
Figure 1. Comparison of annual estimates of deaths and hospital admissions attributable to influenza.
Annual estimates of the number of deaths and hospital admissions attributable to influenza are shown as a) an annual time-series with the influenza season identified on the x-axis and b) as a scatter graph of influenza-attributable deaths (x-axis) by hospital admissions (y-axis) with a linear trend identified by the solid black line. Open symbols indicate that the estimate was not statistically significant (95% CI includes 0). In the scatter graph, the A(H1N1)pdm09 estimates are indicated with a red square. c) Annual estimates of influenza-attributed deaths from the death and hospitalization databases are compared in time-series format and d) scatter graph format.
Figure 2
Figure 2. Comparison of the annual estimates of the number of deaths attributable to influenza by underlying cause of death (respiratory, circulatory, and other causes).
a) Annual time-series with influenza season identified on the x-axis. b) Scatter graph with a linear trend shown in solid black. Annual estimates based on respiratory and circulatory underlying causes are highly correlated, while in c) a comparison of respiratory to other causes shows a significant change with the conversion from ICD-9 to ICD-10 (denoted by an x). Open symbols indicate that the estimate was not statistically significant (95% CI includes 0). The A(H1N1)pdm09 estimates are indicated with a red square.
Figure 3
Figure 3. Comparison of annual estimates of the number of hospital admissions attributable to influenza by reason for admission.
Open symbols indicate that the estimate was not statistically significant (95% CI includes 0). The A(H1N1)pdm09 estimates are indicated with a red square. A linear trend line is shown in solid black.
Figure 4
Figure 4. Comparison of annual estimates of the number of admissions attributable to influenza by age groups.
Annual estimates of influenza-attributed respiratory admissions for a) the 65+ age group versus 20–64 years age group; b) the 65+ age group versus 0–19 years age group; and c) by discharge status. Open symbols indicate that the estimate was not statistically significant (95% CI includes 0). The A(H1N1)pdm09 estimates are plotted with a red square. A linear trend line is shown in solid black.
Figure 5
Figure 5. Sensitivity Analysis of selected models to estimate the mortality burden attributable to influenza.
a) Poisson regression and Serfling model estimates of influenza-attributable deaths by influenza season. Three parameterizations of the Poisson regression model are shown in solid lines and 4 choices of thresholds for periods of influenza activity for the Serfling model are shown with dashed lines. Serfling models use regression to estimate a cyclical baseline, but exclude weeks with influenza activity. b) Average Number of Deaths (all cause) by Week with the Estimated Baselines for Selected Models. Despite an additional 150–200 deaths occurring in week 1, the averages of the weekly baseline for the full model (dashed line) and the Simple Serfling-like Poisson model (solid red) for January through mid-March were similar. Use of 53 indicator variables – 1 for each week of the year to account for seasonality resulted in a similar weekly baseline (dotted line). The Serfling baseline for a 10% influenza positive threshold is shown in green. The average weekly number of deaths attributed to influenza is shown on the secondary y-axis.

References

    1. Thompson WW, Ridenhour BL, Barile JP, Shay DK (2012) Time-series analyses of count data to estimate the burden of seasonal infectious diseases. Epidemiology 23: 839–842. - PubMed
    1. World Health Organization (2009) Comparing deaths from pandemic and seasonal influenza: Pandemic (H1N1) 2009 briefing note 20. Available: http://www.who.int/csr/disease/swineflu/notes/briefing_20091222/en/index... via the Internet. Accessed 26 April 2010.
    1. Schanzer DL, Tam TWS, Langley JM, Winchester BT (2007) Influenza-attributable deaths: Canada 1990–1999. Epidemiol Infect 135: 1109–16. - PMC - PubMed
    1. Schanzer DL, Langley JM, Tam TWS (2008) Co-morbidities associated with influenza-attributed mortality, 1994–2000, Canada. Vaccine 26: 4697–703. - PubMed
    1. Schanzer DL, McGeer A, Morris K (2013) Statistical estimates of hospital admissions attributable to seasonal and pandemic influenza for Canada. Influenza and Other Respiratory Viruses 7: 799–808. - PMC - PubMed

Publication types