Pup mortality in a rapidly declining harbour seal (Phoca vitulina) population
- PMID: 24312239
- PMCID: PMC3842331
- DOI: 10.1371/journal.pone.0080727
Pup mortality in a rapidly declining harbour seal (Phoca vitulina) population
Abstract
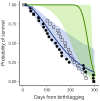
The harbour seal population in Orkney, off the north coast of Scotland, has reduced by 65% between 2001 and 2010. The cause(s) of this decline are unknown but must affect the demographic parameters of the population. Here, satellite telemetry data were used to test the hypothesis that increased pup mortality could be a primary driver of the decline in Orkney. Pup mortality and tag failure parameters were estimated from the duration of operation of satellite tags deployed on harbour seal pups from the Orkney population (n = 24) and from another population on the west coast of Scotland (n = 24) where abundance was stable. Survival probabilities from both populations were best represented by a common gamma distribution and were not different from one another, suggesting that increased pup mortality is unlikely to be the primary agent in the Orkney population decline. The estimated probability of surviving to 6 months was 0.390 (95% CI 0.297 - 0.648) and tag failure was represented by a Gaussian distribution, with estimated mean 270 (95% CI = 198 - 288) and s.d. 21 (95% CI = 1 - 66) days. These results suggest that adult survival is the most likely proximate cause of the decline. They also demonstrate a novel technique for attaining age-specific mortality rates from telemetry data.
Conflict of interest statement
Figures


References
-
- Lonergan M (2011) Potential biological removal and other currently used management rules for marine mammal populations: A comparison Marine Policy. 35: 584–589.
-
- Collen B, Loh J, Whitmee S, McRae L, Amin R, et al. (2008) Monitoring change in vertebrate abundance: the Living Planet Index. Conservation Biology 23: 317–327. - PubMed
-
- Boyd IL, Wanless S, Camphuysen CJ (2006) Top Predators in Marine Ecosystems: Their Role in Monitoring and Management. Cambridge: Cambridge University Press. 378 p.
-
- OSPAR (2009) The OSPAR system of Ecological Quality Objective for the North Sea, a contribution to OSPAR's Quality Status Report 2010. Available at: http://www.ospar.org/documents/dbase/publications/p00404_working%20for%2....
-
- Barlow J, Boveng P (1991) Modling age-specific mortality for marine mammal populations. Marine Mammal Science 7: 50–65.
Publication types
MeSH terms
LinkOut - more resources
Full Text Sources
Other Literature Sources

