

DNA barcode identification of Podocarpaceae--the second largest conifer family
- PMID: 24312258
- PMCID: PMC3842326
- DOI: 10.1371/journal.pone.0081008
DNA barcode identification of Podocarpaceae--the second largest conifer family
Abstract
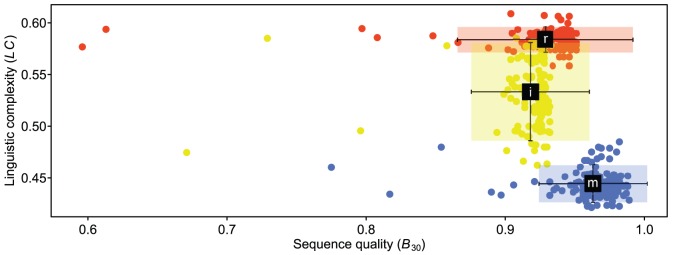
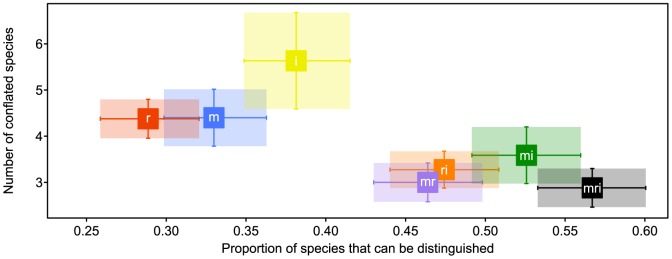
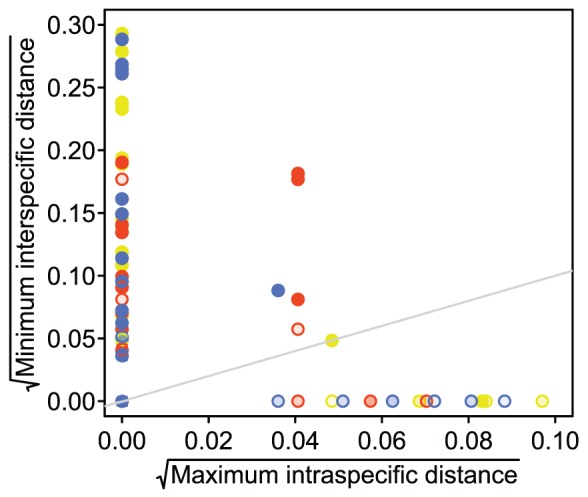
We have generated matK, rbcL, and nrITS2 DNA barcodes for 320 specimens representing all 18 extant genera of the conifer family Podocarpaceae. The sample includes 145 of the 198 recognized species. Comparative analyses of sequence quality and species discrimination were conducted on the 159 individuals from which all three markers were recovered (representing 15 genera and 97 species). The vast majority of sequences were of high quality (B 30 = 0.596-0.989). Even the lowest quality sequences exceeded the minimum requirements of the BARCODE data standard. In the few instances that low quality sequences were generated, the responsible mechanism could not be discerned. There were no statistically significant differences in the discriminatory power of markers or marker combinations (p = 0.05). The discriminatory power of the barcode markers individually and in combination is low (56.7% of species at maximum). In some instances, species discrimination failed in spite of ostensibly useful variation being present (genotypes were shared among species), but in many cases there was simply an absence of sequence variation. Barcode gaps (maximum intraspecific p-distance > minimum interspecific p-distance) were observed in 50.5% of species when all three markers were considered simultaneously. The presence of a barcode gap was not predictive of discrimination success (p = 0.02) and there was no statistically significant difference in the frequency of barcode gaps among markers (p = 0.05). In addition, there was no correlation between number of individuals sampled per species and the presence of a barcode gap (p = 0.27).
Conflict of interest statement
Figures

References
-
- Farjon A (2001) World checklist and bibliography of conifers. Richmond: Royal Botanic Gardens, Kew, 2 edition.
-
- Cernusak LA, Adie H, Bellingham PJ, Biffin E, Brodribb TJ, et al. (2011) Podocarpaceae in tropical forests: a synthesis. In: Turner BL, Cernusak LA, editors, Ecology of the Podocarpaceae in tropical forests, Washington, D.C.: Smithsonian Insitiution Scholarly Press, volume 95 . pp. 189–195.
-
- de Laubenfels DJ (1969) A revision of the Malesian and pacific rainforest conifers, i. Podocarpaceae, in part. Journal of the Arnold Arboretum 50: 315–369.
-
- de Laubenfels DJ (1988) Coniferales. Flora Malesiana 10: 337–453.
-
- Buchholz JT, Gray NE (1948) A taxonomic revision of Podocarpus I: the sections of the genus and their subdivisions with special reference to leaf anatomy. Journal of the Arnold Arboretum 29: 46–63.
Publication types
MeSH terms
Substances
LinkOut - more resources
Full Text Sources
Other Literature Sources
Miscellaneous
