. 2013 Nov 27;8(11):e81266.
doi: 10.1371/journal.pone.0081266. eCollection 2013.

Automated cell tracking and analysis in phase-contrast videos (iTrack4U): development of Java software based on combined mean-shift processes

Affiliations

Automated cell tracking and analysis in phase-contrast videos (iTrack4U): development of Java software based on combined mean-shift processes

Fabrice P Cordelières et al. PLoS One. .

Abstract

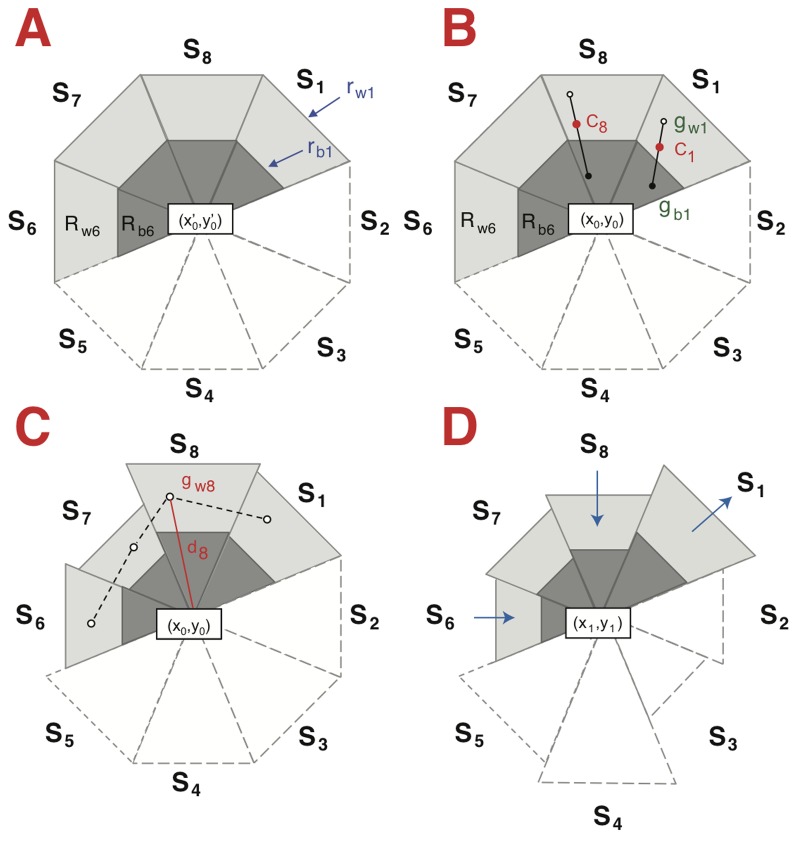
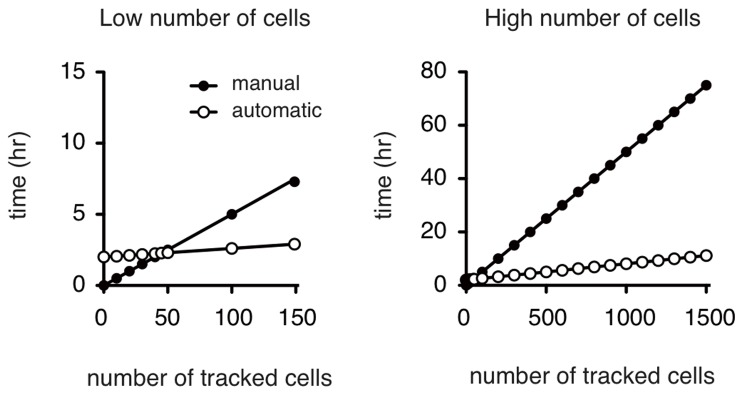
Cell migration is a key biological process with a role in both physiological and pathological conditions. Locomotion of cells during embryonic development is essential for their correct positioning in the organism; immune cells have to migrate and circulate in response to injury. Failure of cells to migrate or an inappropriate acquisition of migratory capacities can result in severe defects such as altered pigmentation, skull and limb abnormalities during development, and defective wound repair, immunosuppression or tumor dissemination. The ability to accurately analyze and quantify cell migration is important for our understanding of development, homeostasis and disease. In vitro cell tracking experiments, using primary or established cell cultures, are often used to study migration as cells can quickly and easily be genetically or chemically manipulated. Images of the cells are acquired at regular time intervals over several hours using microscopes equipped with CCD camera. The locations (x,y,t) of each cell on the recorded sequence of frames then need to be tracked. Manual computer-assisted tracking is the traditional method for analyzing the migratory behavior of cells. However, this processing is extremely tedious and time-consuming. Most existing tracking algorithms require experience in programming languages that are unfamiliar to most biologists. We therefore developed an automated cell tracking program, written in Java, which uses a mean-shift algorithm and ImageJ as a library. iTrack4U is a user-friendly software. Compared to manual tracking, it saves considerable amount of time to generate and analyze the variables characterizing cell migration, since they are automatically computed with iTrack4U. Another major interest of iTrack4U is the standardization and the lack of inter-experimenter differences. Finally, iTrack4U is adapted for phase contrast and fluorescent cells.


Conflict of interest statement

Competing Interests: The authors have declared that no competing interests exist.

Figures

Figure 1
Figure 1. Illustration of the mean-shift model.
A. Initialization of the generic kernel based on the user-defined position (x’0,y’0). The kernel (here an octagon, ndir = 8) is divided into sectors (S1 to S8), each one containing two nested triangle-shaped regions (Rb and Rw), one sensitive to dark and the other to bright pixels (“b” means “black” and “w” means “white”). Here, Rb6 and Rw6 are shown, with a total of 16 regions (Rb1 to Rb8 and Rw1 to Rw8). Only the contours of sectors 2-5 are shown in order to lighten and better visualize the figure. The cell is not presented for clarity. B. Adjustment of the position of the center at t0. Sixteen mass centers (gb1 to gb8 and gw1 to gw8) are first calculated from the intensities of the pixels from each region, (gb1 and gw1 are shown). Sector mass centers (C) are calculated from gwn and gbn, (C8 is shown as an example). The center (x0,y0) is defined as the centroid of the mass centers C1 to C8. C. Adaptation of the kernels to cell morphology at t0. The distances (di) between each mass center (gwn) and kernel center (x0,y0) are calculated (d8 is shown as an example). The new outer radii (rwn) are calculated based on dn, the average dn distances, the expansion factor and the anisotropy factor. rbn is assigned according to the ratio (rb / rw), which is initially defined by the user. D. Representation of the kernels at t1. Information is obtained applying the processes explained in B and C. The size of the sectors will increase or decrease (indicated by the arrows) as a function of cell shape modifications.
Figure 2
Figure 2. Time benefit of automatic tracking vs. manual tracking.
Cells were followed either manually (full circles) or using iTrack4U (white circles). It took about three minutes to track each single cell, corresponding to 181 frames, by manual tracking. Twenty cells can therefore be manually tracked in 1 hour and 200 cells during 10 hours of active work. Automatic tracking is performed in two major steps: (i) the establishment of the parameters for both pre-processing and tracking requires about two hours and (ii) the automatic tracking requires about four seconds to fully track a single cell. Using iTrack4U is beneficial for following over about 50 cells.
Figure 3
Figure 3. Geometric characteristics of cell trajectories associated with distances and extracted by manual and automatic tracking.
Cells were imaged every four minutes for 12 hours and experiments were repeated three times. The same 40 independent cells were tracked manually (M) and automatically (A). The following variables were extracted from the manually and automatically retrieved sets of coordinates:. A. Total distance of migration by WM852 human melanoma cells. Manual and automatic methods were not statistically significant (standard unpaired t-test, p = 0.0774). B. Euclidian distance (start-end distance) of WM852 human melanoma cells. Manual and automatic methods were not statistically significant (standard unpaired t-test, p = 0.9672). C. Persistence of migration by WM852 human melanoma cells. Manual and automatic methods were not statistically significant (standard unpaired t-test, p = 0.5012). D. Definition of migration variables used in this figure. Total distance = dttl, Euclidian distance = dS-E, persistence = dttl / dS-E, minimum travelled distance = dmin, maximum travelled distance = dmax. E. Average distance of migration by WM852 human melanoma cells. Manual and automatic methods were not statistically significant (standard unpaired t-test, p = 0.0774 and p = 0.3913 for the average distance and standard deviation, respectively). F. Extreme values (minimum and maximum distances) of migration for WM852 human melanoma cells. Manual and automatic methods were not statistically significant for the maximum distance (standard unpaired t-test, p = 0.2611). A significant difference for the minimum distance has no real meaning, as explained in the text (standard unpaired t-test, p = 0.001).
Figure 4
Figure 4. Time-dependent characteristics of cell trajectories extracted by manual and automatic tracking.
Cells were imaged every four minutes for 12 hours and experiments were repeated three times. The same forty independent cells were tracked manually (M) and automatically (A). The following variables were extracted from the manually and automatically retrieved sets of coordinates:. A. Average migration speed of WM852 human melanoma cells. Manual and automatic methods were not statistically significant (standard unpaired t-test, p = 0.0669 and p = 0.3266 for the average speed and standard deviation, respectively. B. Average acceleration of migration by WM852 human melanoma cells. Manual and automatic methods were statistically significant (standard unpaired t-test comparing average acceleration, p = 10-4). For the standard deviation of average acceleration, p = 0.2729. C. Percentage of pause by WM852 human melanoma cells. Manual and automatic methods were not statistically significant (standard unpaired t-test, p = 0.1783). D. Angles of displacement between two adjacent time frames (angle α) calculated for WM852 human melanoma cells. Manual and automatic methods were statistically significant (standard unpaired t-test, p = 10-4). E. Definition of variables . The polygon (gray hexagon) represents a cell migrating at three different time frames with three sets of coordinates. The angles α and β are defined relative to the horizontal line as a reference at two consecutive times.
Figure 5
Figure 5. Representativeness of the tracked cells.
Cells were imaged every four minutes for 12 hours and experiments were repeated three times. All cells that were lost during the automatic tracking were re-analyzed by the manual method. We compared the following variables for the population of cells followed by the software (41 cells) and the population of cells lost by the software (26 cells), both populations being analyzed manually here. A. Total distance of migration by WM852 human melanoma cells. The two cell populations did not show any statistically significant difference (standard unpaired t-test, p = 0.5756). B and C. Average distance of migration by WM852 human melanoma cells. The two cell populations did not show any statistically significant difference (standard unpaired t-test, p = 0.5757 and p = 0.5698 for the average distance and standard deviation, respectively). D. Maximum distance of WM852 human melanoma cells. The two cell populations did not show any statistically significant difference (standard unpaired t-test, p = 0.4433). E. Persistence of migration by WM852 human melanoma cells. The two cell populations did not show any statistically significant difference (standard unpaired t-test, p = 0.5632). F. Pause of migration by WM852 human melanoma cells. The two cell populations did not show any statistically significant difference (standard unpaired t-test, p = 0.6459). G and H. Average migration speed of WM852 human melanoma cells. The two cell populations did not show any statistically significant difference (standard unpaired t-test, p = 0.5953 and p = 0.5057 for the average speed and standard deviation, respectively). I. Average acceleration of migration by WM852 human melanoma cells. The two cell populations did not show any statistically significant difference (standard unpaired t-test, p = 0.6894).

References

    1. Horwitz R, Webb D (2003) Cell migration. Curr Biol 13: R756-R759. doi:10.1016/j.cub.2003.09.014. PubMed: 14521851. - DOI - PubMed
    1. Luster AD, Alon R, von Andrian UH (2005) Immune cell migration in inflammation: present and future therapeutic targets. Nat Immunol 6: 1182-1190. doi:10.1038/ni1275. PubMed: 16369557. - DOI - PubMed
    1. Yamaguchi H, Wyckoff J, Condeelis J (2005) Cell migration in tumors. Curr Opin Cell Biol 17: 559-564. doi:10.1016/j.ceb.2005.08.002. PubMed: 16098726. - DOI - PubMed
    1. Dulbecco R, Stoker MG (1970) Conditions determining initiation of DNA synthesis in 3T3 cells. Proc Natl Acad Sci U S A 66: 204-210. doi:10.1073/pnas.66.1.204. PubMed: 5273897. - DOI - PMC - PubMed
    1. Boyden S (1962) The chemotactic effect of mixtures of antibody and antigen on polymorphonuclear leucocytes. J Exp Med 115: 453-466. doi:10.1084/jem.115.3.453. PubMed: 13872176. - DOI - PMC - PubMed

Publication types

LinkOut - more resources