Comparative Study
. 2013 Nov 27;8(11):e81391.
doi: 10.1371/journal.pone.0081391. eCollection 2013.

Comparing the ecological impacts of wind and oil & gas development: a landscape scale assessment

Affiliations
Comparative Study

Comparing the ecological impacts of wind and oil & gas development: a landscape scale assessment

Nathan F Jones et al. PLoS One. .

Abstract

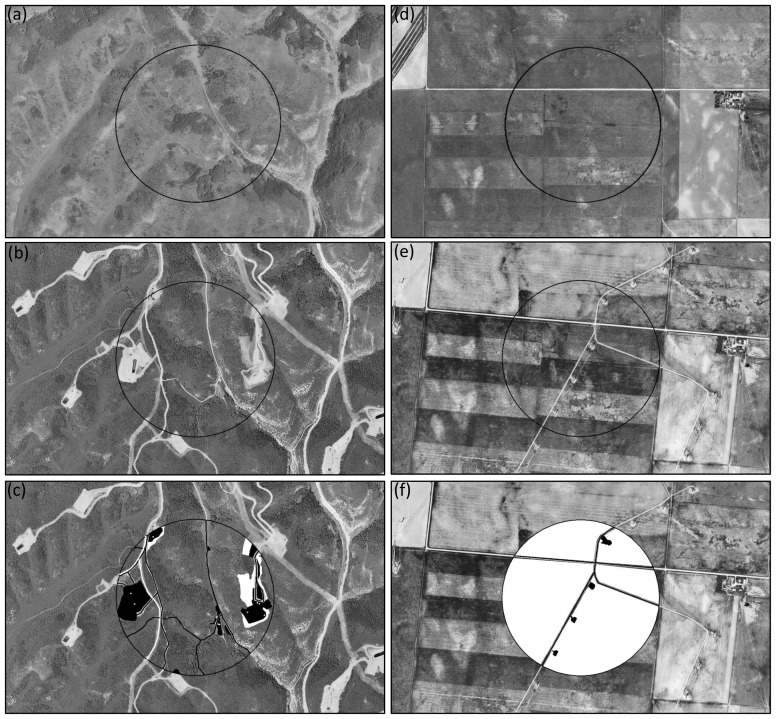
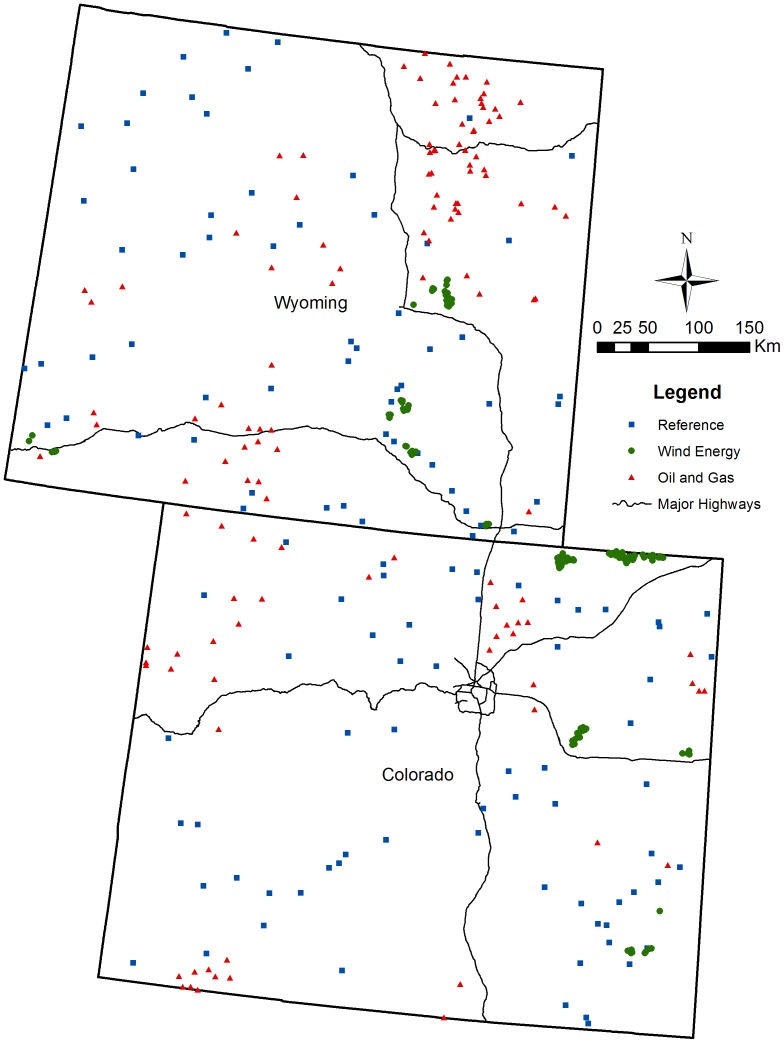
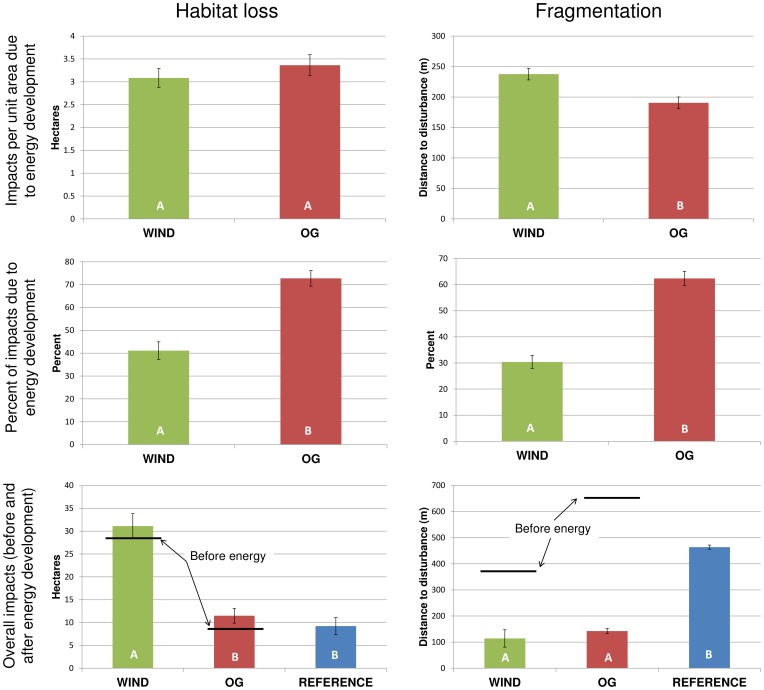
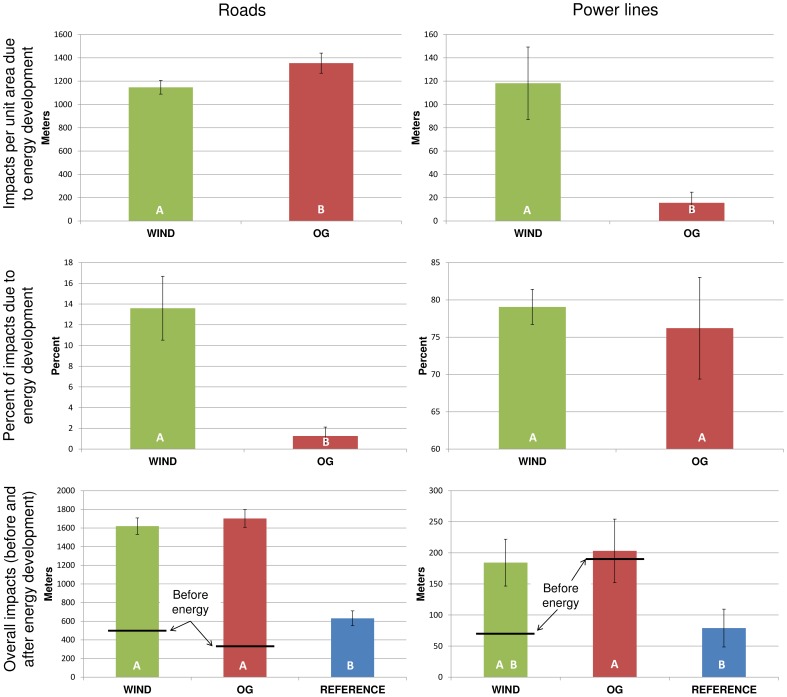
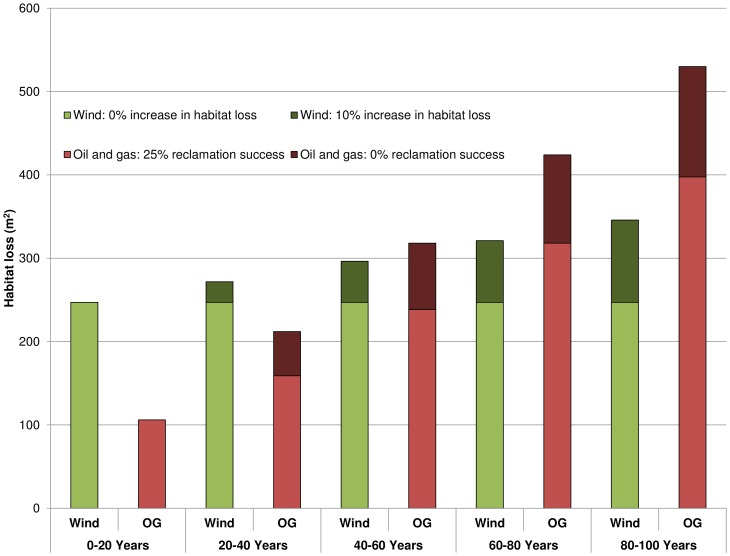
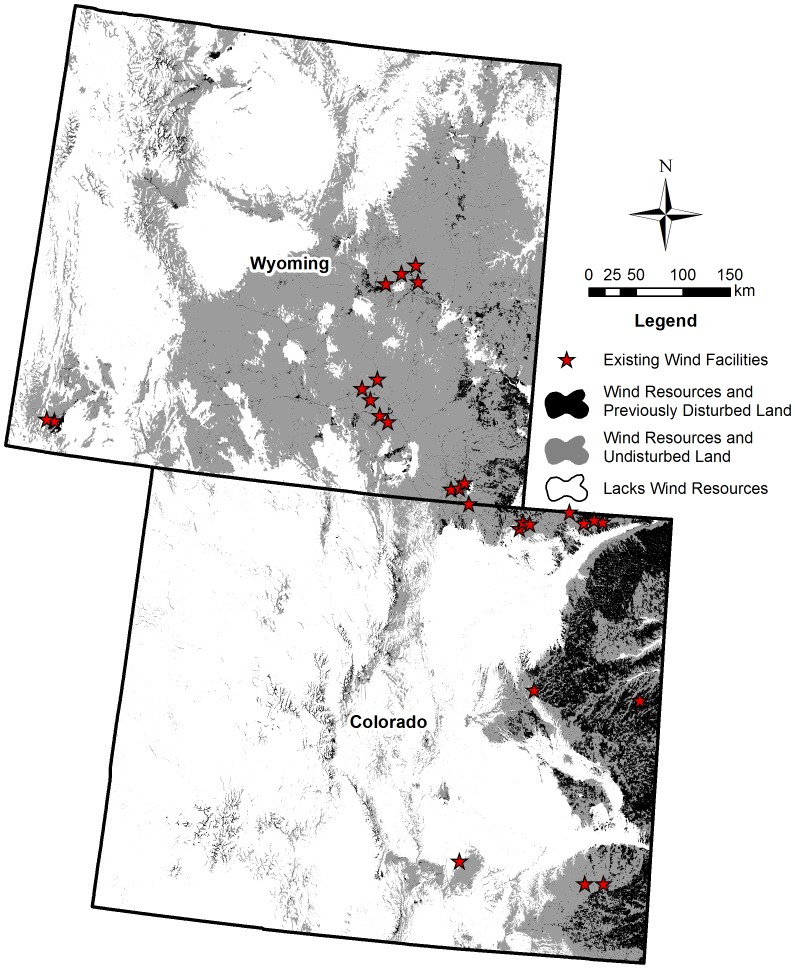
Energy production in the United States is in transition as the demand for clean and domestic power increases. Wind energy offers the benefit of reduced emissions, yet, like oil and natural gas, it also contributes to energy sprawl. We used a diverse set of indicators to quantify the ecological impacts of oil, natural gas, and wind energy development in Colorado and Wyoming. Aerial imagery was supplemented with empirical data to estimate habitat loss, fragmentation, potential for wildlife mortality, susceptibility to invasion, biomass carbon lost, and water resources. To quantify these impacts we digitized the land-use footprint within 375 plots, stratified by energy type. We quantified the change in impacts per unit area and per unit energy produced, compared wind energy to oil and gas, and compared landscapes with and without energy development. We found substantial differences in impacts between energy types for most indicators, although the magnitude and direction of the differences varied. Oil and gas generally resulted in greater impacts per unit area but fewer impacts per unit energy compared with wind. Biologically important and policy-relevant outcomes of this study include: 1) regardless of energy type, underlying land-use matters and development in already disturbed areas resulted in fewer total impacts; 2) the number and source of potential mortality varied between energy types, however, the lack of robust mortality data limits our ability to use this information to estimate and mitigate impacts; and 3) per unit energy produced, oil and gas extraction was less impactful on an annual basis but is likely to have a much larger cumulative footprint than wind energy over time. This rapid evaluation of landscape-scale energy development impacts could be replicated in other regions, and our specific findings can help meet the challenge of balancing land conservation with society's demand for energy.


Conflict of interest statement

Competing Interests: The authors have declared that no competing interests exist.

Figures

Figure 1
Figure 1. Examples of sample plots used to quantify impacts to indicators of biodiversity and ecosystem services.
Western Colorado landscape before (a) and after (b) natural gas development. Eastern Colorado landscape before (d) and after (e) wind energy development. Sample plots with habitat loss digitized (c,f) as impervious (white) and non-impervious (black). Imagery from the National Agriculture Imagery Program (USDA Farm Service Agency) and National Aerial Photography Program (USGS) are representative of the imagery used during data collection.
Figure 2
Figure 2. Study area and sample plots.
The study area is defined by the political boundaries of Colorado and Wyoming and includes 375 randomly selected, 1-km diameter sample plots, stratified by wind energy, oil and gas, and other/underlying land-uses (reference stratum).
Figure 3
Figure 3. The impact of energy development on habitat loss and fragmentation.
Results are presented as the impacts per unit area due to energy development (top), percent of impacts due to energy development (middle), and overall impacts from all land-uses (bottom) with horizontal black bars indicating underlying impacts prior to energy development. Different letters represent statistically significant differences (p<0.05) and error bars reflect standard errors. The y-axis on the upper and lower fragmentation graphs are distance to disturbance, therefore shorter bars represent higher levels of fragmentation.
Figure 4
Figure 4. The impacts of energy development on wildlife mortality.
The average length of power lines and roads is presented as the impacts per unit area due to energy development (top), percent of impacts due to energy development (middle), and overall impacts from all land-uses (bottom) with horizontal black bars indicating underlying impacts prior to energy development. Different letters represent statistically significant differences (p<0.05) and error bars reflect standard errors.
Figure 5
Figure 5. Predicted habitat loss per unit energy produced over 100 years.
These trends illustrate several alternative scenarios in which: 1) there is no increase in habitat loss as wind turbines are refurbished every 20 years; 2) there is a marginal (10%) increase in habitat loss from wind energy due, for example, to repositioning turbines or widening roads; 3) there is no successful reclamation from oil and gas development; and 4) 25% of all habitat lost due to oil and gas is successfully restored every 20 years or 25% of existing infrastructure is reused. Energy production and impact estimates are based on a 20 year reported life-span of a normal oil or natural gas well and a modern industrial scale wind turbine , .
Figure 6
Figure 6. Portions of the study area where wind energy development could occur on previously disturbed lands.
This map delineates areas with potential for wind energy development on previously disturbed lands (black), native or undisturbed lands (grey), and areas that lack suitable wind resources (white) as well as the location of existing wind energy facilities , , , , .

References

    1. Energy Information Administration (2012). Electric power annual 2011. Washington, D.C.: U.S. Department of Energy, Office of Energy Markets and End Use, Energy Information Administration. Available: http://www.eia.gov/cneaf/solar.renewables/page/wind/wind.html. Accessed 2013 Jan 31.
    1. U.S. Department of Energy (2008) 20% wind energy by 2030 – increasing wind energy’s contribution to U.S. electricity supply. Washington, D.C.: U.S. DOE Energy Efficiency and Renewable Energy.
    1. Jacobson MZ (2008) Review of solutions to global warming, air pollution, and energy security. Energy and Environmental Science 2: 148–173.
    1. McDonald RI, Fargione J, Kiesecker J, Miller WM, Powell J (2009) Energy sprawl or energy efficiency: climate policy on natural habitat for the United States of America. PLOS ONE 4: e6802. - PMC - PubMed
    1. Denholm P, Hand M, Jackson M, Ong S (2009) Land-use requirements of modern wind power plants in the United States. Golden, Colorado: National Renewable Energy Laboratory.

Publication types

LinkOut - more resources