. 2013 Dec 3;8(12):e79306.
doi: 10.1371/journal.pone.0079306. eCollection 2013.

Neuropilar projections of the anterior gastric receptor neuron in the stomatogastric ganglion of the Jonah crab, Cancer borealis

Affiliations

Neuropilar projections of the anterior gastric receptor neuron in the stomatogastric ganglion of the Jonah crab, Cancer borealis

Marie L Goeritz et al. PLoS One. .

Abstract

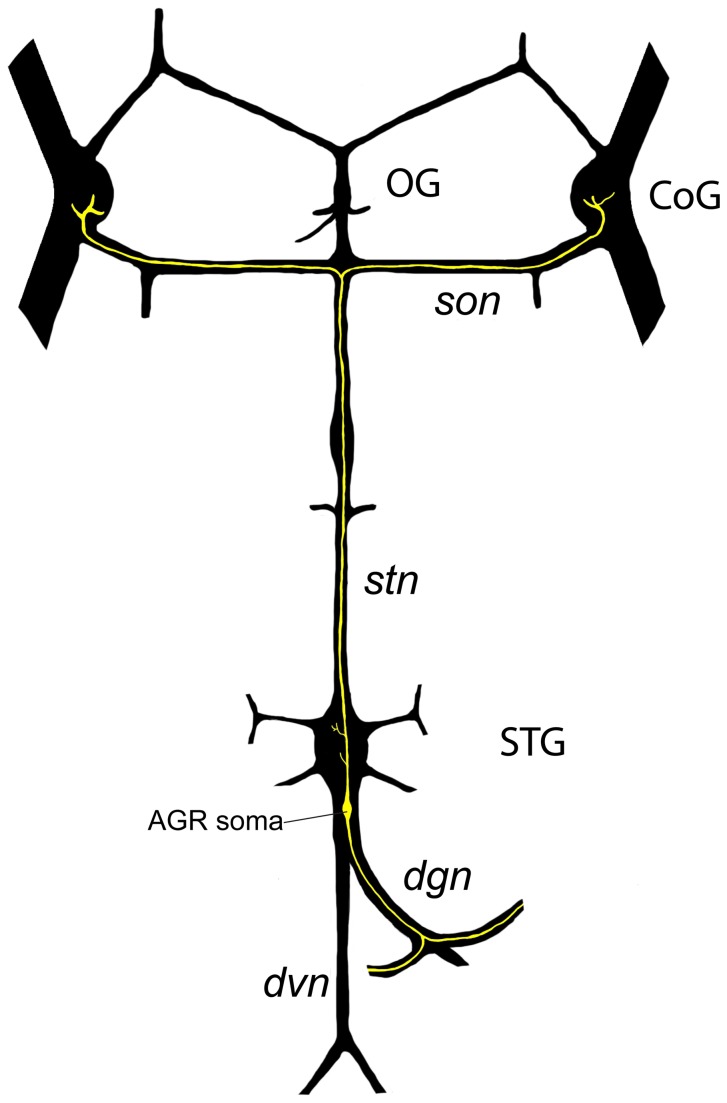
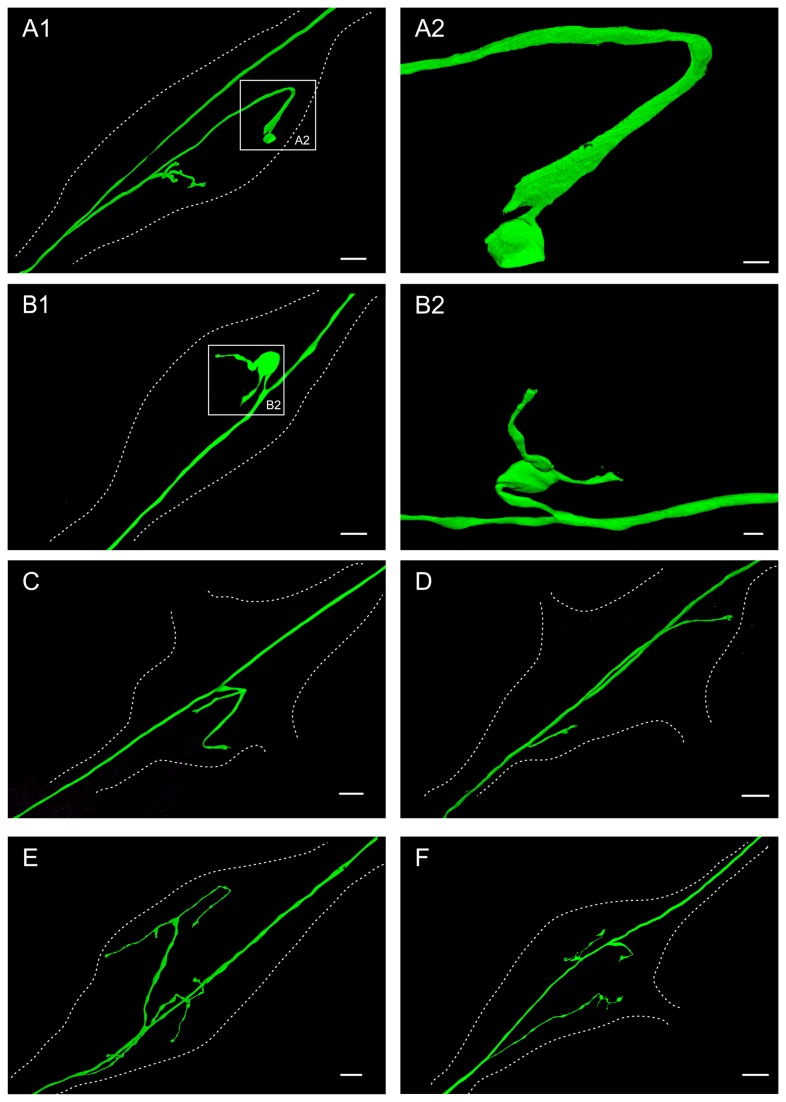
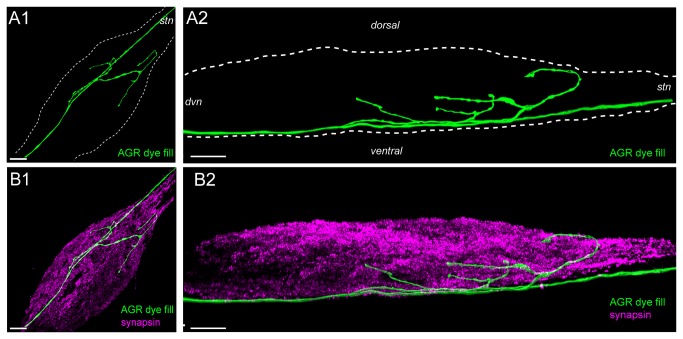
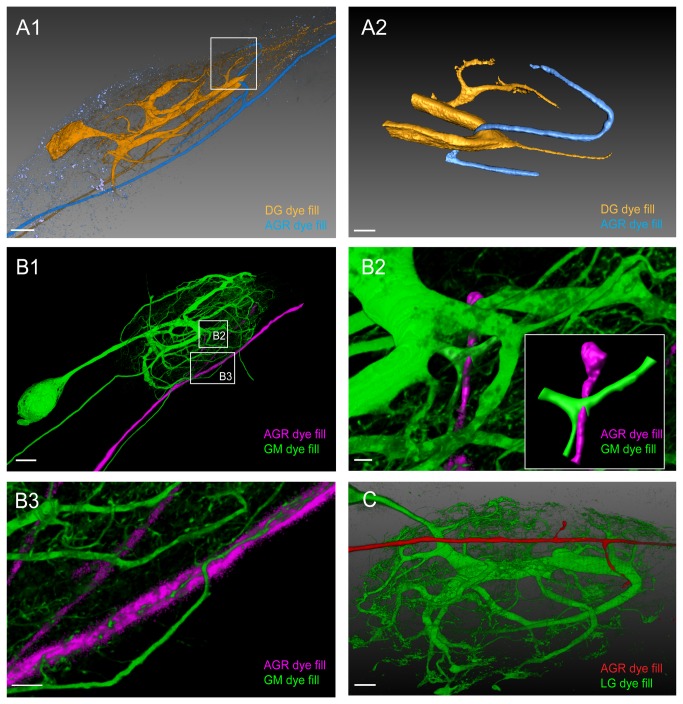
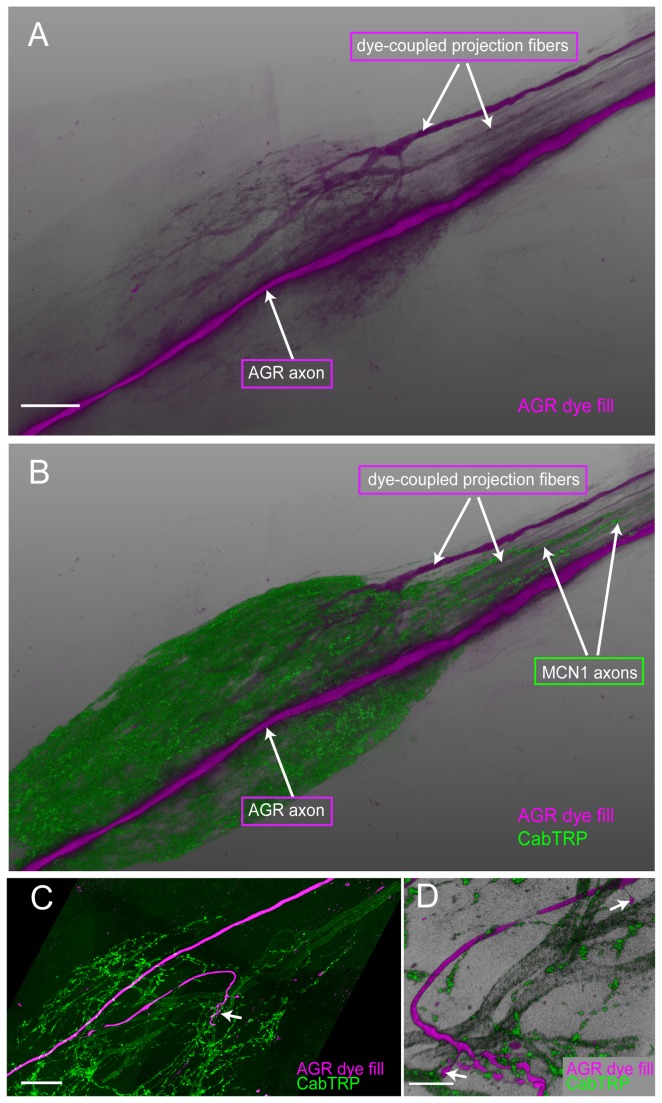
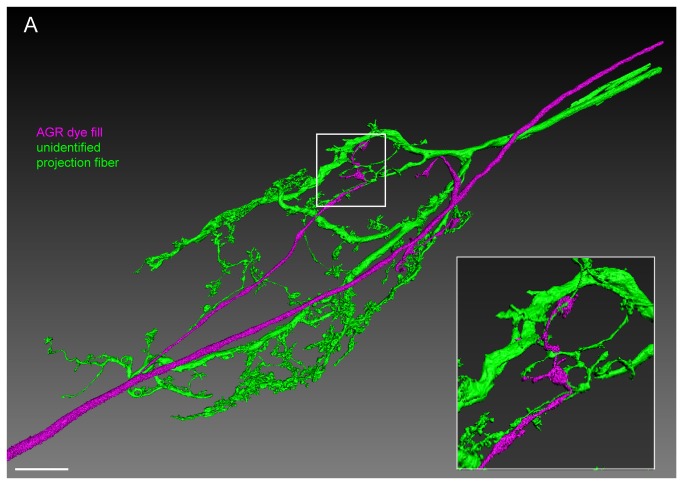
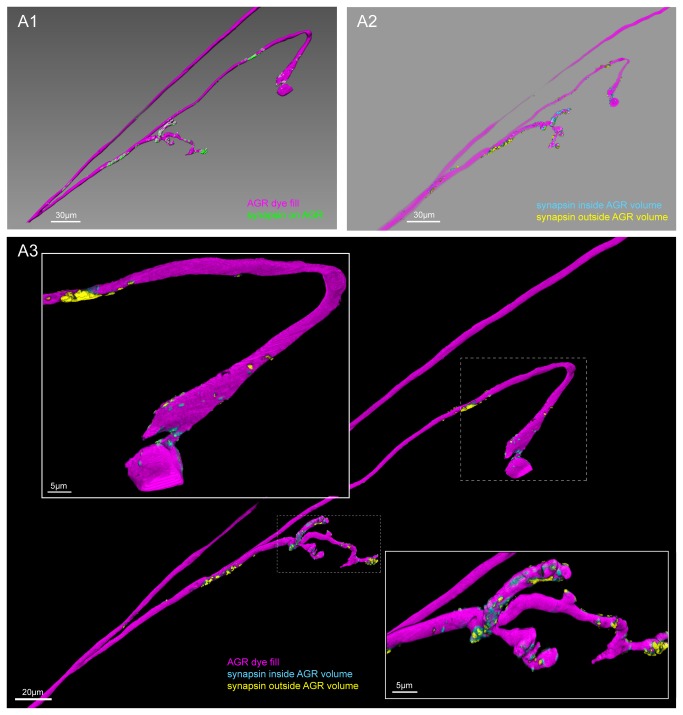
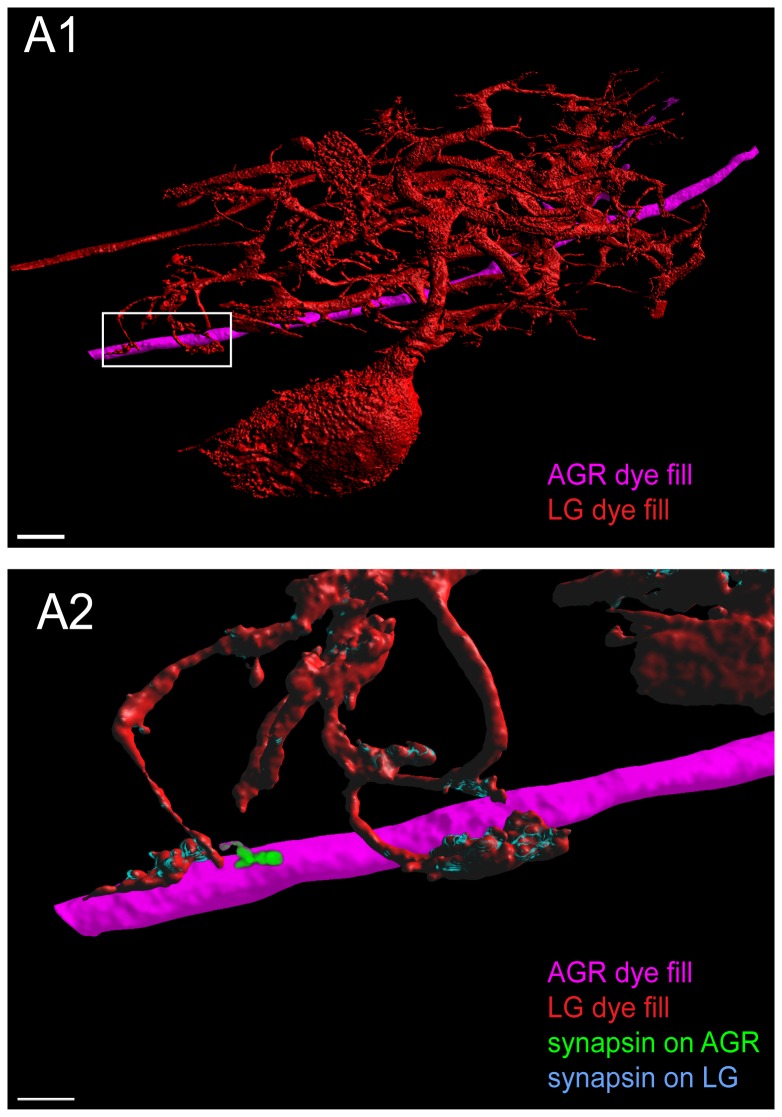
Sensory neurons provide important feedback to pattern-generating motor systems. In the crustacean stomatogastric nervous system (STNS), feedback from the anterior gastric receptor (AGR), a muscle receptor neuron, shapes the activity of motor circuits in the stomatogastric ganglion (STG) via polysynaptic pathways involving anterior ganglia. The AGR soma is located in the dorsal ventricular nerve posterior to the STG and it has been thought that its axon passes through the STG without making contacts. Using high-resolution confocal microscopy with dye-filled neurons, we show here that AGR from the crab Cancer borealis also has local projections within the STG and that these projections form candidate contact sites with STG motor neurons or with descending input fibers from other ganglia. We develop and exploit a new masking method that allows us to potentially separate presynaptic and postsynaptic staining of synaptic markers. The AGR processes in the STG show diversity in shape, number of branches and branching structure. The number of AGR projections in the STG ranges from one to three simple to multiply branched processes. The projections come in close contact with gastric motor neurons and descending neurons and may also be electrically coupled to other neurons of the STNS. Thus, in addition to well described long-loop pathways, it is possible that AGR is involved in integration and pattern regulation directly in the STG.


Conflict of interest statement

Competing Interests: The authors have declared that no competing interests exist.

Figures

Figure 1
Figure 1. Schematic overview of the STNS, showing the location of the AGR neuron (yellow) in the dvn, its projections through the dgn, and its anterior projections through the stn into the commissural ganglia (CoG).
Figure 2
Figure 2. The AGR axon has a single (A-C), two (D-E) or three (F) projections from the main axon in the STG neuropil.
Dotted lines outline the neuropil area of the ganglion in all parts of the figure. A1. Volume-rendered view of LY dye-filled AGR with single projection, branching further into four sub-branches in the STG neuropil. The AGR soma is located in the stn outside the lower-left corner of the frame. Blend mode projection of 8 merged confocal image stacks, each consisting of 84 optical slices (acquired at resolution of 0.067µm x 0.067µm x 0.378µm). Scale bar is 30µm. A2 shows close-up of the boxed area in A1, showing the widened end of the AGR projection within the STG. Scale bar is 5µm. B1. Volume-rendered view of LY dye-filled AGR with single projection, branching further into two short sub-branches in the STG neuropil. The AGR soma is located in the stn outside the lower-left corner of the frame. Blend mode projection of 4 merged confocal image stacks, each consisting of 226 optical slices (acquired at resolution of 0.174µm x 0.174µm x 0.294µm). Scale bar is 30µm. B2 shows a volume-rendered surface projection of the boxed area in B1 from a different angle, emphasizing the big balloon-like widening (not the soma) of the axonal AGR projection. Scale bar is 10µm. C. Volume-rendered view of LY dye-filled AGR with single projection, branching further into two sub-branches in the STG neuropil. The AGR soma is located in the stn outside the lower-left corner of the frame. Blend mode projection of 5 merged confocal image stacks, each consisting of 169 optical slices (acquired at resolution of 0.068µm x 0.068µm x 0.462µm). Scale bar is 30µm. D. Volume-rendered view of LY dye-filled AGR with two simple projections in the STG neuropil. The AGR soma is located in the stn outside the lower left corner of the frame. Blend mode projection of 18 merged confocal image stacks, each consisting of 115 optical slices (acquired at resolution of 0.183µm x 0.183µm x 0.504µm). Scale bar is 30µm. E. Volume-rendered view of LY dye-filled AGR with two projections, each branching further into two or three sub-branches in the STG neuropil. The AGR soma is located in the stn outside the lower-left corner of the frame. Blend mode projection of 10 merged confocal image stacks, each consisting of 264 optical slices (acquired at resolution of 0.179µm x 0.179µm x 0.38µm), ventral view of same preparation as Figure 3. Scale bar is 30µm. F. Volume-rendered view of LY dye-filled AGR with three projections, one of them branching further into two sub-branches in the neuropil. The AGR soma is located in the stn outside the lower-left corner of the frame. Blend mode projection of 9 merged confocal image stacks, each consisting of 229 optical slices (acquired at resolution of 0.168µm x 0.168µm x 0.252µm). Scale bar is 50µm.
Figure 3
Figure 3. The AGR axon typically runs along the ventral surface of the STG and projects dorsally into the neuropil.
A1. Volume-rendered dorsal view of LY dye-filled AGR (green), projected along the dorso-ventral axis. A2. Lateral, maximum intensity projection of the same ganglion. B1. Double labeling with anti-synapsin antibody (purple) reveals the synaptic neuropil in the STG. B2. Lateral projection of the anti-synapsin labeled ganglion shows the ventrally located AGR axon and its dorsal projections into the synaptic neuropil. Blend mode (A1, B1 and B2) and maximum intensity (A2) projections of 10 merged confocal image stacks, each consisting of 264 optical slices (acquired at resolution of 0.179µm x 0.179µm x 0.38µm). Scale bar is 50µm.
Figure 4
Figure 4. Double fills of the AGR and other STG neurons identify potential synaptic partners.
A1. Double fill of the DG neuron with TMR (yellow) and the AGR neuron with LY (blue) shows candidate contact sites in the neuropil. Lateral blend mode projection of 18 merged confocal image stacks, each consisting of 133 optical slices (acquired at resolution of 0.177µm x 0.177µm x 1.007µm). Scale bar is 40µm. A2. Reconstructed surface visualization of the DG-AGR candidate contact site in the coarse neuropil, reconstructed from the same data set as A1. Scale bar is 10µm. B1. Double fill of a GM neuron with neurobiotin (green) and the AGR neuron with alexa Fluor 594-hydrazide (magenta). Blend mode projection of 18 merged confocal image stacks, each consisting of 185 optical slices (acquired at resolution of 0.088µm x 0.088µm x 0.504µm), background-subtracted. Scale bar is 50µm. B2. Close-up of candidate contact site in the coarse neuropil. Scale bar is 5µm. A reconstructed surface visualization of the contact site (inset in B2) allows a clearer view. B3. Close-up of candidate contact site between fine neuropil processes of GM and the AGR axon. Scale bar is 10µm. C. Double fill of the LG neuron with LY (green) and the AGR neuron with alexa Fluor 594-hydrazide (red) shows apparent contact site between the LG primary neurite and an AGR process. Blend mode projection of 8 merged confocal image stacks, each consisting of 155 optical slices (acquired at resolution of 0.177µm x 0.177µm x 0.336µm), background-subtracted. Scale bar is 30µm.
Figure 5
Figure 5. Dye coupling reveals putative electrically coupled neurons.
A. Long-term (2 hours) LY dye-fill of the AGR neuron (magenta) revealed dye-coupled descending STN fibers. B. Double labeling for CabTRP in the same preparation shows that the dye-coupled STN fibers were not MCN1 projections. A and B are blend mode projections of 12 merged confocal image stacks, each consisting of 200 optical slices (acquired at resolution of 0.187µm x 0.187µm x 0.504µm). Scale bar is 50µm. C. AGR processes (LY dye-filled, magenta) are in close apposition to projections from the MCN1 neurons that were labeled with an anti-substance P antibody (green). Blend mode projection of 12 merged confocal image stacks, showing a 47µm thick mid-section of the ganglion (127 of 210 optical slices, acquired at resolution of 0.187µm x 0.187µm x 0.713µm). Scale bar is 50µm. D. A close-up of the neuropil shows a claw-like ending of the LY dye-filled AGR projection (magenta) in close contact with fine MCN1 processes (green), and two distinct AGR terminals in apparent contact with larger-diameter MCN1 processes (arrows). Blend mode projection of 24µm thick mid-section in the same preparation as 4B, rotated 180° around the dorso-ventral axis (66 of 210 optical slices, acquired at resolution of 0.187µm x 0.187µm x 0.713µm). Scale bar is 15µm.
Figure 6
Figure 6. The AGR projections are in close apposition with projections from descending fibers in the STG neuropil.
Double fill of an unidentified STN process with LY (green) and the AGR neuron with alexa Fluor 594-hydrazide (magenta) shows close apposition of processes over a large area in the STG neuropil. Reconstructed surface visualization of 9 merged confocal image stacks, each consisting of 229 optical slices (acquired at resolution of 0.168µm x 0.168µm x 0.252µm). Scale bar is 50µm. Insert shows close-up of boxed area, revealing apparent contact sites between the AGR projection terminals and fine processes of the unidentified projection neuron.
Figure 7
Figure 7. Clustered sites of putative chemical synapses are found in the AGR projections, but typically not in the AGR axon.
A1. Double labeling with an antibody against synapsin reveals patches of immuno-labeling on the LY dye-filled AGR projections. The image was processed to only show synapsin labeling in the AGR (see methods). Scale bar is 30µm. A2. Putative pre- and postsynaptic sites in the AGR projections in the same preparation. Different masking methods allow distinguishing between potentially presynaptic and postsynaptic sites in the AGR neuron (see methods). Synapsin labeling that mostly overlapped with the volume of the reconstructed AGR surface was classified as putative pre-synaptic (blue), and is found predominantly in the distal parts of the AGR process. Synapsin labeling that mostly overlapped with a thin shell around the AGR neuron was interpreted to be located in the processes of adjacent cells, marking putative post-synaptic sites in the AGR neuron (yellow). Scale bar is 30µm. A3. Overlay of the putative pre-and postsynaptic sites with the AGR projection (magenta). The close-up in the inserts reveals the distinct clustering in putative pre- and postsynaptic sites of the AGR projection and axon. Putative pre-synaptic sites in the AGR neuron are blue and putative post-synaptic sites are yellow. A1-A3 are blend mode projections of the same data set of 8 merged confocal image stacks, each consisting of 84 optical slices (acquired at resolution of 0.067µm x 0.067µm x 0.378µm).
Figure 8
Figure 8. Putative chemical synapses at a contact site between LG and AGR.
A1. Double fill of the LG neuron with LY (red) and the AGR neuron with alexa Fluor 594-hydrazide (magenta) shows apparent contact sites of LG processes wrapping around very short stubby projections on the AGR axon. A2. Higher magnification of the box in A1 shows adjacent patches of synapsin immunoreactivity in the LG and in the AGR neuron at their contact site. The image was processed to show synapsin labeling in the LG neuron in blue and synapsin labeling in the AGR neuron in green. A1 and A2 are reconstructed surface visualizations of the same data set of 12 merged confocal image stacks, each consisting of 182 optical slices (acquired at resolution of 0.158µm x 0.158µm x 0.504µm).

References

    1. Pearson KG (1995) Proprioceptive regulation of locomotion. Curr Opin Neurobiol 5: 786–791. doi:10.1016/0959-4388(95)80107-3. PubMed: 8805415. - DOI - PubMed
    1. Clarac F, Cattaert D, Le Ray D (2000) Central control components of a “simple” stretch reflex. Trends Neurosci 23: 199–208. doi:10.1016/S0166-2236(99)01535-0. PubMed: 10782125. - DOI - PubMed
    1. Bässler U, Buschges A (1998) Pattern generation for stick insect walking movements--multisensory control of a locomotor program. Brain Res Brain. Res Rev 27: 65–88. doi:10.1016/S0165-0173(98)00006-X. - DOI - PubMed
    1. Büschges A (2012) Lessons for circuit function from large insects: towards understanding the neural basis of motor flexibility. Curr Opin Neurobiol, 22: 1–7. doi:10.1016/j.conb.2012.02.003. PubMed: 22386530. - DOI - PubMed
    1. Beenhakker MP, DeLong ND, Saideman SR, Nadim F, Nusbaum MP (2005) Proprioceptor regulation of motor circuit activity by presynaptic inhibition of a modulatory projection neuron. J Neurosci 25: 8794–8806. doi:10.1523/JNEUROSCI.2663-05.2005. PubMed: 16177049. - DOI - PMC - PubMed

Publication types

LinkOut - more resources