Clinical Trial
. 2013 Dec 3;8(12):e79804.
doi: 10.1371/journal.pone.0079804. eCollection 2013.

Central role for MCP-1/CCL2 in injury-induced inflammation revealed by in vitro, in silico, and clinical studies

Affiliations
Clinical Trial

Central role for MCP-1/CCL2 in injury-induced inflammation revealed by in vitro, in silico, and clinical studies

Cordelia Ziraldo et al. PLoS One. .

Abstract

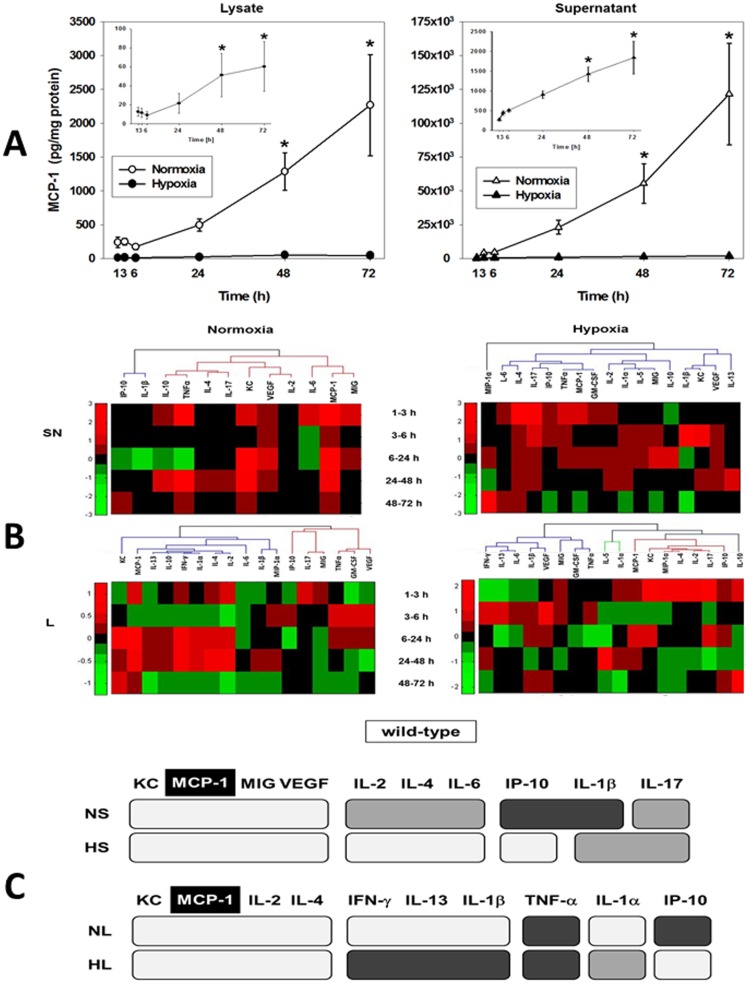
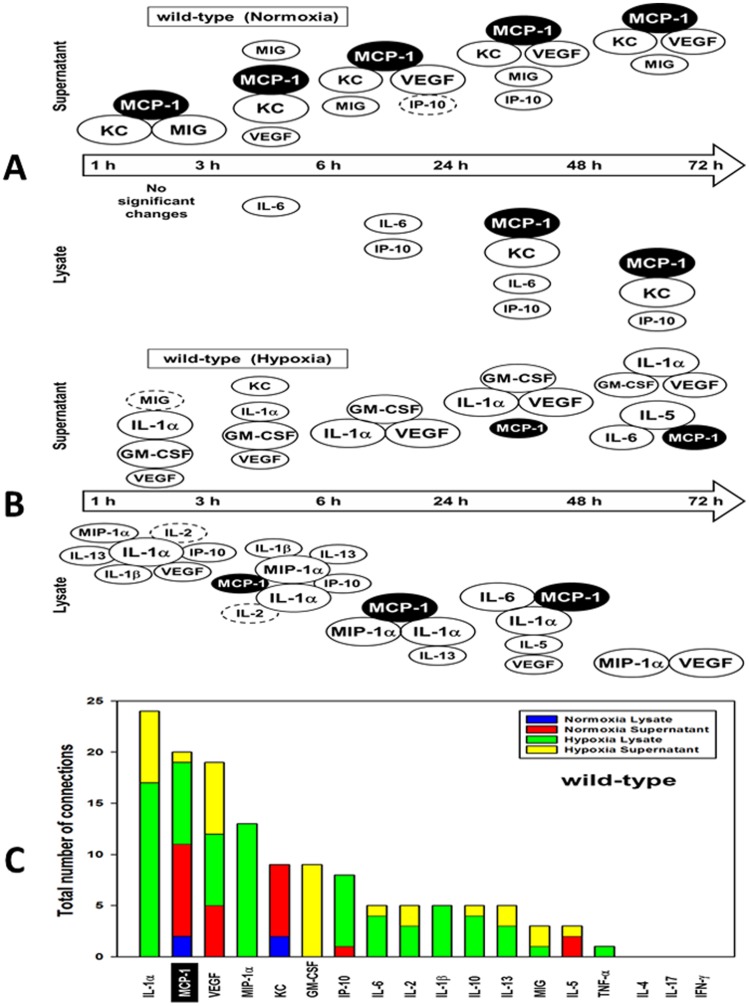
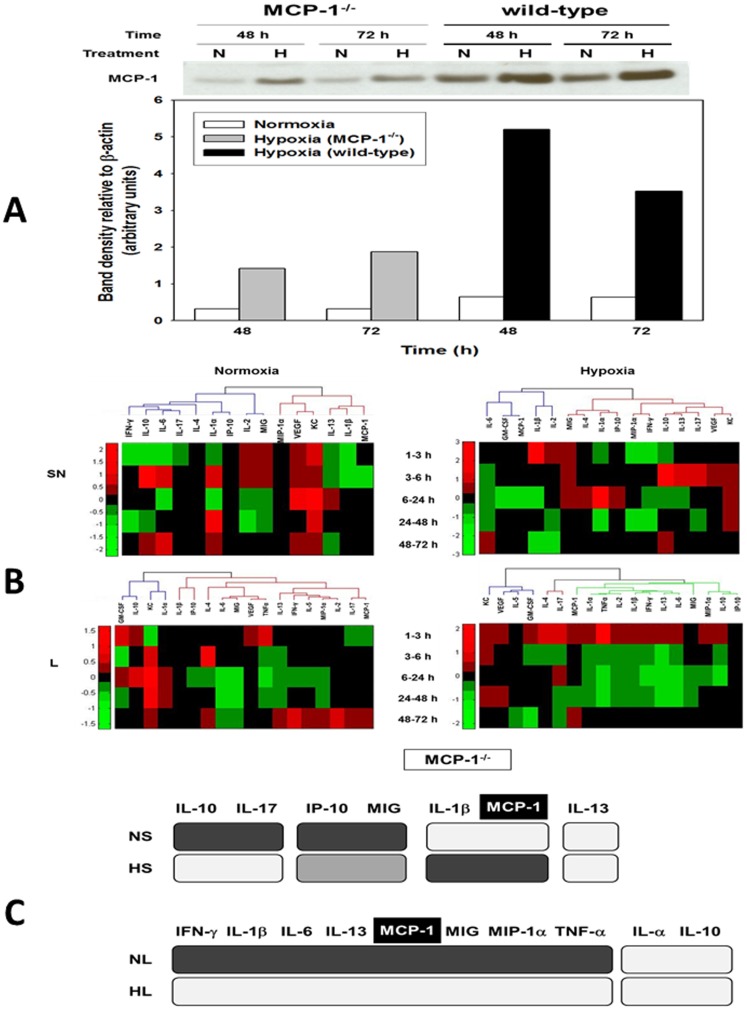
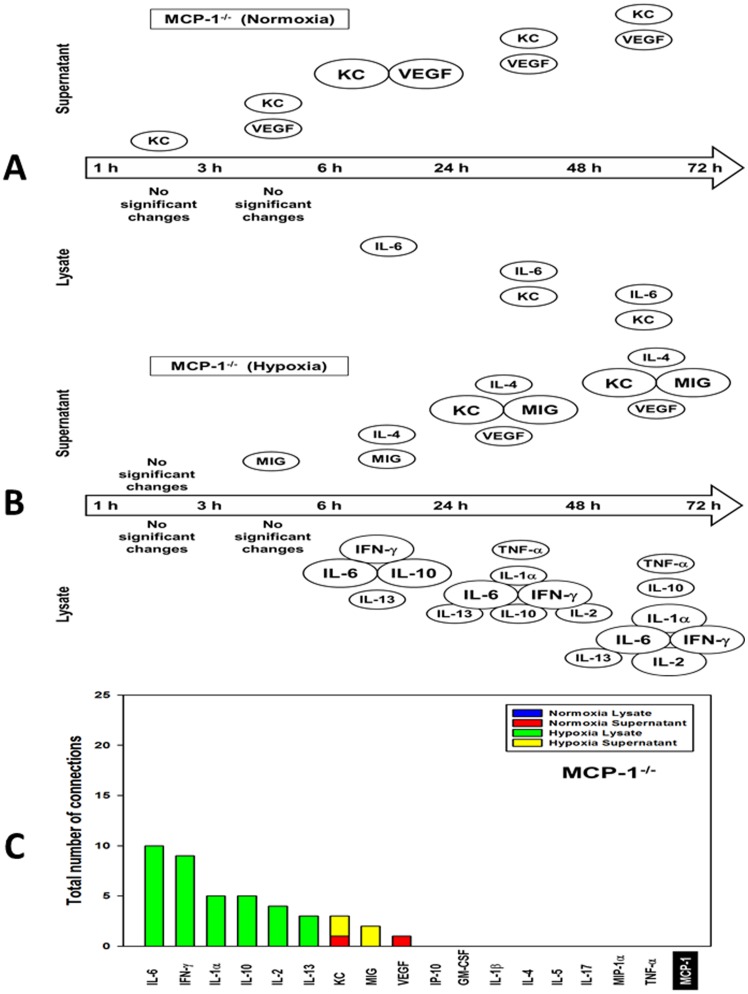
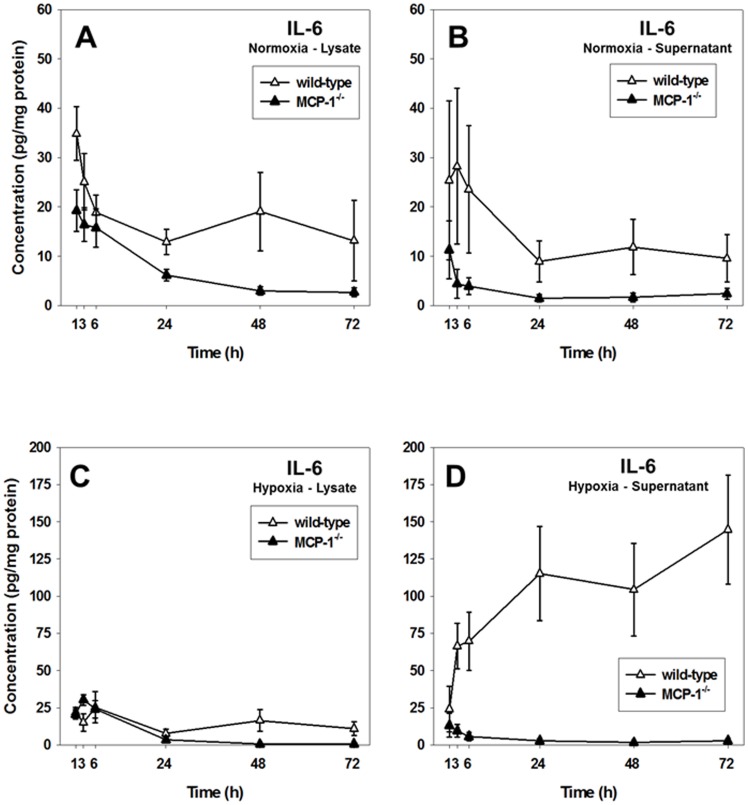
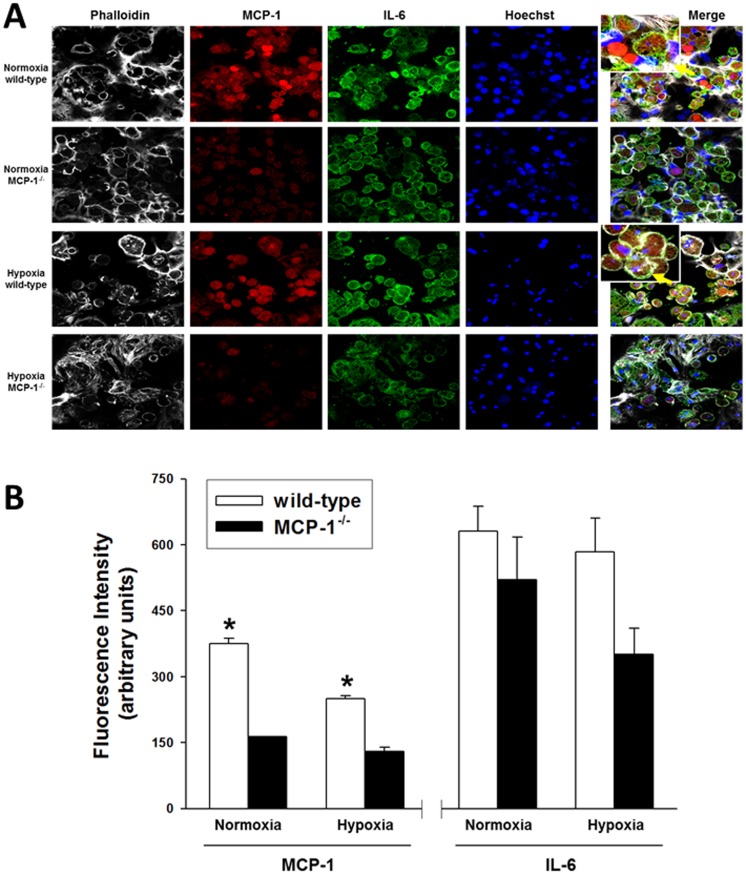
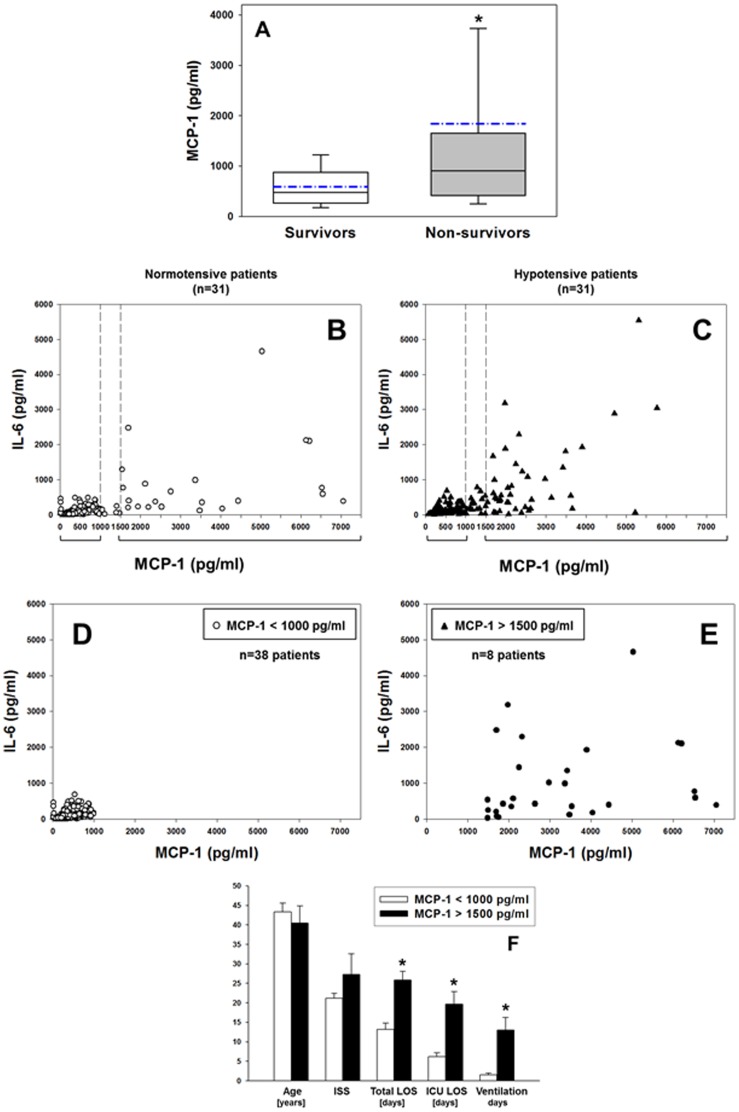
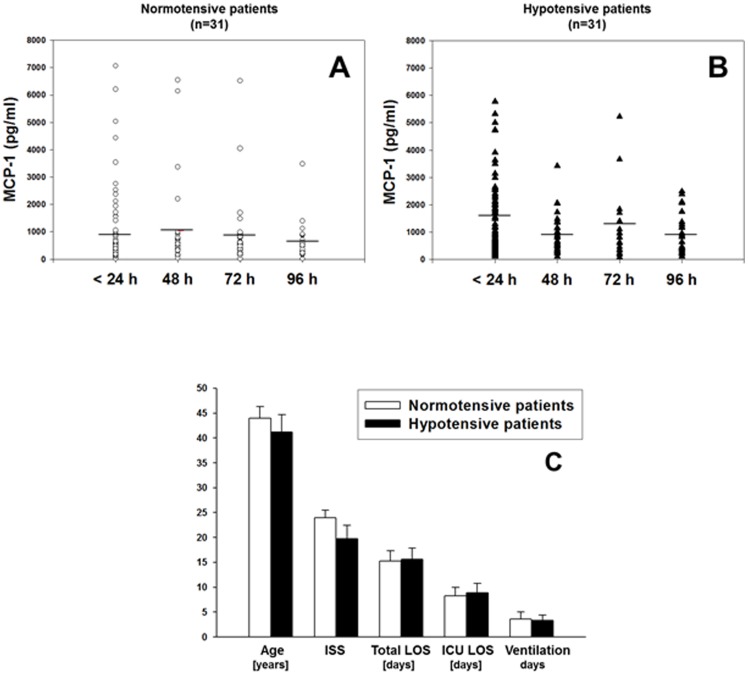
The translation of in vitro findings to clinical outcomes is often elusive. Trauma/hemorrhagic shock (T/HS) results in hepatic hypoxia that drives inflammation. We hypothesize that in silico methods would help bridge in vitro hepatocyte data and clinical T/HS, in which the liver is a primary site of inflammation. Primary mouse hepatocytes were cultured under hypoxia (1% O2) or normoxia (21% O2) for 1-72 h, and both the cell supernatants and protein lysates were assayed for 18 inflammatory mediators by Luminex™ technology. Statistical analysis and data-driven modeling were employed to characterize the main components of the cellular response. Statistical analyses, hierarchical and k-means clustering, Principal Component Analysis, and Dynamic Network Analysis suggested MCP-1/CCL2 and IL-1α as central coordinators of hepatocyte-mediated inflammation in C57BL/6 mouse hepatocytes. Hepatocytes from MCP-1-null mice had altered dynamic inflammatory networks. Circulating MCP-1 levels segregated human T/HS survivors from non-survivors. Furthermore, T/HS survivors with elevated early levels of plasma MCP-1 post-injury had longer total lengths of stay, longer intensive care unit lengths of stay, and prolonged requirement for mechanical ventilation vs. those with low plasma MCP-1. This study identifies MCP-1 as a main driver of the response of hepatocytes in vitro and as a biomarker for clinical outcomes in T/HS, and suggests an experimental and computational framework for discovery of novel clinical biomarkers in inflammatory diseases.


Conflict of interest statement

Competing Interests: The authors have declared that no competing interests exist.

Figures

Figure 1
Figure 1. Inflammatory mediator production by primary mouse hepatocytes and meta-clustering analysis.
Freshly isolated hepatocytes from C57BL/6 (wild-type) mice were cultured under normoxic (control, 21% O2, open symbols) or hypoxic (1% O2, closed symbols) conditions for 1–72 h as described in the Materials and Methods . Both lysates and supernatants were assayed for 18 mouse inflammatory mediators using the Luminex xMAP technology and the measurements were normalized for protein content as indicated. (A) MCP-1 expression and release in primary mouse hepatocytes (mean ± SEM, n = 4–8 independent experiments, analyzed by Two-Way ANOVA followed by the Holm-Sidak post-hoc test, *P<0.001, normoxia vs. hypoxia within a specific time point). The insets show the levels of MCP-1 in hypoxia samples. (B) Hierarchical clustering over fold changes in wild-type hepatocytes (normoxia vs. hypoxia): Fold change values for each inflammatory mediator are represented in heat maps, ranging from large negative (green) to large positive values (red). No changes (zero values) changes are represented in black (see Materials and Methods ). (C) Comparison between meta-clustering analysis outcomes in normoxia and hypoxia (see Materials and Methods ). The shading of the boxes indicates the grouping of mediators that exhibited the same segregation pattern across all methods. For each experimental condition (NL, HL, NS and HS), only the mediators appearing in each consensus are shown. For comparison between experimental conditions only mediators common to both consensuses are shown. The consensus clusters characterize the cellular response and were derived from hierarchical clustering (mediators with similar dynamic trajectories) and from PCA (mediators with the strongest covariance with other mediators).
Figure 2
Figure 2. Dynamic Network Analysis (DyNA) of inflammatory mediators produced by normoxic and hypoxic mouse hepatocytes.
Primary hepatocytes from wild-type mice were cultured under normoxic or hypoxic conditions (1–72 h) followed by measurement of inflammatory mediators in both lysates and supernatants and lysates as described in the Materials and Methods . After data normalization, DyNA during each of the following five time frames: 1–3 h, 3–6 h, 6–24 h, 24–48 h, and 48–72 h was performed for both lysates and supernatants as indicated. Panels show a summary of the DyNAs representing the most connected inflammatory mediator “nodes” for both normoxia (A) and hypoxia (B) lysates and supernatants. Each mediator's node size is proportional to the number of connections it has in a given time interval. (C) Stacked bars representing the total number of connections for each inflammatory mediator over all time intervals.
Figure 3
Figure 3. MCP-1 is a central component of the dynamic, multi-dimensional response of hepatocytes to cell stress.
Primary hepatocytes from wild-type and MCP-1−/− mice were cultured under normoxic (N) or hypoxic (H) conditions for 1–72 h, followed by Luminex™ analysis of 18 inflammatory mediators in both the supernatant (SN) and whole-cell lysate (L). The measurements were normalized and hierarchical and k-means clustering was performed as described in the Materials and Methods . (A) A representative Western blot showing MCP-1 protein expression in cell lysates from normoxic (N) and hypoxic (H) MCP-1−/− and wild-type mouse hepatocytes (48 and 72 h) and densitometric analysis as described in the Materials and Methods . (B) Hierarchical clustering over fold changes in MCP-1−/− hepatocytes (normoxia vs. hypoxia): Fold change values for each inflammatory mediator ranging from large negative (green) to large positive values (red) are shown. No fold changes (zero values) are represented in black. (C) Comparison between meta-clustering analysis outcomes in normoxia and hypoxia (see Materials and Methods ). The shading of the boxes indicates the grouping of mediators that exhibited the same segregation pattern across all methods. For each experimental condition (NL, HL, NS and HS), only the mediators appearing in each consensus are shown. For comparison between experimental conditions only mediators common to both consensuses are shown.
Figure 4
Figure 4. Dynamic Network Analysis (DyNA) of inflammatory mediators produced by normoxic and hypoxic mouse hepatocytes isolated from MCP-1−/− mice.
Primary hepatocytes isolated from MCP-1−/− mice were cultured under normoxic or hypoxic conditions (1–72 h) followed by measurement of inflammatory mediators in both lysates and supernatants as described in the Materials and Methods . After data normalization, DyNA was performed for both lysates and supernatants during each of the following five time frames: 1–3 h, 3–6 h, 6–24 h, 24–48 h, and 48–72 h as indicated. Panels show a summary of the DyNAs representing the principal inflammatory mediator “nodes” for both normoxia (A) and hypoxia (B) lysates and supernatants. (C) Stacked bars representing the total number of connections for each inflammatory mediator over all time intervals.
Figure 5
Figure 5. Time-dependent expression and release of IL-6 in mouse hepatocytes.
Primary hepatocytes from wild-type (open symbols) and MCP-1−/− (closed symbols) mice were cultured under normoxic (Panels A and B) and hypoxic (Panels C and D) conditions for 1, 3, 6, 24, 48 and 72 h followed by measurement of IL-6 in both lysates and supernatants using the Luminex™ xMAP technology as described in the Materials and Methods . Results are the mean ± SEM (n = 4–8 independent experiments, analyzed by Two-way ANOVA, P<0.05 (wild-type vs. MCP-1−/−) for all conditions except hypoxia lysates, Panel C).
Figure 6
Figure 6. Differential expression of MCP-1 and IL-6 in wild-type and MCP-1−/− hepatocytes.
Primary hepatocytes isolated from wild-type and MCP-1−/− mice (n = 3 each) were cultured under normoxic and hypoxic conditions for 48 h in three independent experiments. The cells were then fixed and processed for confocal immunofluorescence imaging as described in the Materials and Methods . (A) Fluorescent labeling: Phalloidin (white), MCP-1 (red), IL-6 (green), Hoechst (blue). (B) Quantification of immunostained cells (fluorescence intensity from 600–700 hepatocytes from 3 independent fields, n = 3 coverslips/experiment). Results are the mean ± SEM (*P<0.001 wild-type vs. MCP-1−/−, analyzed by t-test).
Figure 7
Figure 7. Elevated plasma MCP-1 levels are associated with mortality and morbidity in human trauma/hemorrhage.
(A) MCP-1 levels in plasma samples from trauma patients (survivors vs. non-survivors, n = 15 each) taken within the first 24 h after trauma as described in the Materials and Methods . Results represent the mean ± SEM (The dotted line represents the mean value, *P = 0.001, survivors vs. non-survivors analyzed by Mann-Whitney U test). (B–C) Plot of IL-6 vs. MCP-1 levels in blood samples from normotensive (B) and hypotensive (C) trauma patients (n = 31 each) taken within the first 24 h after trauma, followed by sampling at 48, 72 and 96 h as described in the Materials and Methods . (D–E) Grouping of T/HS patients based on circulating MCP-1/CCL2 levels: Panel D shows MCP-1 values <1000 pg/ml (n = 38 patients) and Panel E shows values >1500 pg/ml (n = 8 patients). Panel F shows the overall demographics (Age, ISS, total LOS, ICU LOS, and ventilation days) of T/HS patients segregated according to plasma MCP-1 levels (<1000 pg/ml; [n = 38 patients] vs. >1500 pg/ml; [n = 8 patients]). Results represent the mean ± SEM. (*P<0.05, analyzed by, MCP-1<1000 pg/ml vs. MCP-1>1500 pg/ml).
Figure 8
Figure 8. Plasma MCP-1 levels in blood samples from trauma patients.
Plasma MCP-1 levels in blood samples from normotensive (Panel A) and hypotensive (Panel B) trauma patients (n = 31 each as in Fig. 7 Panels B–C). Panel C shows the overall demographics of the normotensive (n = 27) and hypotensive patients (n = 19) segregated according to plasma MCP-1 levels (<1000 pg/ml and >1500 pg/ml) and blood pressure status. Results represent the mean ± SEM.

References

    1. Malarkey DE, Johnson K, Ryan L, Boorman G, Maronpot RR (2005) New insights into functional aspects of liver morphology. Toxicol Pathol 33: 27–34. - PubMed
    1. Baratta JL, Ngo A, Lopez B, Kasabwalla N, Longmuir KJ, et al. (2009) Cellular organization of normal mouse liver: a histological, quantitative immunocytochemical, and fine structural analysis. Histochem Cell Biol 131: 713–726. - PMC - PubMed
    1. McCloskey CA, Kameneva MV, Uryash A, Gallo DJ, Billiar TR (2004) Tissue hypoxia activates JNK in the liver during hemorrhagic shock. Shock 22: 380–386. - PubMed
    1. Kan WH, Hsieh CH, Schwacha MG, Choudhry MA, Raju R, et al. (2008) Flutamide protects against trauma-hemorrhage-induced liver injury via attenuation of the inflammatory response, oxidative stress, and apopotosis. Journal of Applied Physiology 105: 595–602. - PMC - PubMed
    1. Johnson AB, Denko N, Barton MC (2008) Hypoxia induces a novel signature of chromatin modifications and global repression of transcription. Mutation Research/Fundamental and Molecular Mechanisms of Mutagenesis 640: 174–179. - PMC - PubMed

Publication types

MeSH terms