. 2013 Dec 2;8(12):e81517.
doi: 10.1371/journal.pone.0081517. eCollection 2013.

Role of N-cadherin cis and trans interfaces in the dynamics of adherens junctions in living cells

Affiliations

Role of N-cadherin cis and trans interfaces in the dynamics of adherens junctions in living cells

Stefanie Bunse et al. PLoS One. .

Abstract

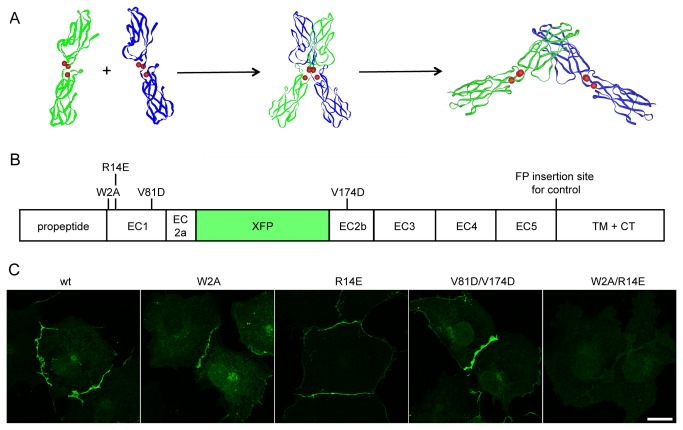
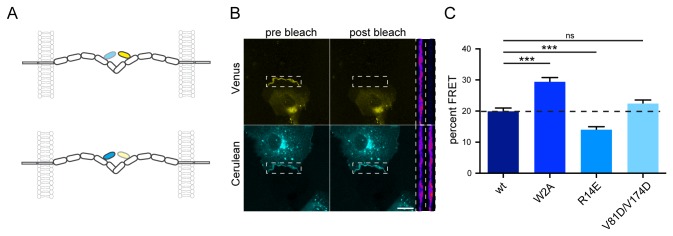
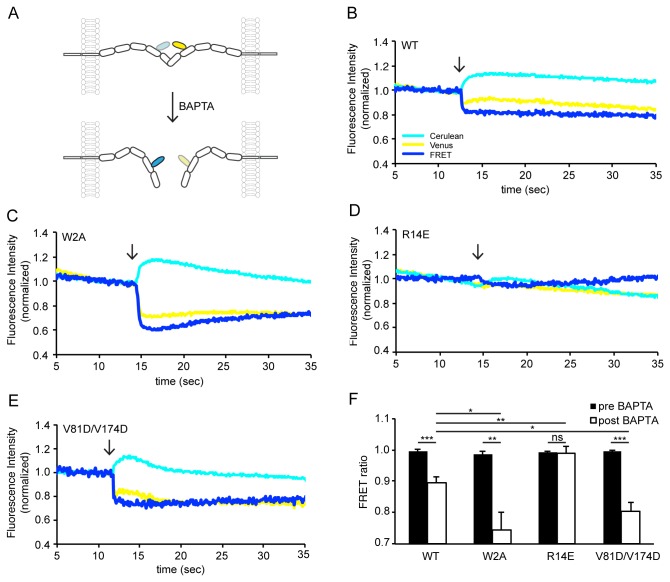
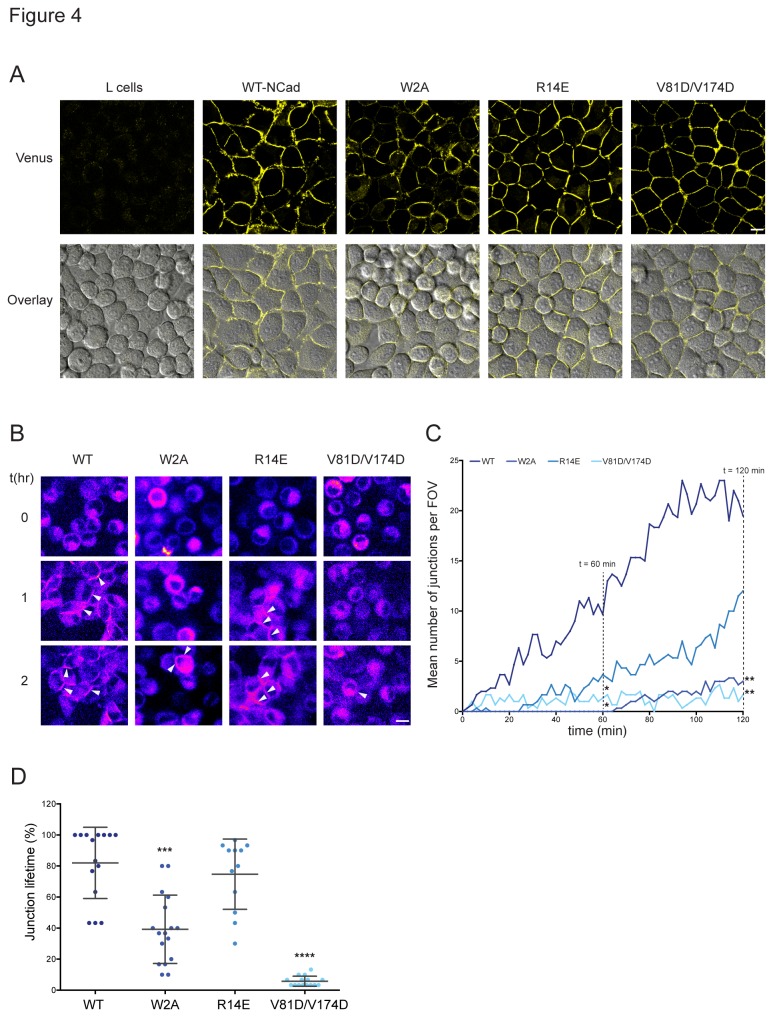
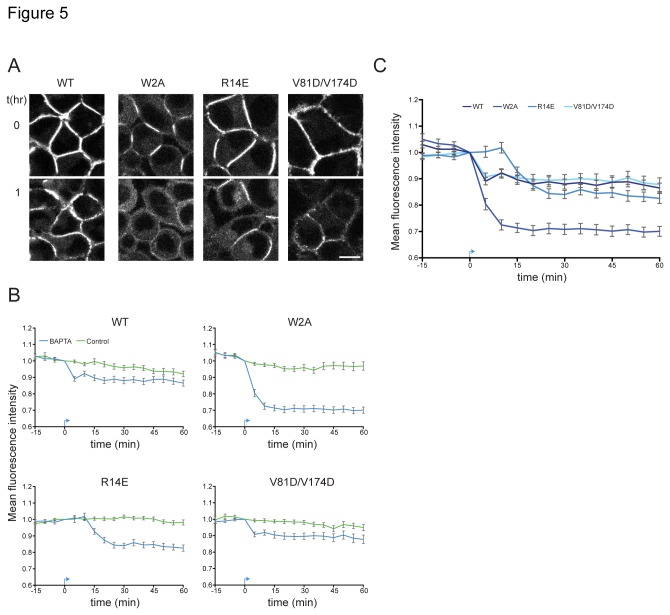
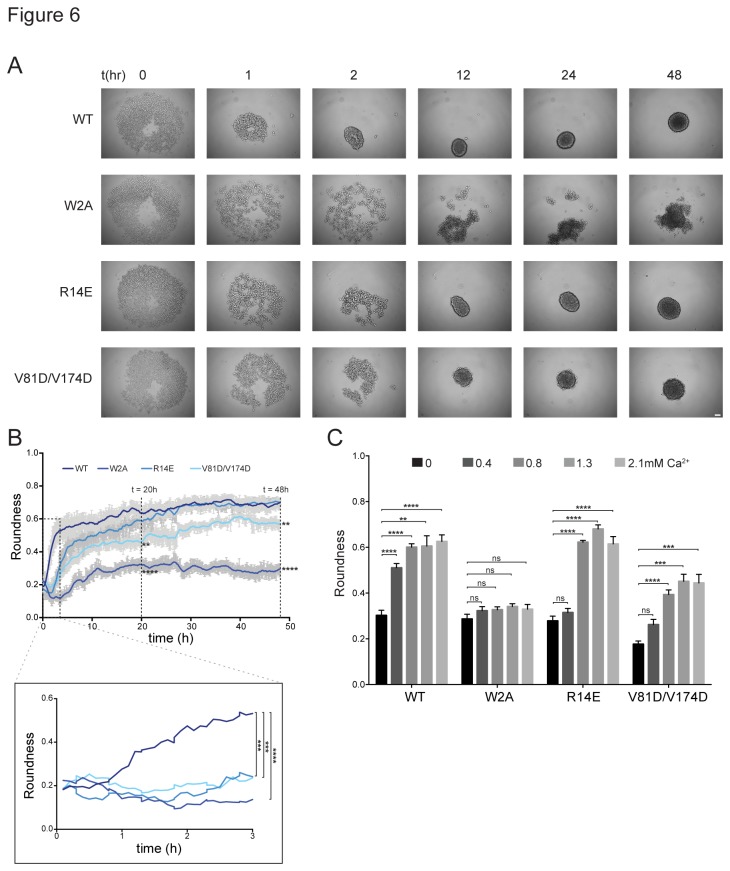
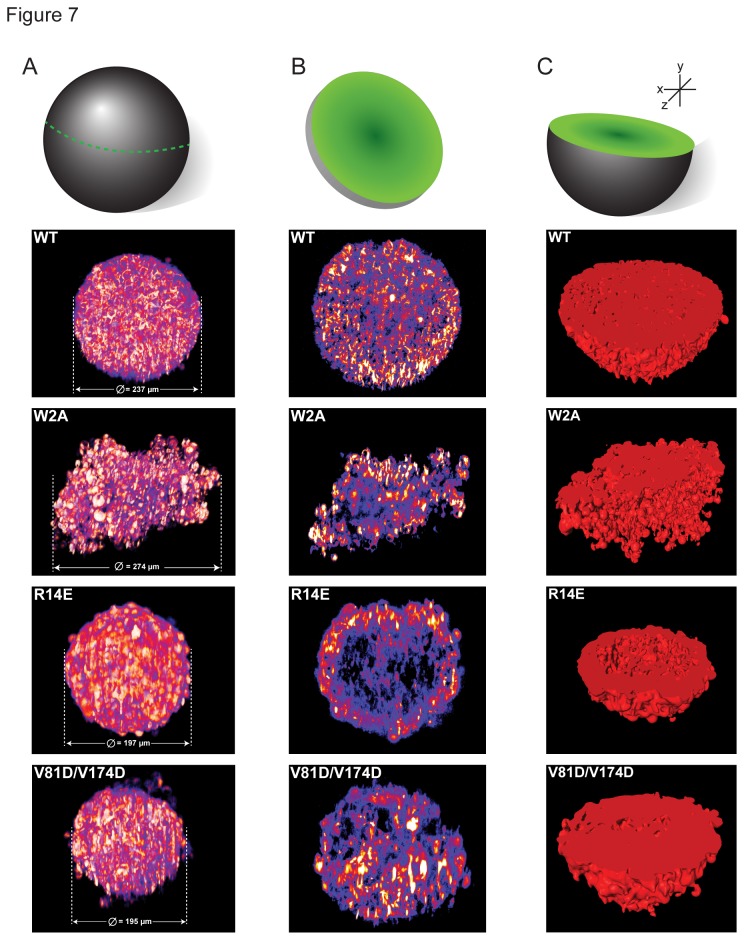
Cadherins, Ca(2+)-dependent adhesion molecules, are crucial for cell-cell junctions and remodeling. Cadherins form inter-junctional lattices by the formation of both cis and trans dimers. Here, we directly visualize and quantify the spatiotemporal dynamics of wild-type and dimer mutant N-cadherin interactions using time-lapse imaging of junction assembly, disassembly and a FRET reporter to assess Ca(2+)-dependent interactions. A trans dimer mutant (W2A) and a cis mutant (V81D/V174D) exhibited an increased Ca(2+)-sensitivity for the disassembly of trans dimers compared to the WT, while another mutant (R14E) was insensitive to Ca(2+)-chelation. Time-lapse imaging of junction assembly and disassembly, monitored in 2D and 3D (using cellular spheroids), revealed kinetic differences in the different mutants as well as different behaviors in the 2D and 3D environment. Taken together, these data provide new insights into the role that the cis and trans dimers play in the dynamic interactions of cadherins.


Conflict of interest statement

Competing Interests: The authors have declared that no competing interests exist.

Figures

Figure 1
Figure 1. Targeting of cis and trans binding interface by point mutations.
(A) Two-step-binding mechanism of cadherin trans interaction. Based on crystal structures, a two-step-binding mechanism was proposed for the trans interaction of E-cadherin [5]. The structures shown are the two monomers of the EC1-EC2-domain of E-cadherin (PDB 1Q1P) on the left side, the intermediate X-dimer (ECad-W2A, PDB 3LNH) in the middle and the final strand-swapped dimer on the right side (PDB 2QVF). Red spheres indicate the position of Ca2+-ions. (B) Scheme of fluorescent N-cadherin fusion protein. The insertion of the fluorescent protein (green, XFP; either Venus or Cerulean) into the second cadherin repeat of the extracellular domain of N-cadherin is illustrated. The position of the mutations targeting the trans (W2A, R14E) and the cis binding interfaces (V81D, V174D) are shown as well as a second insertion site for the fluorescent protein near the EC5 repeat used for control FRET experiments. (C) Expression of mutant fluorescent fusion proteins targeting trans and cis binding interfaces. COS7 cells were transiently transfected with plasmids encoding the N-cadherin-Venus-WT and its binding interface mutants. Besides the double mutant N-cadherin-Venus-W2A-R14E, all fusion proteins were localized at the plasma membrane and formed adhesion junctions. Scale bar 20 µm.
Figure 2
Figure 2. Analysis of the trans interaction of N-cadherin in living cells by acceptor bleach FRET experiments.
(A) Scheme depicting the insertion of Venus (FRET acceptor) and Cerulean (FRET donor) and the interactions of cadherin molecules across a cellular junction. If the two opposing molecules interact with each other in trans, the donor and acceptor are within the FRET distance, resulting in an increased acceptor emission and a donor quenching (upper panel). Upon bleaching of the FRET acceptor, the FRET donor is dequenched, leading to an increase in its fluorescence (lower panel). (B) Example for an acceptor bleach experiment with COS7-cells expressing either N-cadherin-Venus or –Cerulean. The upper two images show the Venus-channel before and after bleaching of the Venus signal in the junction (boxed region). The Cerulean channel is depicted in the lower two images. Bleaching of the Venus fluorescence leads to a dequenching of the FRET donor Cerulean, which can be observed in the lower two images. An enlargement of the junction (boxed region) is shown next to the images. (C) Quantitative comparison of the acceptor bleach experiments for N-cadherin-WT and its mutants. The bars represent the mean ± SEM. The mean of the W2A (n = 32) is significantly increased compared to the WT (n = 35, p < 0.0001, Mann Whitney, ***), while the mean of the mutant R14E was significantly lower (n = 29, p=0.0001, two-tailed unpaired t-test , ***). The cis mutant V81D/V174D (n = 33) does not show a significant difference (p=0.1158, two-tailed unpaired t-test). Scale bar = 20 µm.
Figure 3
Figure 3. Influence of Ca2+-chelation on the individual binding interfaces of N-cadherin.
(A) Disruption of the trans interaction of N-cadherin by BAPTA. Upon disruption of this interaction the fluorophores move further apart, reducing FRET. Examples for ratiometric FRET measurements of the WT (B), W2A (C), R14E (D) and V81D/V174D (E) before and after Ca2+-chelation are shown. After baseline recording, the Ca2+-chelator BAPTA (20 mM final concentration) was added. The fluorescence of the FRET acceptor Venus (yellow) and the donor Cerulean (cyan) as well as the ratio of the two (blue) are shown. (F) The quantification of the effect of BAPTA on all mutants is shown. While the mutants W2A and V81D/V174D showed a significantly higher decrease of the FRET signal due to Ca2+-chelation than the WT, no Ca2+-sensitivity was observed for the X-dimer mutant R14E. This confirms the hypothesis that the X-dimer is a Ca2+-dependent intermediate step in the formation of the strand-swapped dimer. n(WT) = 8, n(W2A) = 8, n(R14E) = 9, n(V81D/V174D) = 7 junctions. Statistics were conducted using either paired or unpaired t-test.
Figure 4
Figure 4. Adherens junction assembly of WT-N-cadherin and its mutants.
(A) Expression pattern of WT-N-cadherin and its mutants in L cells. Confocal images of control L cells or L cell lines stably expressing the N-cadherin-Venus WT and its mutant forms. Membrane fluorescence can be seen for all mutants demonstrating plasma membrane localization and junction formation for all mutants. Top panel: Venus channel, bottom: Overlay of DIC and Venus channel. (B) Example images of junction assembly. Images were taken for all mutants at time 0, 1 and 2 h after imaging commenced. Established junctions can be seen for WT and R14E at 1 h and for all mutants at 2 h (arrowheads). (C) Quantification of junction assembly. The number of junctions formed in a field of view (FOV) was counted over time and plotted. The graph shows that the rate of junction formation for WT is fastest followed by R14E. The number of junctions for all mutants was compared to WT at 60 and 120 min. R14E was not significantly different while W2A and V81D/V174D had significantly lower number of junctions at 60 min and 120 min (n = 3 for all mutants, two-tailed unpaired t-test, P < 0.05). (D) Quantification of junction lifetime. The junction lifetime for junctions present in a FOV was calculated between 60 and 120 min. On average WT junctions were present for 82% of time, R14E = 75%, W2A and V81D/V174D had significantly lower average junction lifetimes of 39% and 6%, respectively, thus confirming that mutating the cis interface leads to highly volatile junctions (Mann-Whitney U test, P < 0.0001). Error bars indicate SD. n(WT) = 15, n(W2A) = 17, n(R14E) = 12, n(V81D/V174D) = 15 junctions. Scale bar (A) and (B) = 10 µm.
Figure 5
Figure 5. All mutants exhibit sensitivity to prolonged Ca2+-chelation.
(A) Example images for WT and all mutants before and 1 h after BAPTA addition. Scale bar = 10 µm. (B) Quantification of junction disassembly. Mean fluorescence intensity of multiple junctions from the different genotypes was measured over time. The drop in mean fluorescence intensity is specific to the addition of BAPTA (blue), indicated by the arrow, as application of a vehicle (green) did not lead to a decrease in junction intensity. (C) Comparison of junction disassembly between different mutants and WT. Although the time course and degree of disassembly differed for the various mutants, with W2A junctions displaying the highest degree of disassembly; on a longer timescale, none of them were completely Ca2+-insensitive. N-cadherin-R14E, which appeared Ca2+-insensitive on a short timescale (Fig. 3 D) also showed a drop in junction intensity 10 min after BAPTA application. Error bars indicate SEM. n(WT) = 84, n(W2A) = 56, n(R14E) = 84, n(V81D/V174D) = 52 junctions.
Figure 6
Figure 6. Junction assembly in 3D cell cultures is severely impaired for W2A mutant.
(A) Example images of spheroid formation at various time points for N-cadherin-WT and its mutants. Scale bar = 50 µm. (B) Quantification of spheroid formation. Spheroid roundness was measured over time. At 3 h (inset) the roundness of all mutants was significantly lower than WT. W2A and V81D/V174D had significantly lower roundness even after 20 h and 48 h of spheroid formation (two-tailed unpaired, t-test, P < 0.05). n(WT) = 9, n(W2A) = 9, n(R14E) = 8, n(V81D/V174D) = 8 spheroids. (C) Ca2+-dependence of spheroid formation. Spheroid formation was monitored in medium with different Ca2+-concentrations. The roundness was measured at 20 h after spheroid formation was started. WT-N-cadherin shows a significant increase in roundness with only a slight increase in Ca2+-concentration (0.4 mM) and continued to gradually increase. W2A did not show any significant change in roundness regardless of the Ca2+-concentration indicating that W2A junctions cannot be rescued with elevated Ca2+-concentration. Both R14E and V81D/V174D needed twice the Ca2+-concentration (0.8 mM) to show a significant increase in roundness emphasizing that in 3D, loss of either X-dimer or the cis interface leads to a decreased Ca2+-sensitivity in junction assembly (n for each condition ≥ 4, Mann-Whitney U test, p < 0.05). Error bars indicate SEM.
Figure 7
Figure 7. All mutants differ in cellular spheroid organization on global or cellular levels compared to N-cadherin-WT.
(A) Example images of complete spheroids after fusing the images from 12 different imaging angles. The dramatic difference between WT and W2A is evident, where W2A does not form a cellular spheroid, while WT is an almost circular spheroid. N-cadherin-Venus signal is represented in pseudocolor “Fire” LUT. (B) An XY cross-section through the spheroids. A cross-section through the middle of the spheroid highlights the differences in cellular organization between WT, R14E and V81D/V174D. WT had orderly junctions throughout the XY-plane, while R14E was hollow on the inside as seen by the absence of junctions. Although in V81D/V174D junctions were present, they were not organized. (C) Surface generation of the spheroids after slicing them into half through XY. If junctions are present, they are represented in red. Compared to WT, the empty space inside R14E is apparent here too. Even though the morphologies of the WT, R14E and V81D/V174D spheroids are quite similar on a global scale, there is a dramatic difference between how the cells are organized within a spheroid highlighting the effect of any mutation on junction assembly in 3D.

References

    1. Gumbiner BM (2005) Regulation of cadherin-mediated adhesion in morphogenesis 6. Nature Publishing Group; pp. 622–634. doi:10.1038/nrm1699. - DOI - PubMed
    1. Brasch J, Harrison OJ, Honig B, Shapiro L (2012) Thinking outside the cell: how cadherins drive adhesion. Trends Cell Biol 22: 299–310. doi:10.1016/j.tcb.2012.03.004. PubMed: 22555008. - DOI - PMC - PubMed
    1. Pertz O, Bozic D, Koch AW, Fauser C, Brancaccio A et al. (1999) A new crystal structure, Ca2+ dependence and mutational analysis reveal molecular details of E-cadherin homoassociation. EMBO J 18: 1738–1747. doi:10.1093/emboj/18.7.1738. PubMed: 10202138. - DOI - PMC - PubMed
    1. Wiest MC, Eagleman DM, King RD, Montague PR (2000) Dendritic spikes and their influence on extracellular calcium signaling. J Neurophysiol 83: 1329–1337. PubMed: 10712460. - PubMed
    1. Harrison OJ, Bahna F, Katsamba PS, Jin X, Brasch J et al. (2010) Two-step adhesive binding by classical cadherins. Nat Struct Mol Biol, 17: 1–11. doi:10.1038/nsmb.1784. PubMed: 20190754. - DOI - PMC - PubMed