. 2013 Dec 3;8(12):e81944.
doi: 10.1371/journal.pone.0081944. eCollection 2013.

A coastal seawater temperature dataset for biogeographical studies: large biases between in situ and remotely-sensed data sets around the Coast of South Africa

Affiliations

A coastal seawater temperature dataset for biogeographical studies: large biases between in situ and remotely-sensed data sets around the Coast of South Africa

Albertus J Smit et al. PLoS One. .

Abstract

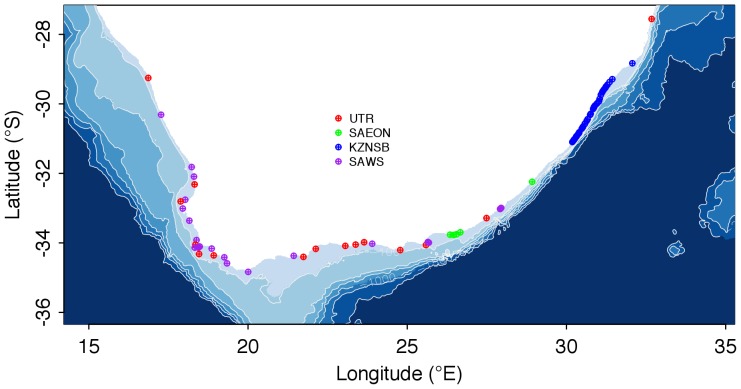
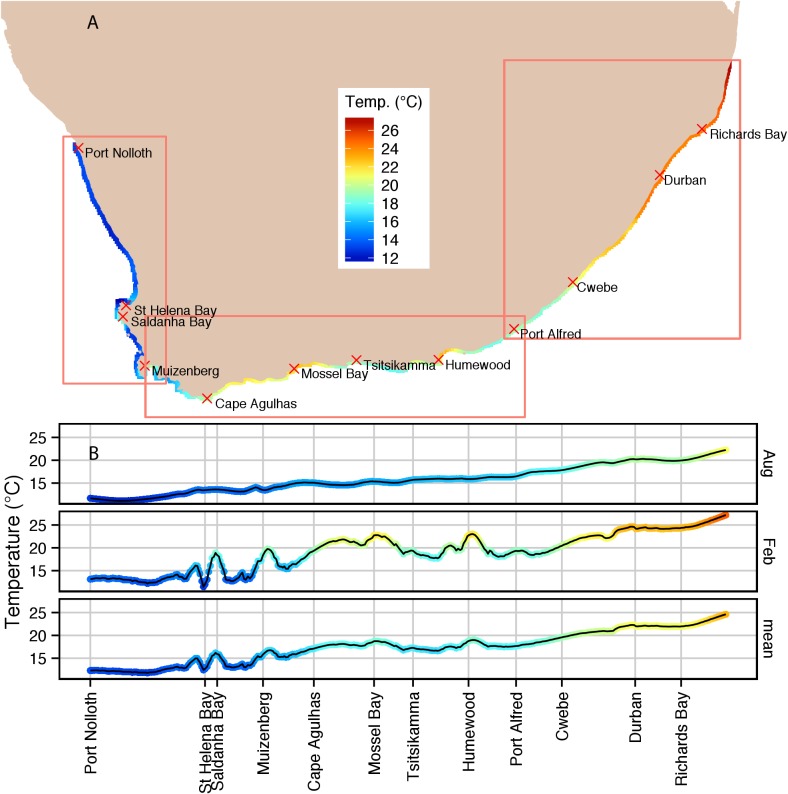
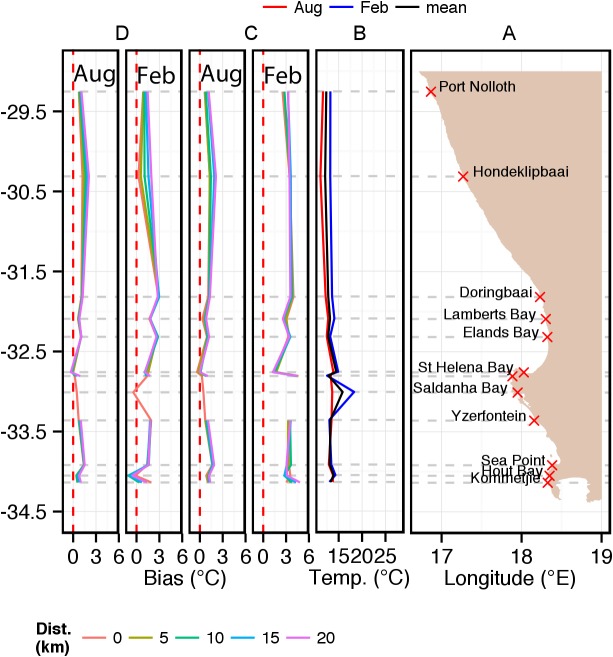
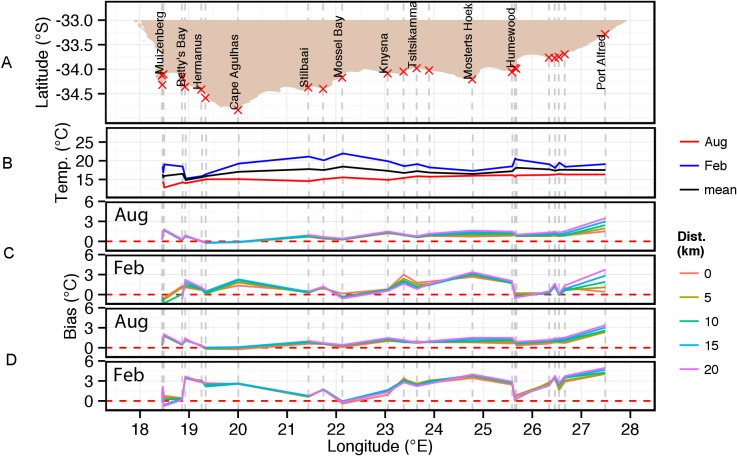
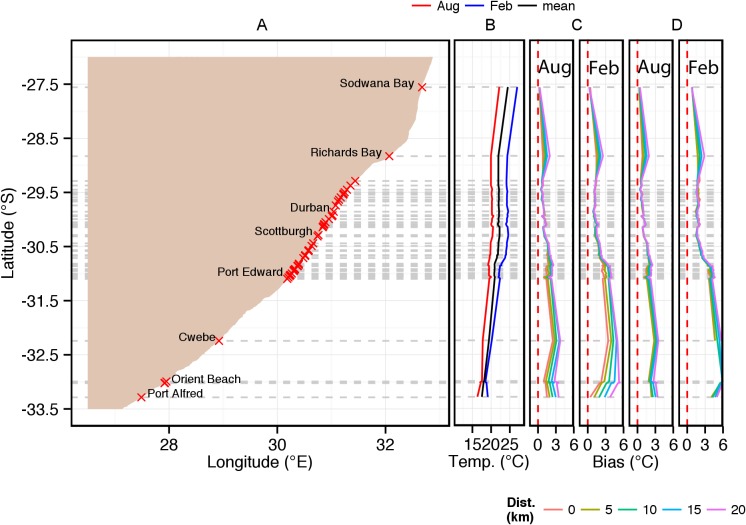
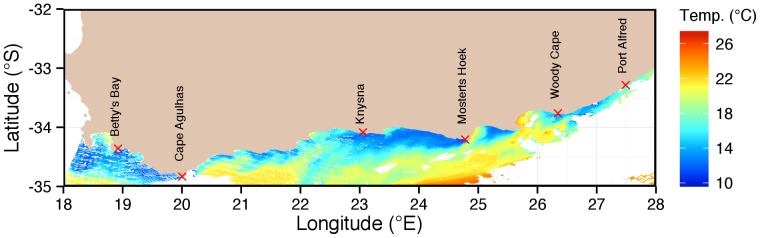
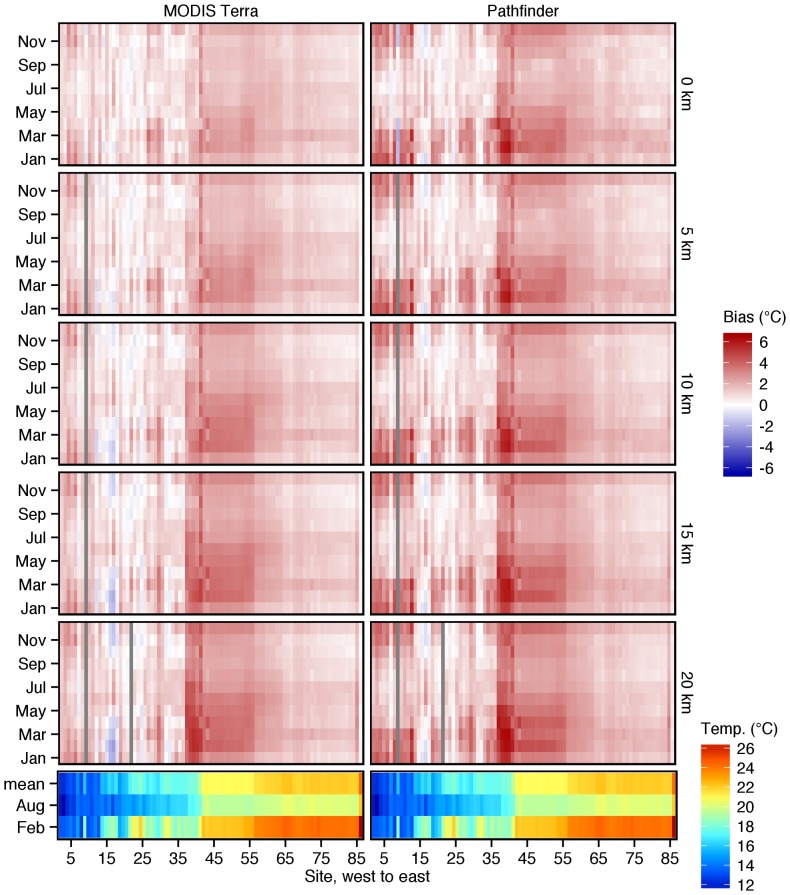
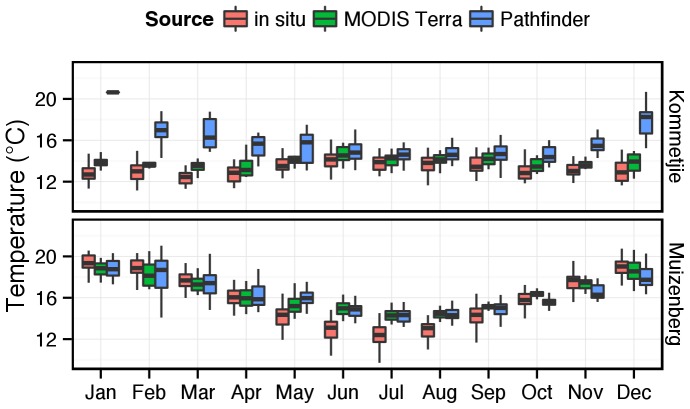
Gridded SST products developed particularly for offshore regions are increasingly being applied close to the coast for biogeographical applications. The purpose of this paper is to demonstrate the dangers of doing so through a comparison of reprocessed MODIS Terra and Pathfinder v5.2 SSTs, both at 4 km resolution, with instrumental in situ temperatures taken within 400 m from the coast. We report large biases of up to +6°C in places between satellite-derived and in situ climatological temperatures for 87 sites spanning the entire ca. 2 700 km of the South African coastline. Although biases are predominantly warm (i.e. the satellite SSTs being higher), smaller or even cold biases also appear in places, especially along the southern and western coasts of the country. We also demonstrate the presence of gradients in temperature biases along shore-normal transects - generally SSTs extracted close to the shore demonstrate a smaller bias with respect to the in situ temperatures. Contributing towards the magnitude of the biases are factors such as SST data source, proximity to the shore, the presence/absence of upwelling cells or coastal embayments. Despite the generally large biases, from a biogeographical perspective, species distribution retains a correlative relationship with underlying spatial patterns in SST, but in order to arrive at a causal understanding of the determinants of biogeographical patterns we suggest that in shallow, inshore marine habitats, temperature is best measured directly.


Conflict of interest statement

Competing Interests: The authors have declared that no competing interests exist.

Figures

Figure 1
Figure 1. Map showing coastal sites around South Africa where seawater temperature was measured using underwater temperature recorders (UTRs) and hand-help thermometers.
The legend indicates the institutions responsible for the instruments and data collections (see the Material and Methods for details). SST data were compiled in addition to the in situ data at each of the sites. Sites are numbered sequentially along the shore from the west coast to the east coast, and the numbers for selected sites are indicated on the figure.
Figure 2
Figure 2. (a) Interpolated summertime inshore in situ temperature data for the entire coast between measurement sites 1-87 (Port Nolloth to Sodwana Bay).
These same data are also plotted in the lower panel (b) to further highlight the alongshore gradients. The middle and upper panels in (b) show the seasonal mean monthly in situ temperature for August and February respectively representing winter and summer.
Figure 3
Figure 3. Alongshore seasonal trends (February  =  summer; August  =  winter) for in situ temperatures on the west coast of South Africa and concomitant biases in equivalent satellite-derived SST products: (a) indicates the locations of measurement sites; (b) in situ temperature with annual mean, summer and winter climatologies; (c, d) relative biases in the equivalent satellite-derived products of Pathfinder and MODIS Terra.
The coloured lines in (c) and (d) depict the bias measured at 0, 5, 10, 15 and 20 km from the coast (see key).
Figure 4
Figure 4. Alongshore seasonal trends (February  =  summer; August  =  winter) for in situ temperatures on the south coast of South Africa and concomitant biases in equivalent satellite-derived SST products: (a) indicates the locations of measurement sites; (b) in situ temperature with annual mean, summer and winter climatologies; (c, d) relative biases in the equivalent satellite-derived products of Pathfinder and MODIS Terra.
The coloured lines in (c) and (d) depict the bias measured at 0, 5, 10, 15 and 20 km from the coast (see key).
Figure 6
Figure 6. Alongshore seasonal trends (February  =  summer; August  =  winter) for in situ temperatures on the east coast of South Africa and concomitant biases in equivalent satellite-derived SST products: (a) indicates the locations of measurement sites; (b) in situ temperature with annual mean, summer and winter climatologies; (c, d) relative biases in the equivalent satellite-derived products of Pathfinder and MODIS Terra.
The coloured lines in (c) and (d) depict the bias measured at 0, 5, 10, 15 and 20 km from the coast (see key).
Figure 5
Figure 5. MODIS Terra satellite SST field on 4 March 2010 depicting coastal upwelling along the south coast of South Africa.
Note that the strongest upwelling occurs between Betty’s Bay–Cape Agulhas, Knysna–Mosters Hoek, and Cape Padrone–Great Fish River.
Figure 7
Figure 7. A raster image of MODIS Terra (left panels) and Pathfinder (right panels) biases with respect to in situ temperatures.
Sites, numbered sequentially from west to east, run down the columns, and the rows within the panels depict the months of the year. The upper five panel rows show the biases at various distances from the shore (0, 5, 10, 15 and 20 km). The brightly coloured bottom row of panels is the corresponding in situ temperatures, with mean, February and August in the rows, and sites going down the columns. Note that the bottom left and right panels are identical, and illustrate the same temperatures that are also shown in Figures 3, 4 and 6.
Figure 8
Figure 8. A local case study of two contrasting adjacent environments — False Bay (represented here by Muizenberg) which is an embayment mostly protected from coastal upwelling, and Kommetjie located on the exposed Atlantic side of the Cape Peninsula where wind-driven upwelling is prevalent.
The in situ temperatures and satellite-derived SST data (MODIS Terra and Patherfinder) are presented in the form of a whisker-box plot (± 1 SD around the mean).

References

    1. Blanchette CA, Melissa Miner C, Raimondi PT, Lohse D, Heady KE, et al. (2008) Biogeographical patterns of rocky intertidal communities along the Pacific coast of North America. Journal of Biogeography 35: 1593–1607.
    1. Tittensor DP, Mora C, Jetz W, Lotze HK, Ricard D, et al. (2010) Global patterns and predictors of marine biodiversity across taxa. Nature 466: 1098–1101. - PubMed
    1. Couce E, Ridgwell A, Hendy EJ (2012) Environmental controls on the global distribution of shallow-water coral reefs. Journal of Biogeography 39: 1508–1523.
    1. Byrne M, Ho M, Selvakumaraswamy P, Nguyen HD, Dworjanyn SA, et al. (2009) Temperature, but not pH, compromises sea urchin fertilization and early development under near-future climate change scenarios. Proceedings of the Royal Society B: Biological Sciences 276: 1883–1888. - PMC - PubMed
    1. van den Hoek C (1982) The distribution of benthic marine algae in relation to the temperature regulation of their life histories. Biological Journal of the Linnean Society 18: 81–144.

Publication types

LinkOut - more resources