

Increased adiposity in annexin A1-deficient mice
- PMID: 24312665
- PMCID: PMC3846785
- DOI: 10.1371/journal.pone.0082608
Increased adiposity in annexin A1-deficient mice
Abstract
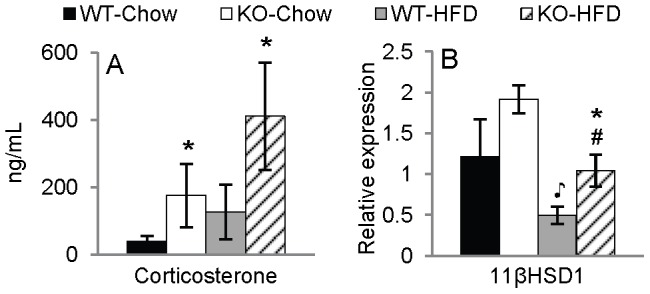
Production of Annexin A1 (ANXA1), a protein that mediates the anti-inflammatory action of glucocorticoids, is altered in obesity, but its role in modulation of adiposity has not yet been investigated. The objective of this study was to investigate modulation of ANXA1 in adipose tissue in murine models of obesity and to study the involvement of ANXA1 in diet-induced obesity in mice. Significant induction of ANXA1 mRNA was observed in adipose tissue of both C57BL6 and Balb/c mice with high fat diet (HFD)-induced obesity versus mice on chow diet. Upregulation of ANXA1 mRNA was independent of leptin or IL-6, as demonstrated by use of leptin-deficient ob/ob mice and IL-6 KO mice. Compared to WT mice, female Balb/c ANXA1 KO mice on HFD had increased adiposity, as indicated by significantly elevated body weight, fat mass, leptin levels, and adipocyte size. Whereas Balb/c WT mice upregulated expression of enzymes involved in the lipolytic pathway in response to HFD, this response was absent in ANXA1 KO mice. A significant increase in fasting glucose and insulin levels as well as development of insulin resistance was observed in ANXA1 KO mice on HFD compared to WT mice. Elevated plasma corticosterone levels and blunted downregulation of 11-beta hydroxysteroid dehydrogenase type 1 in adipose tissue was observed in ANXA1 KO mice compared to diet-matched WT mice. However, no differences between WT and KO mice on either chow or HFD were observed in expression of markers of adipose tissue inflammation. These data indicate that ANXA1 is an important modulator of adiposity in mice, with female ANXA1 KO mice on Balb/c background being more susceptible to weight gain and diet-induced insulin resistance compared to WT mice, without significant changes in inflammation.
Conflict of interest statement
Figures
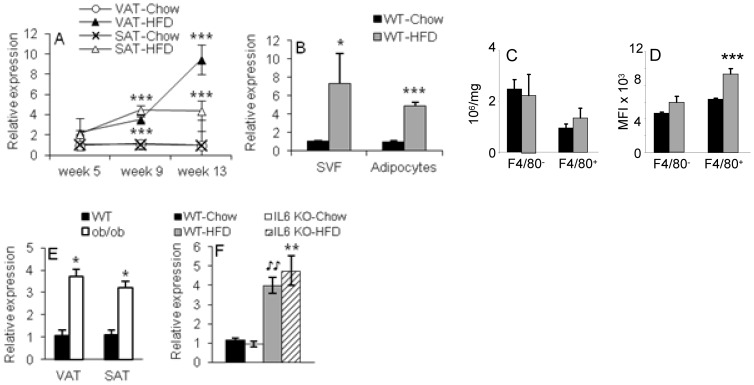
 p<.05 vs. WT-Chow. Data are mean ± SEM.
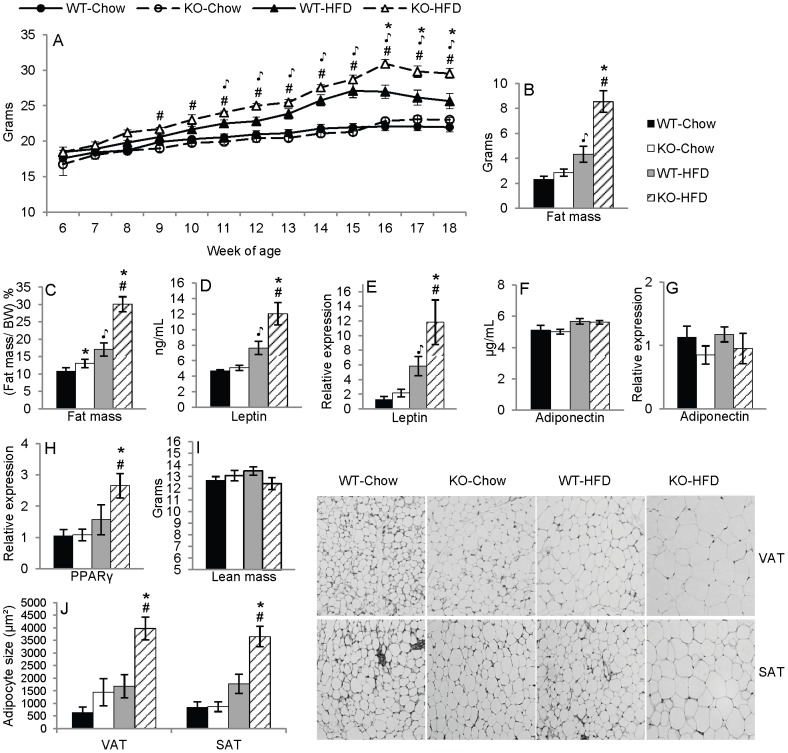
 p<.05 vs. WT-Chow, #p<.05 vs. KO-Chow. Data are mean ± SEM.
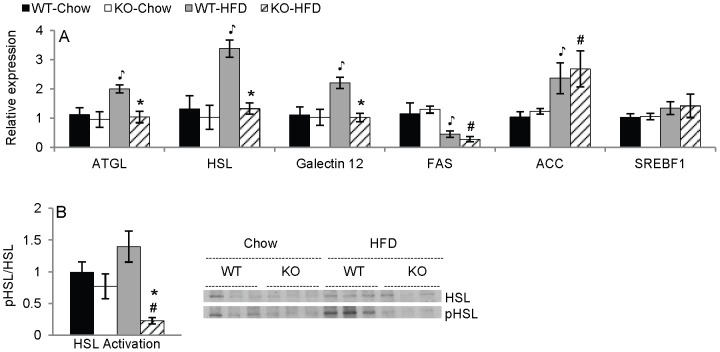
 p<.05 vs. WT-Chow, #p<.05 vs. KO-Chow. Data are mean ± SEM.
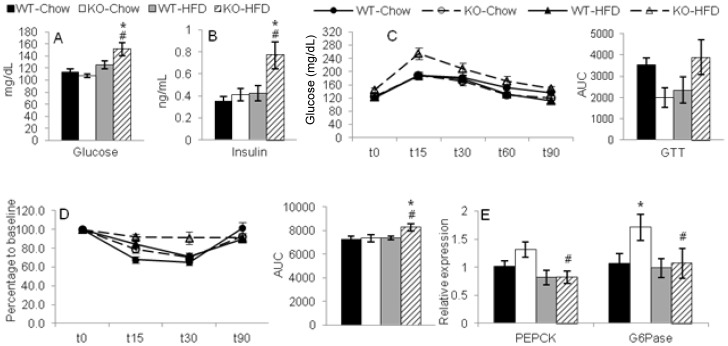
 p<.05 vs. WT-Chow, #p<.05 vs. KO-Chow. Data are mean ± SEM.
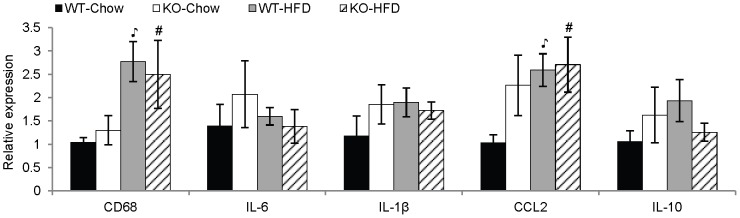
 p<.05 vs. WT-Chow, #p<.05 vs. KO-Chow. Data are mean ± SEM.
References
-
- Haslam D (2007) Obesity: a medical history. Obes Rev 8 Suppl 131–36. - PubMed
-
- de Heredia FP, Gomez-Martinez S, Marcos A (2012) Obesity, inflammation and the immune system. Proc Nutr Soc 71: 332–338. - PubMed
-
- Blackwell GJ, Carnuccio R, Di Rosa M, Flower RJ, Parente L, et al. (1980) Macrocortin: a polypeptide causing the anti-phospholipase effect of glucocorticoids. Nature 287: 147–149. - PubMed
-
- Crumpton MJ, Dedman JR (1990) Protein terminology tangle. Nature 345: 212. - PubMed
-
- Geisow MJ (1986) Common domain structure of Ca2+ and lipid-binding proteins. FEBS Lett 203: 99–103. - PubMed
Publication types
MeSH terms
Substances
Grants and funding
LinkOut - more resources
Full Text Sources
Other Literature Sources
Molecular Biology Databases
Research Materials
Miscellaneous
