. 2014 Feb;71(2):95-108.
doi: 10.1111/aji.12182. Epub 2013 Dec 6.

Phenotype and functionality of CD4+ and CD8+ T cells in the upper reproductive tract of healthy premenopausal women

Affiliations

Phenotype and functionality of CD4+ and CD8+ T cells in the upper reproductive tract of healthy premenopausal women

Uma Shanmugasundaram et al. Am J Reprod Immunol. 2014 Feb.

Abstract

Problem: The goal of this study was to investigate the phenotype and functional responsiveness of CD4(+) and CD8(+) T-cells in the upper reproductive tract of healthy premenopausal women. The lower reproductive tract is frequently studied as a site of sexually transmitted infections; however, the upper reproductive tract may also be a portal of entry and dissemination for pathogens, including HIV-1.

Method of study: Endometrial biopsy, endocervical curettage, cytobrush, and blood were collected during mid-luteal phase from 23 healthy women. T-cells were isolated and analyzed by flow cytometry.

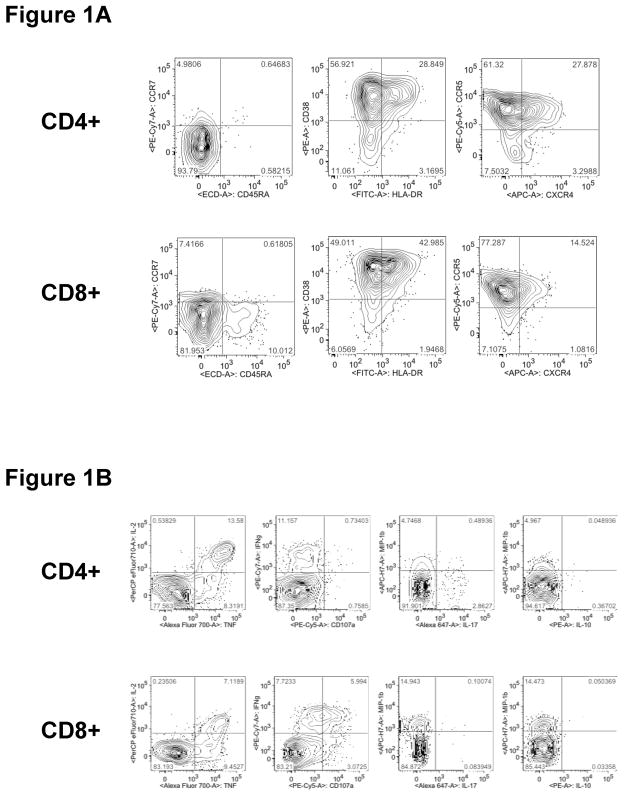
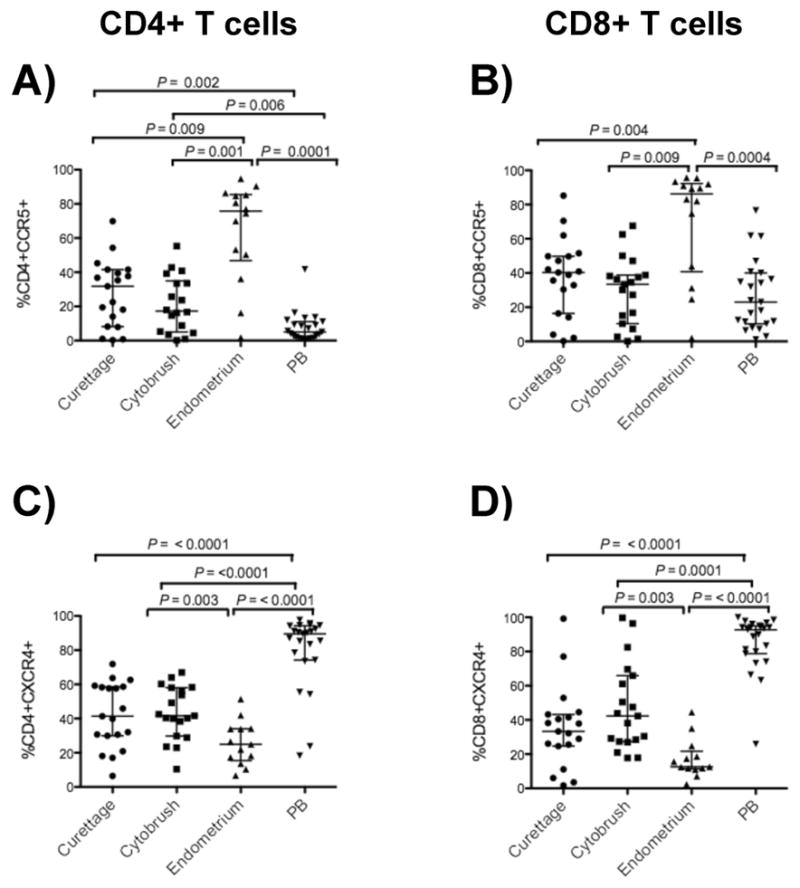
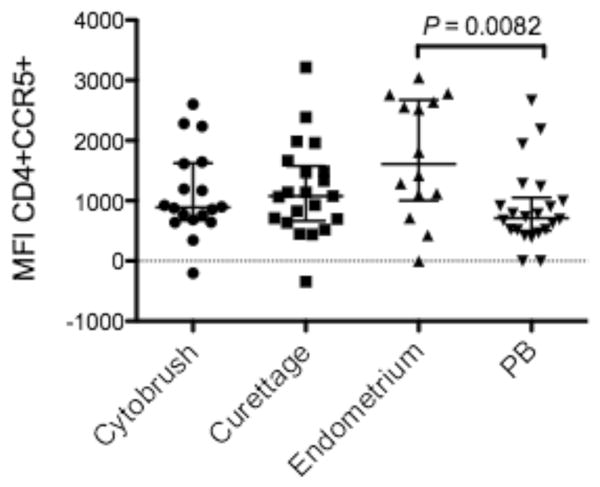
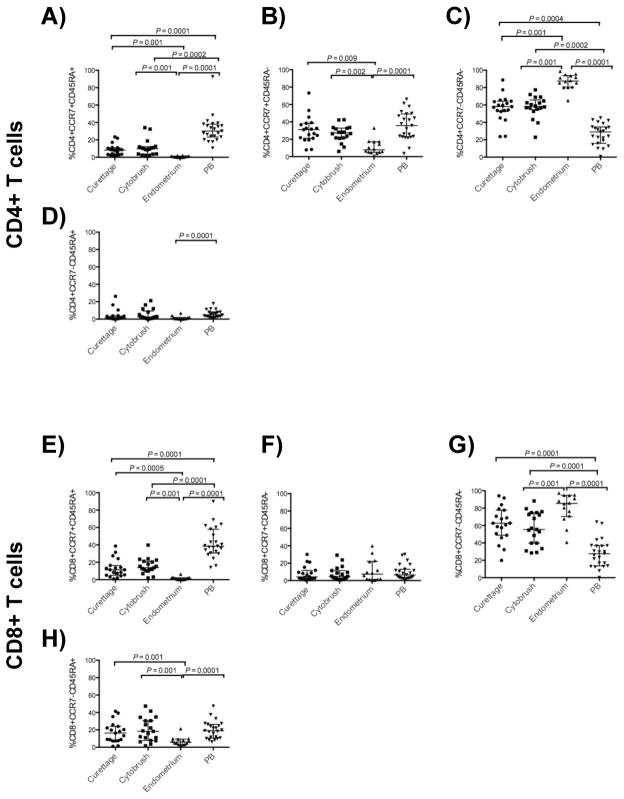
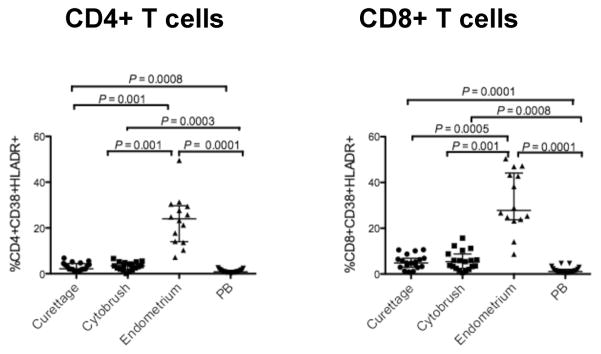
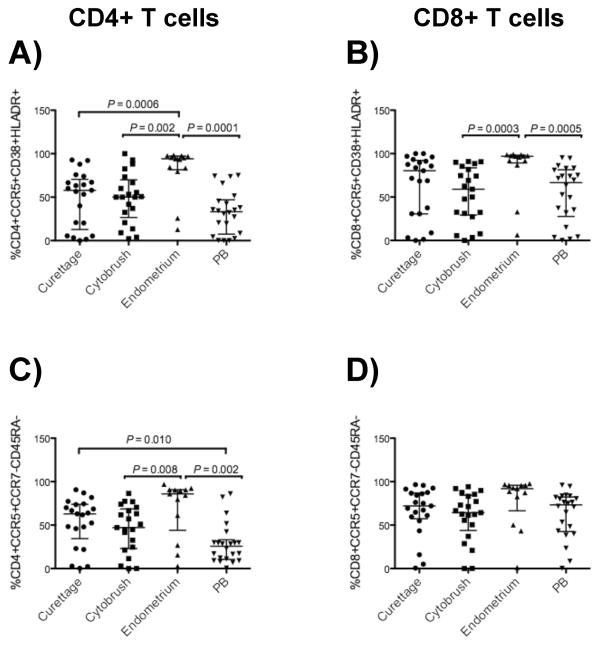
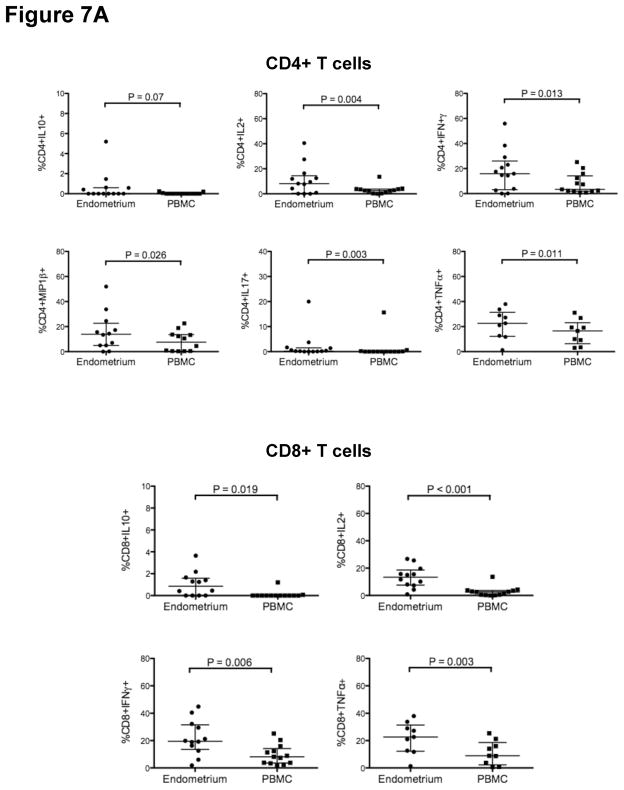
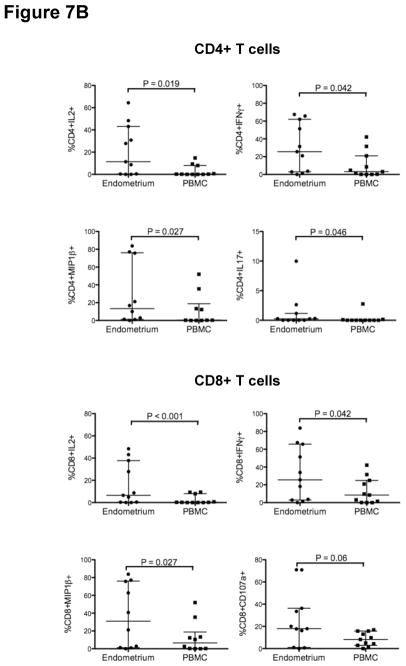
Results: As compared with their counterparts in blood, endometrial and endocervical T-cells had enhanced CCR5 expression, and were enriched for activated, effector memory cells. Endometrial T-cells were more responsive to polyclonal stimuli, producing a broad range of cytokines and chemokines.

Conclusion: These findings underscore the responsiveness of endometrial T-cells to stimulation, and reveal their activated phenotype. These findings also suggest susceptibility of the upper reproductive tract to HIV-1 infection.

Keywords: CTL; HIV; STD; T-cell; endocervix; endometrium.


Figures

Figure 1
Figure 1. Flow cytometry gating used in the analysis of endometrial T-cell phenotype and function
Panel (A): For phenotypic analysis, after initial gating of endometrial lymphocytes and doublet discrimination, viable cells were gated for CD3+CD66b− (not shown) and then for CD4+ (top row) and CD8+ (bottom row) T-cells. The resulting populations were gated for CD45RA, CCR7, CD38, HLA-DR, CCR5 and CXCR4. Panel (B): For analysis of endometrial T-cell responses to polyclonal stimulation, seven functional responses (CD107a, IL-2, IL-10, IL-17, TNF-α, IFN-γ and MIP-1β) were measured. Initial gating was performed to identify lymphocytes and doublet discrimination (not shown), followed by gating of viable cells on CD4+ (top row) and CD8+ (bottom row) T-cells, and finally for individual responses.
Figure 2
Figure 2. CCR5-expressing T-cells were enriched in endometrium compared to endocervix and peripheral blood (PB)
The figures show the percentages of CD4+ (left panels A, C) and CD8+ T-cells (right panels B, D) from curettage, cytobrush, endometrium and peripheral blood (PB) expressing CCR5 and CXCR4. Horizontal lines correspond to the median values and the vertical lines and whiskers represent 25th and 75th percentiles. Two tailed Mann-Whitney tests and Holms’ sequential Bonferroni corrections were performed.
Figure 3
Figure 3. Median fluorescence intensity (MFI) of CCR5 on CD4+ T-cells
CCR5 MFI was significantly higher on CD4+ T-cells in endometrium compared to PB. Similar trends were observed when comparing endocervical curettage CD4+ T-cells vs PB (P=0.09) and endometrial vs endocervical cytobrush CD4+ T-cells (P = 0.05). MFI was calculated using FlowJo software (Tree Star, Inc., Ashland, OR). Horizontal lines correspond to the median values; vertical lines and whiskers represent 25th and 75th percentiles. Two tailed Mann-Whitney tests and Holms’ sequential Bonferroni corrections were performed.
Figure 4
Figure 4. Endometrial CD4+ and CD8+ T-cells display a memory phenotype
The figure shows percentages of CD4+ (upper panels, A–D) and CD8+ (lower panels, E–H) T-cells with the phenotypes CCR7+CD45RA+ (naïve), CCR7+CD45RA− (central memory), CCR7−CD45RA− (effector memory), and CCR7−CD45RA+ (terminally differentiated memory) from curettage, cytobrush, endometrium and peripheral blood (PB). Horizontal lines correspond to median values; vertical lines and whiskers represent the 25th and 75th percentiles. For statistical analysis, two-tailed Mann-Whitney tests were performed with Holms’ sequential Bonferroni corrections.
Figure 5
Figure 5. Endometrial CD4+ and CD8+ T cells are highly activated
The figure shows the percentage of CD4+ (left, A) and CD8+ (right, B) T-cells expressing CD38 and HLA-DR from curettage, cytobrush, endometrium and PB. Horizontal lines correspond to median values; vertical lines and whiskers represent the 25th and 75th percentiles. For statistical analysis, two-tailed Mann-Whitney tests and Holms’ sequential Bonferroni corrections were performed.
Figure 6
Figure 6. Enhanced CCR5-expressing activated and effector memory CD4+ and CD8+ T-cells in endometrium
Shown here are the frequencies of CD4+ (left panels, A and C) and CD8+ (right panels, B and D) T-cells with the phenotypes CCR5+CD38+HLADR+ and CCR5+CCR7−CD45RA−. Horizontal lines correspond to median values; vertical lines and whiskers represent the 25th and 75th percentiles. Two-tailed Mann-Whitney tests and Holms’ sequential Bonferroni corrections were performed for statistical analysis.
Figure 7
Figure 7. Endometrial T-cells are highly responsive to polyclonal stimulation
Figure 7A shows the percentage of endometrial and PB CD4+ (upper panels) and CD8+ T cells (lower panels) responding to staphylococcus enterotoxin B (SEB) stimulation. Figure 7B shows the percentage of endometrial and PB CD4+ (left) and CD8+ T-cells (right) responding to phorbol myristate acetate (PMA) and ionomycin (ION) stimulation. Horizontal lines correspond to median values; vertical lines and whiskers denote the 25th and 75th percentiles. Statistical analyses were performed using Wilcoxon-matched pairs signed rank test and P values ≤0.05 were considered significant.

References

    1. Miller L, Patton DL, Meier A, Thwin SS, Hooton TM, Eschenbach DA. Depomedroxyprogesterone-induced hypoestrogenism and changes in vaginal flora and epithelium. Obstetrics and gynecology. 2000;96:431–439. - PubMed
    1. Norvell MK, Benrubi GI, Thompson RJ. Investigation of microtrauma after sexual intercourse. The Journal of reproductive medicine. 1984;29:269–271. - PubMed
    1. Kaushic C. HIV-1 infection in the female reproductive tract: role of interactions between HIV-1 and genital epithelial cells. Am J Reprod Immunol. 2011;65:253–260. - PubMed
    1. Wira CR, Fahey JV, Sentman CL, Pioli PA, Shen L. Innate and adaptive immunity in female genital tract: cellular responses and interactions. Immunol Rev. 2005;206:306–335. - PubMed
    1. Wira CR, Fahey JV. A new strategy to understand how HIV infects women: identification of a window of vulnerability during the menstrual cycle. AIDS. 2008;22:1909–1917. - PMC - PubMed

Publication types