. 2013 Dec 6;20(1):90.
doi: 10.1186/1423-0127-20-90.

Caspase 3 involves in neuroplasticity, microglial activation and neurogenesis in the mice hippocampus after intracerebral injection of kainic acid

Affiliations

Caspase 3 involves in neuroplasticity, microglial activation and neurogenesis in the mice hippocampus after intracerebral injection of kainic acid

Tsai-Teng Tzeng et al. J Biomed Sci. .

Abstract

Background: The roles of caspase 3 on the kainic acid-mediated neurodegeneration, dendritic plasticity alteration, neurogenesis, microglial activation and gliosis are not fully understood. Here, we investigate hippocampal changes using a mouse model that receive a single kainic acid-intracerebral ventricle injection. The effects of caspase 3 inhibition on these changes were detected during a period of 1 to 7 days post kainic acid injection.

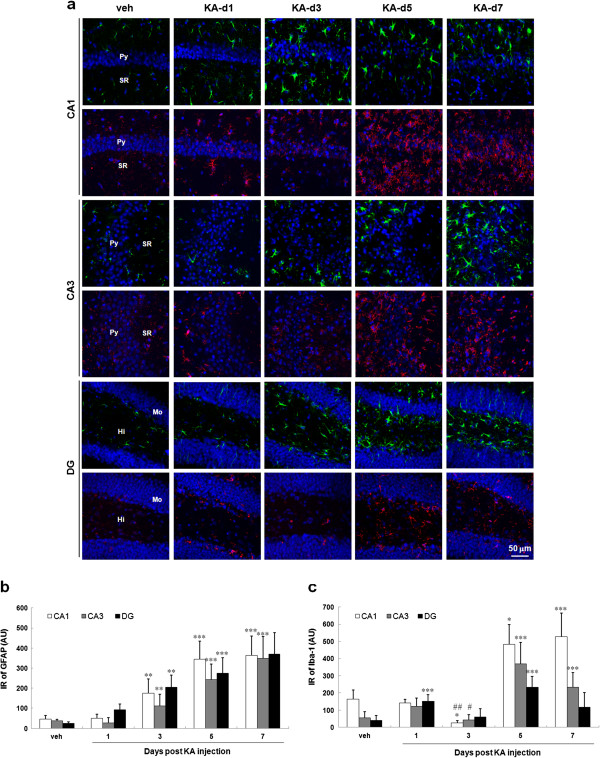
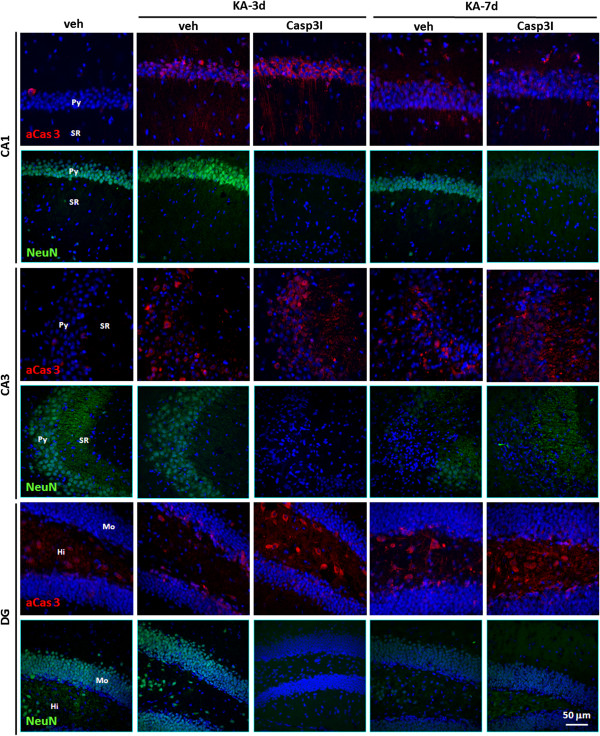
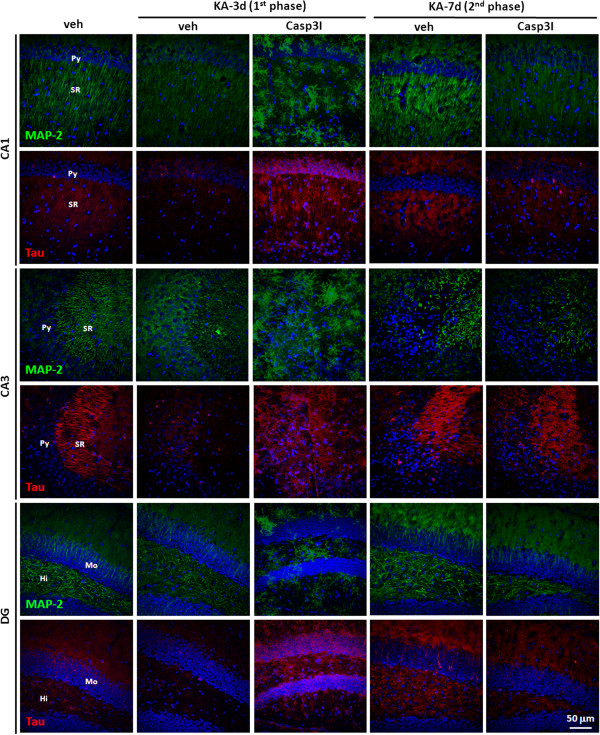
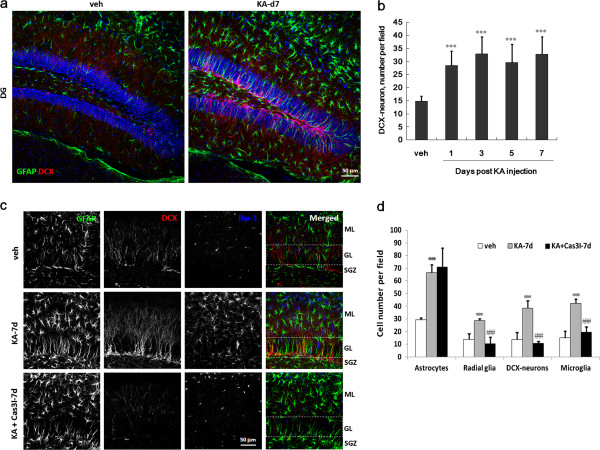
Result: Neurodegeneration was assessed by Fluoro-Jade B staining and neuronal nuclei protein (NeuN) immunostaining. Neurogenesis, gliosis, neuritic plasticity alteration and caspase 3 activation were examined using immunohistochemistry. Dendritic plasticity, cleavvage-dependent activation of calcineurin A and glial fibrillary acidic protein cleavage were analyzed by immunoblotting. We found that kainic acid not only induced neurodegeneration but also arouse several caspase 3-mediated molecular and cellular changes including dendritic plasticity, neurogenesis, and gliosis. The acute caspase 3 activation occurred in pyramidal neurons as well as in hilar interneurons. The delayed caspase 3 activation occurred in astrocytes. The co-injection of caspase 3 inhibitor did not rescue kainic acid-mediated neurodegeneration but seriously and reversibly disturb the structural integrity of axon and dendrite. The kainic acid-induced events include microglia activation, the proliferation of radial glial cells, neurogenesis, and calcineurin A cleavage were significantly inhibited by the co-injection of caspase 3 inhibitor, suggesting the direct involvement of caspase 3 in these events. Alternatively, the kainic acid-mediated astrogliosis is not caspase 3-dependent, although caspase 3 cleavage of glial fibrillary acidic protein occurred.

Conclusions: Our results provide the first direct evidence of a causal role of caspase 3 activation in the cellular changes during kainic acid-mediated excitotoxicity. These findings may highlight novel pharmacological strategies to arrest disease progression and control seizures that are refractory to classical anticonvulsant treatment.


Figures

Figure 1
Figure 1
The neurodegeneration in the hippocampus of the KA-icv-injected mice. CD-1 mice received KA-icv-injections and were sacrificed at day 1, 3, 5, and 7 post KA-injection (KA-d1, KA-d3, KA-d5, and KA-d7). For control, the mice were sacrificed at day 7 post vehicle-injection (veh). The neurodegeneration in the ipsilateral side of CA1, CA3, and DG was examined by FJB-staining (FJB, green) and immunostaining with anti-NeuN (NeuN, red) antibody. Cell nuclei were stained with Hoechst 33258 (blue). Panel (a) shows the representative fluorescent images of the ipsilateral side of CA1, CA3 and DG. The location of pyramidal layer (Py), striatum radiatum (SR). Molecular layer (Mo), and Hilus (Hi) are indicated in the images of the left lane of the panels. The number of FJB-positive (b) and NeuN-positive (c) neurons in the ipsilateral side of CA1 (white columns), CA3 (grey columns), and DG (black columns) were calculated using MetaMorph software. The results are the mean ± S.D. from 8 images. The data in panel (b) are the percentages relative to the day 1 post injection. The data in panel (c) are the percentages relative to the vehicle injection. Significant differences between day 1 post injection and day 3, 5 and 7 post injection in panel (b) are indicated by #, P < 0.001. Significant differences between vehicle injection and KA injection in panel (c) are indicated by *, P < 0.001.
Figure 2
Figure 2
The caspase 3 activation in the hippocampus of the KA-icv-injected mice. CD-1 mice received KA-icv-injections and were sacrificed at day 1, 3, 5, and 7 post KA-injection (KA-d1, KA-d3, KA-d5, and KA-d7). For control, the mice were sacrificed at day 7 post vehicle-injection (veh). The caspase 3 activation and the reactive astrocytes in the ipsilateral side of CA1, CA3, and DG was examined by immunostaining with anti-active caspase 3 (aCas3, red) and anti-GFAP (green) antibodies. Cell nuclei were stained with Hoechst 33258 (blue). Panel (a) shows the representative photograph of the partial co-localization of active caspase 3 (aCas3) and GFAP in the ipsilateral side of CA1and DG at day 5 and 7 post KA-injection. The location of pyramidal layer (Py), striatum radiatum (SR). Molecular layer (Mo), and Hilus (Hi) are indicated in left lane of the panels. Arrows indicate the representative colocalization of aCas3-IR with astrocytes and radial glial cells in CA1 and DG, respectively. Arrow heads indicate the activation of capsease 3 in pyramidal neurons in CA1. The IR of non-astroglial (b), astroglial (c) active caspase 3 in the ipsilateral side of CA1 (white columns), CA3 (grey columns), and DG (black columns) were calculated using MetaMorph software. The data are presented as the percentage relative to the vehicle injection. The results are the mean ± S.D. from 8 images. The data are the percentages relative to the vehicle injection. Significant differences between vehicle injection and KA injection are indicated by ***, P < 0.001.
Figure 3
Figure 3
The microglial activation in the hippocampus of KA-icv-injected mice. CD-1 mice received KA-icv-injections and were sacrificed at day 1, 3, 5, and 7 post KA-injection (KA-d1, KA-d3, KA-d5, KA-d7). For control, the mice were sacrificed at day 7 post vehicle-injection (veh). The microglial activation in the ipsilateral side of CA1, CA3, and DG was examined by immunostaining with anti-Iba-1 (red) and anti-GFAP (green) antibodies. Cell nuclei were stained with Hoechst 33258 (blue). The representative images of the ipsilateral side of CA1, CA3 and DG area are shown (a). The location of pyramidal layer (Py), striatum radiatum (SR). Molecular layer (Mo), and Hilus (Hi) are indicated in the left lane of the panels. The IR of GFAP (b) and Iba-1 (c) in 250 μm × 250 μm field in CA1 (white columns), CA3 (gray columns) and DG (black columns) were calculated. The results are the mean ± S.D. from 8 images. Significant differences between the control (veh) and the KA injection are indicated by *, P < 0.05; **, P < 0.01; ***, P < 0.001. Significant differences between day 1 post KA injection and day 3 post KA injection in panel d are indicated by #, P < 0.05; ##, P < 0.01.
Figure 4
Figure 4
Caspase 3 inhibitor does not prevent the neurodegeneration in the hippocampus of the KA-icv-injected mice. CD-1 mice received KA-icv-injections alone or co-injection of KA and caspase 3 inhibitor (Cas3I) or vehicle (veh), and were sacrificed at day 3 and 7 post KA-injection (KA-d3 and KA-d7). For control, the mice were sacrificed at day 7 post vehicle-injection (veh). The neurodegeneration in the ipsilateral side was examined by immunostaining with anti-active caspase 3 (aCas 3, red) and anti-NeuN (NeuN, green) antibodies. Cell nuclei were stained with Hoechst 33258 (blue). The representative fluorescent images of the ipsilateral side of CA1, CA3 and DG are shown. The location of pyramidal layer (Py), striatum radiatum (SR). Molecular layer (Mo), and Hilus (Hi) are indicated in the left lane of the panels.
Figure 5
Figure 5
Caspase 3 inhibitor, but not KA, induces a reversible neuritic alteration in the hippocampus of the KA-icv-injected mice. CD-1 mice received KA-icv-injections alone or co-injection of KA and caspase 3 inhibitor (Cas3I) or vehicle (veh), and were sacrificed at day 3 and 7 post KA-injection (KA-d3 and KA-d7). For control, the mice were sacrificed at day 7 post vehicle-injection (veh). The neurites in the ipsilateral side of CA1 was examined by immunostaining with anti-MAP-2 (green) and anti tau-protein (Tau, red) antibodies. Cell nuclei were stained with Hoechst 33258 (blue). The representative fluorescent images of the ipsilateral side of CA1 are shown. The location of pyramidal layer (Py), striatum radiatum (SR). Molecular layer (Mo), and Hilus (Hi) are indicated in the left lane of the panels.
Figure 6
Figure 6
The cleavage of GFAP in the hippocampus of KA-icv-injected mice is caspase 3 dependent. (a) CD-1 mice received KA-icv-injections and were sacrificed at day 1, 3, 5, and 7 post KA-injection. For control, the mice were sacrificed at day 7 post vehicle-injection (veh). Hippocampus was removed and homogenized, and the lysates were analyzed by immunoblotting. The top part shows a representative immunoblot of the full length GFAP (52 kD) and its proteolytic fragments (45 and 40 kD). β-actin was used as internal standard. The bottom panel shows the level of total GFAP protein (black columns), 45 kDa-fragment (gray columns) and 40 kDa-fragment (white columns) relative to the level of 52-kD GFAP in vehicle treated mice (veh). The results are the mean ± S.D. from five independent experiments. Significant differences between the control (veh) and the KA injection are indicated by *, P < 0.05; **, P < 0.01; ***, P < 0.001. (b) ICR mice received KA-icv-injections alone or co-injection of KA and caspase 3 inhibitor (Cas3I) or vehicle (veh), and were sacrificed at day 3 and 7 post KA-injection. Hippocampal lysates were analyzed by immunoblotting. The top panel shows a representative immunoblot of GFAP and its fragments. β-actin was used as internal standard. The bottom panel shows the level of the 40 kD fragment at day 3 and 7 post KA-injection relative to the level of 40-kD GFAP in the control (veh). The results are the mean ± S.D. from three independent experiments. Significant differences between the mice treated with and without caspase 3 inhibitor are indicated by ***, P < 0.001.
Figure 7
Figure 7
The alteration of the neuroplasticity-related proteins in the hippocampus of KA-icv-injected mice is caspase 3 dependent. CD-1 mice received KA-icv-injections and were sacrificed at day 1, 3, 5, and 7 post KA-injection. For control, the mice were sacrificed at day 7 post vehicle-injection (veh). Hippocampus The homogenate and PSD domain of hippocampus were prepared. The GluR2, GluR1, NR-1 and SAP-102 of PSD domain (a) and CN-A of total hippocampal homogenate (b) were analyzed by immunoblotting. (c) CD-1 mice received KA-icv-injections alone or co-injection of KA and caspase 3 inhibitor (Cas3I) or vehicle (veh), and were sacrificed at day 3 or 7 post KA-injection (KA-d3 and KA-d7). Hippocampal lysates were analyzed by immunoblotting. PSD-95 and β-actin were used as internal standard for (a) and (b, c), respectively. The top part is the representative immunoblots. The bottom part in (a) is the ratio of proteins/PSD-95 relative to the ratio of the control (veh). The bottom part in (b) and (c) show the percentage of the level of 65 kD (open circles) and 36 kD (closed circles) relative to the level of 65 kD in the control (veh). Results are mean ± S.D. from five independent experiments. Significant differences between the control (veh) and KA injection in (a, b) are indicated by *, P < 0.001. Significant differences between the mice injected with and without caspase 3 inhibitor in (c) are indicated by *, P < 0.001.
Figure 8
Figure 8
Caspase 3 inhibitor prevents the KA-promoted hippocampal neurogenesis and microglial activation, but not astrogliosis, in the KA-icv-injected mice. CD-1 mice received KA-icv-injections and were sacrificed at day 1 to 7 post KA-injection. For control, the mice were sacrificed at day 7 post vehicle-injection (veh). (a and b) The neurogenesis and astrogliosis in the ipsilateral side of DG was examined by anti-DCX (red) and anti-GFAP (green) antibodies. Cell nuclei were stained with Hoechst 33258 (blue). Panel (a) shows the representative GFAP and DCX fluorescent images of DG at day 7 post KA-injection as compared with vehicle injection. Panel (b) shows the calculated number of DCX-positive neurons in 250 μm × 250 μm field. The data are represented as the percentage related to the control (veh). (c and d) CD-1 mice received KA-icv-injections alone (KA-7d) or co-injection of KA with caspase 3 inhibitor (KA + Cas3I-7d) or vehicle (veh), and were sacrificed at day 7 post KA-injection. The neurogenesis, microglial activation and astrogliosis in the suprapyramidal blade of DG was examined by anti-DCX (red), anti-GFAP (green) and anti-Iba-1 (blue) antibodies, respectively. Panel (c) shows the representative fluorescent images of GFAP, DCX and Iba-1 of DG at day 7 post KA-injection as compared with vehicle injection. The dotted lines define the molecular layer (ML), granular layer (GL) and subgranular zone (SGZ) of DG. Panel (d) shows the calculated number of DCX-positive neurons in the 250 μm × 250 μm field. The results are the mean ± S.D. from 8 images. Significant differences between the control (veh) and the KA injection are indicated by ***, P < 0.001. Significant differences between the KA injection alone and the co-injection of KA and caspase 3 inhibitor are indicated by ###, P < 0.001.

References

    1. Pitkanen A, Sutula TP. Is epilepsy a progressive disorder? Prospects for new therapeutic approaches in temporal-lobe epilepsy. Lancet Neurol. 2002;20:173–181. doi: 10.1016/S1474-4422(02)00073-X. - DOI - PubMed
    1. McNamara JO, Huang YZ, Leonard AS. Molecular signaling mechanisms underlying epileptogenesis. Sci STKE. 2006;20:re12. - PubMed
    1. Pitkanen A, Kharatishvili I, Karhunen H, Lukasiuk K, Immonen R, Nairismagi J, Grohn O, Nissinen J. Epileptogenesis in experimental models. Epilepsia. 2007;20(Suppl 2):13–20. - PubMed
    1. Rakhade SN, Jensen FE. Epileptogenesis in the immature brain: emerging mechanisms. Nat Rev Neurol. 2009;20:380–391. doi: 10.1038/nrneurol.2009.80. - DOI - PMC - PubMed
    1. Aroniadou-Anderjaska V, Fritsch B, Qashu F, Braga MF. Pathology and pathophysiology of the amygdala in epileptogenesis and epilepsy. Epilepsy Res. 2008;20:102–116. doi: 10.1016/j.eplepsyres.2007.11.011. - DOI - PMC - PubMed

Publication types