. 2013 Dec 3;105(11):2439-50.
doi: 10.1016/j.bpj.2013.09.057.

Long-lived intracellular single-molecule fluorescence using electroporated molecules

Affiliations

Long-lived intracellular single-molecule fluorescence using electroporated molecules

Robert Crawford et al. Biophys J. .

Abstract

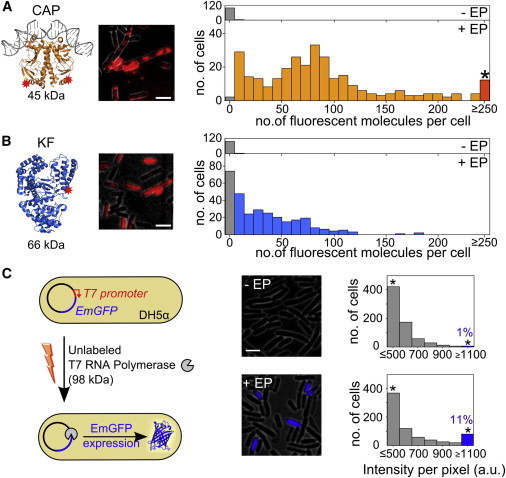
Studies of biomolecules in vivo are crucial to understand their function in a natural, biological context. One powerful approach involves fusing molecules of interest to fluorescent proteins to study their expression, localization, and action; however, the scope of such studies would be increased considerably by using organic fluorophores, which are smaller and more photostable than their fluorescent protein counterparts. Here, we describe a straightforward, versatile, and high-throughput method to internalize DNA fragments and proteins labeled with organic fluorophores into live Escherichia coli by employing electroporation. We studied the copy numbers, diffusion profiles, and structure of internalized molecules at the single-molecule level in vivo, and were able to extend single-molecule observation times by two orders of magnitude compared to green fluorescent protein, allowing continuous monitoring of molecular processes occurring from seconds to minutes. We also exploited the desirable properties of organic fluorophores to perform single-molecule Förster resonance energy transfer measurements in the cytoplasm of live bacteria, both for DNA and proteins. Finally, we demonstrate internalization of labeled proteins and DNA into yeast Saccharomyces cerevisiae, a model eukaryotic system. Our method should broaden the range of biological questions addressable in microbes by single-molecule fluorescence.


Figures

Figure 1
Figure 1
Electroporation of fluorescent DNA into living bacteria. (A) Schematic of internalization and observation methods. Fluorescent molecules are incubated with electrocompetent E. coli before electroporation. Cells are recovered, washed, and placed on agarose pads for imaging. (B) Overlay of inverted WL and fluorescence images of E. coli electroporated with 10 pmol dsDNA labeled with a green (Cy3B, left) or red (ATTO647N, right) fluorophore. +EP (top): electroporated cells, most with significant fluorescence. −EP (bottom): nonelectroporated cells, with negligible fluorescence. (C) Cell viability after electroporation at 1.8 kV/cm field strength. WL (left), fluorescence (middle), and overlay (right) of cells electroporated with 100 pmol ATTO647N-labeled dsDNA at 0 and 60 min after recovery, deposited on coverslips, and grown in rich media at 37°C while observed using WF fluorescence imaging. Approximately 50% of electroporated cells (182 out of 362) divide within 60 min (e.g., green ovals), ∼45% do not divide (e.g., blue oval), and <5% lose their integrity as judged by changes in their shape in the WL image (e.g., red oval). Cell viability is independent of cell loading. Scale bars: 3 μm.
Figure 2
Figure 2
Counting internalized molecules. (A) Single-cell bleaching analysis. Examples of fluorescence intensity time traces (blue: raw data; red: HMM fit; insets: WL and fluorescence images of E. coli loaded with ATTO647N-labeled dsDNA before and after bleaching). Top: single-step bleaching event. Middle: step analysis of cell containing ∼3 molecules showing bleaching and blinking. Bottom: step analysis showing ∼4 steps corresponding to diffusing molecules. (B) Histogram of single-step height intensities from HMM-fitted steps from 57 cells (N < 6) as in panel A. Single Gaussian fit is centered at 11 ± 3 a.u., corresponding to a unitary fluorophore intensity of 8100 photons per second (Methods). (C) Histogram of internalized molecules per cell electroporated with different amounts of ATTO647N dsDNA, calculated after dividing the initial fluorescence intensity by the unitary fluorophore intensity. Top to bottom: empty cells (i.e., nonincubated with fluorescent molecules and nonelectroporated), nonelectroporated (but incubated with fluorescent molecules), and electroporated cells incubated with 10 and 100 pmol dsDNA. Empty and nonelectroporated cells correspond to autofluorescence, whereas electroporated cells show a broad distribution of internalized molecules, with a higher proportion of highly loaded cells at 100 pmol (asterisk-marked bin). Internalization efficiency (defined as the fraction of cells showing higher fluorescence than the mean of the nonelectroporated sample plus three times the standard deviation of the nonelectroporated sample) for the 10 and 100 pmol samples: 94% and 90%, respectively. Mean number of internalized molecules per cell: 121 ± 106 molecules for 10 pmol dsDNA, and 176 ± 187 molecules for 100 pmol dsDNA. Settings: 100 ms exposure, WF illumination. Scale bars: 1 μm. To see this figure in color, go online.
Figure 3
Figure 3
Single-molecule tracking of electroporated DNA in live bacteria. (A) Time traces and trajectories of internalized Cy3B-labeled DNA (top) and Alexa647-labeled DNA (bottom). Single-molecule photon-count time traces represent the PSF integrals fitted with 2D elliptical Gaussian above background level (blue). Tracks end due to dye bleaching (orange line, asterisk) as no PSF can be fitted by localization algorithm. Apparent diffusion coefficient time traces (blue; from squared displacements of each step) show fluctuations mainly due to diffusion. Time-colored trajectories show long tracks of single molecules exploring the cell volume (gray boundary). Settings: 15 ms exposure, WF illumination. All scale bars: 1 μm. (B) Apparent diffusion coefficient histogram for Cy3B-labeled DNA (left; 2117 tracks, 30 cells, mean D ∼0.92 μm2/s, std: 0.61 μm2/s) and Alexa647-labeled DNA (right; 1214 tracks, 60 cells, mean D ∼0.76 μm2/s, std: 0.55 μm2/s) calculated from mean squared displacement of each track. Settings: 10 ms exposure, nTIRF illumination. (C) Single-cell bleaching of internalized DNA labeled with ATTO647N. Main: Two examples of fluorescence time traces (gray). Photobleaching curves were fitted to a double exponential (red), with larger decay constant defined as the in vivo photobleaching lifetime. Inset: Histogram of photobleaching lifetimes from 309 cells, showing a mean of ∼1.8 min. Settings: 100 ms exposure, nTIRF illumination. (D) Observation of long-lived fluorescence from ATTO647N-labeled DNA. Examples of single-molecule time traces using 50-ms (top) and 100-ms (bottom) exposures for immobile or slowly diffusing molecules that last for up to 8 min. WL and fluorescence images of loaded cell before and after bleaching (nTIRF illumination). To see this figure in color, go online.
Figure 4
Figure 4
Protein internalization in live bacteria. (AB) Cells electroporated with two Alexa647-labeled proteins: panel A, CAP (45 kDa) and panel B, KF of DNA polymerase I (KF, 66 kDa). Left: ribbon representation of the proteins (orange or blue) and DNA (gray). Labeling sites shown as red stars. Middle: fluorescence overlay of loaded cells. Right: Histogram of internalized fluorescent molecules per cell electroporated with 10 pmol protein. −/+ EP denotes incubation without/with electroporation. CAP and KF show up to ∼99% and 84% internalization efficiency (defined as in Fig. 2C). The number of internalized fluorescent molecules refers both to labeled proteins molecules and free dye molecules. Scale bars: 3 μm. (C) Internalization of unlabeled T7 RNA polymerase (T7 RNAP, 98 kDa) into electrocompetent DH5α carrying the pRSET-EmGFP plasmid encoding emerald GFP (EmGFP) under control of a T7 promoter. Left: Schematic of assay. Middle: fluorescence overlay. Right: histograms of cell-based fluorescence intensities for the nonelectroporated sample (top) and cells incubated and electroporated with T7 RNAP; ∼11% of the electroporated cells show high fluorescence intensity (over our threshold corresponding to the mean fluorescence intensity of nonelectroporated cells plus three times the standard deviation). High fluorescence indicates expression of EmGFP. Scale bar: 3 μm.
Figure 5
Figure 5
Ensemble and smFRET studies in single bacteria. (A) Analysis of cells loaded with 20 pmol each of three DNA FRET standards exhibiting low (∼0.17), intermediate (∼0.48), and high (∼0.86) FRET (as measured using in vitro single-molecule measurements; Fig. S5A). Left: WL and green/red (FRET) fluorescence overlay images (Scale bar: 3 μm). Examples of FRET values from different cells are indicated (white). Right (top to bottom): uncorrected cell-based FRET (E) histograms for donor only (dark green), low (light green), intermediate (yellow), and high (red) FRET DNA standards. (B–D) In vivo smFRET. Cells loaded with 0.25 pmol intermediate-FRET DNA (panel B), 0.25 pmol high-FRET DNA (panel C), and 5 pmol doubly-labeled KF (panel D). Left column: green/red fluorescence overlay of single frame before and after acceptor photobleaching. Middle column: time traces corresponding to the molecule in the yellow circle. FRET efficiencies, donor emission intensities, and acceptor emission intensities in blue, green, and red, respectively. Right column: FRET histograms of donor only molecules (green) and donor-acceptor molecules (yellow, red, and gray) from 20 time traces for each sample. Scale bars: 3 μm for A, 1 μm for BD.

References

    1. Yildiz A., Forkey J.N., Selvin P.R. Myosin V walks hand-over-hand: single fluorophore imaging with 1.5-nm localization. Science. 2003;300:2061–2065. - PubMed
    1. Yu J., Xiao J., Xie X.S. Probing gene expression in live cells, one protein molecule at a time. Science. 2006;311:1600–1603. - PubMed
    1. English B.P., Hauryliuk V., Elf J. Single-molecule investigations of the stringent response machinery in living bacterial cells. Proc. Natl. Acad. Sci. USA. 2011;108:E365–E373. - PMC - PubMed
    1. Ha T., Enderle T., Weiss S. Probing the interaction between two single molecules: fluorescence resonance energy transfer between a single donor and a single acceptor. Proc. Natl. Acad. Sci. USA. 1996;93:6264–6268. - PMC - PubMed
    1. Betzig E., Patterson G.H., Hess H.F. Imaging intracellular fluorescent proteins at nanometer resolution. Science. 2006;313:1642–1645. - PubMed

Publication types

MeSH terms