Detecting cancer clusters in a regional population with local cluster tests and Bayesian smoothing methods: a simulation study
- PMID: 24314148
- PMCID: PMC3878948
- DOI: 10.1186/1476-072X-12-54
Detecting cancer clusters in a regional population with local cluster tests and Bayesian smoothing methods: a simulation study
Abstract
Background: There is a rising public and political demand for prospective cancer cluster monitoring. But there is little empirical evidence on the performance of established cluster detection tests under conditions of small and heterogeneous sample sizes and varying spatial scales, such as are the case for most existing population-based cancer registries. Therefore this simulation study aims to evaluate different cluster detection methods, implemented in the open source environment R, in their ability to identify clusters of lung cancer using real-life data from an epidemiological cancer registry in Germany.
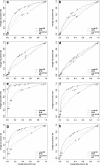
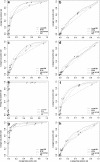
Methods: Risk surfaces were constructed with two different spatial cluster types, representing a relative risk of RR = 2.0 or of RR = 4.0, in relation to the overall background incidence of lung cancer, separately for men and women. Lung cancer cases were sampled from this risk surface as geocodes using an inhomogeneous Poisson process. The realisations of the cancer cases were analysed within small spatial (census tracts, N = 1983) and within aggregated large spatial scales (communities, N = 78). Subsequently, they were submitted to the cluster detection methods. The test accuracy for cluster location was determined in terms of detection rates (DR), false-positive (FP) rates and positive predictive values. The Bayesian smoothing models were evaluated using ROC curves.
Results: With moderate risk increase (RR = 2.0), local cluster tests showed better DR (for both spatial aggregation scales > 0.90) and lower FP rates (both < 0.05) than the Bayesian smoothing methods. When the cluster RR was raised four-fold, the local cluster tests showed better DR with lower FPs only for the small spatial scale. At a large spatial scale, the Bayesian smoothing methods, especially those implementing a spatial neighbourhood, showed a substantially lower FP rate than the cluster tests. However, the risk increases at this scale were mostly diluted by data aggregation.
Conclusion: High resolution spatial scales seem more appropriate as data base for cancer cluster testing and monitoring than the commonly used aggregated scales. We suggest the development of a two-stage approach that combines methods with high detection rates as a first-line screening with methods of higher predictive ability at the second stage.
Figures


Similar articles
-
Impact of socioeconomic inequalities on geographic disparities in cancer incidence: comparison of methods for spatial disease mapping.BMC Med Res Methodol. 2016 Oct 12;16(1):136. doi: 10.1186/s12874-016-0228-x. BMC Med Res Methodol. 2016. PMID: 27729017 Free PMC article.
-
[Active surveillance of small-scale spatial cancer clusters: presentation of a new monitoring approach for the epidemiological Cancer Registry of Lower Saxony].Bundesgesundheitsblatt Gesundheitsforschung Gesundheitsschutz. 2014 Jan;57(1):33-40. doi: 10.1007/s00103-013-1872-5. Bundesgesundheitsblatt Gesundheitsforschung Gesundheitsschutz. 2014. PMID: 24357170 German.
-
How does Poisson kriging compare to the popular BYM model for mapping disease risks?Int J Health Geogr. 2008 Feb 4;7:6. doi: 10.1186/1476-072X-7-6. Int J Health Geogr. 2008. PMID: 18248676 Free PMC article.
-
A scoping review of spatial cluster analysis techniques for point-event data.Geospat Health. 2013 May;7(2):183-98. doi: 10.4081/gh.2013.79. Geospat Health. 2013. PMID: 23733283
-
[Methods for analysing spatial data : Using the example of skin cancer prevalence in Germany].Hautarzt. 2022 Jan;73(1):15-20. doi: 10.1007/s00105-021-04914-1. Epub 2021 Nov 30. Hautarzt. 2022. PMID: 34846551 Review. German.
Cited by
-
A Comparative Study of Spatial Distribution of Gastrointestinal Cancers in Poverty and Affluent Strata (Kermanshah Metropolis, Iran).J Gastrointest Cancer. 2019 Dec;50(4):838-847. doi: 10.1007/s12029-018-0163-7. J Gastrointest Cancer. 2019. PMID: 30136201
-
Impact of socioeconomic inequalities on geographic disparities in cancer incidence: comparison of methods for spatial disease mapping.BMC Med Res Methodol. 2016 Oct 12;16(1):136. doi: 10.1186/s12874-016-0228-x. BMC Med Res Methodol. 2016. PMID: 27729017 Free PMC article.
-
Comparing adaptive and fixed bandwidth-based kernel density estimates in spatial cancer epidemiology.Int J Health Geogr. 2015 Mar 31;14:15. doi: 10.1186/s12942-015-0005-9. Int J Health Geogr. 2015. PMID: 25889018 Free PMC article.
-
Geographical variability in cancer incidence explained by the socioeconomic environment: an example of lung cancer in northwestern France.J Epidemiol Community Health. 2025 Feb 10;79(3):200-206. doi: 10.1136/jech-2024-222704. J Epidemiol Community Health. 2025. PMID: 39486869 Free PMC article.
-
Spatial epidemiology of dry eye disease: findings from South Korea.Int J Health Geogr. 2014 Aug 15;13:31. doi: 10.1186/1476-072X-13-31. Int J Health Geogr. 2014. PMID: 25128034 Free PMC article.
References
-
- Monitoring in epidemiologischen Krebsregistern: Möglichkeiten – Grenzen – Risiken. http://www.krebsregister-niedersachsen.de/registerstelle/?page_id=2071.
-
- Kieschke J. In: EKN-Bericht. Epidemiologisches Krebsregister Niedersachsen, editor. Oldenburg, Germany; 2010. Auswertung des EKN zur Krebshäufigkeit in der Samtgemeinde Asse.
-
- Dreesmann J. In: Monitoring-Workshop. Niedersächsisches Landesgesundheitsamt, editor. Oldenburg, Germany; 2012. Statistische Erkennung Räumlicher Cluster- Erfahrungen aus der Infektionsepidemiologie.
-
- Waller LA, Gotway CA. Applied Spatial Statistics for Public Health Data. Hoboken, N.J.: John Wiley & Sons; 2004.
Publication types
MeSH terms
LinkOut - more resources
Full Text Sources
Other Literature Sources
Medical
Miscellaneous

