. 2013 Dec 4;80(5):1263-76.
doi: 10.1016/j.neuron.2013.09.033.

Inhibition-induced theta resonance in cortical circuits

Affiliations

Inhibition-induced theta resonance in cortical circuits

Eran Stark et al. Neuron. .

Abstract

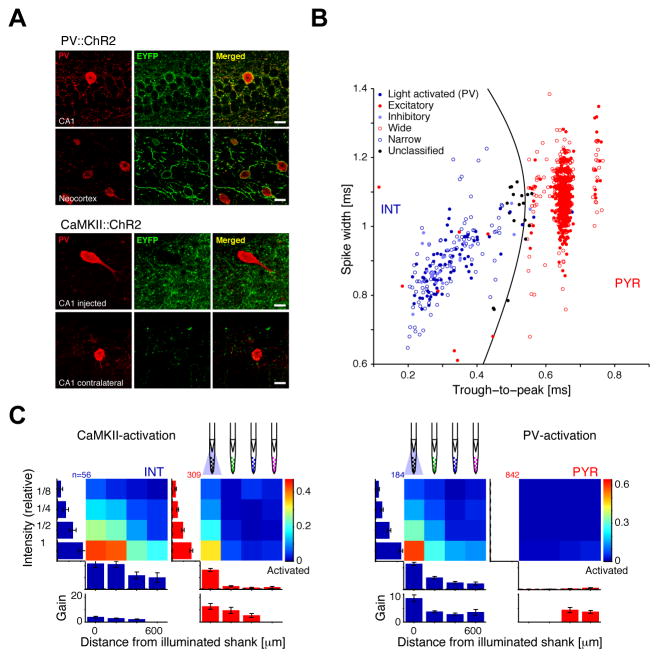
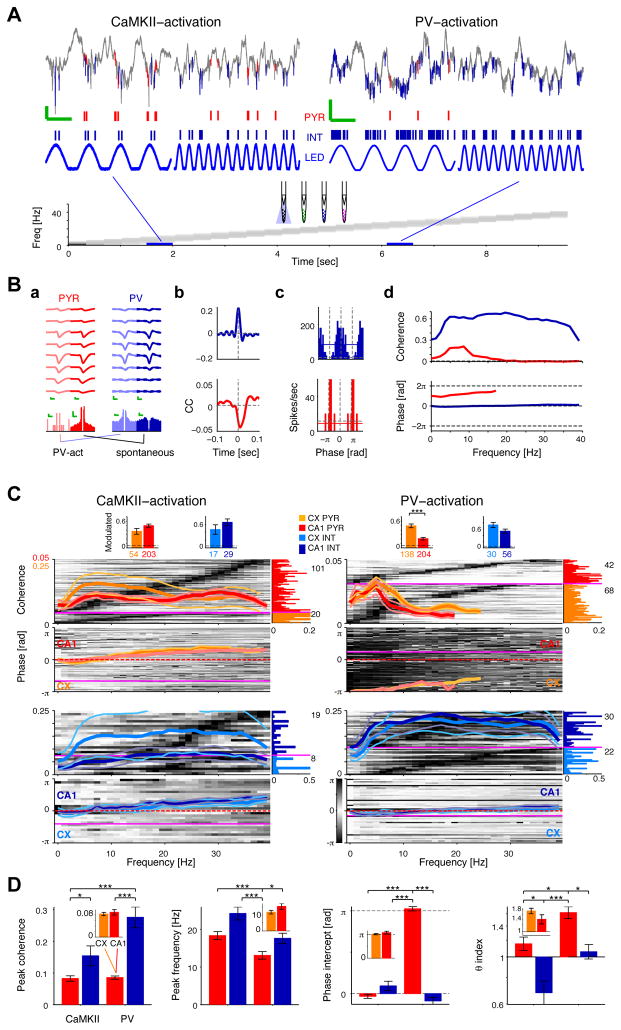
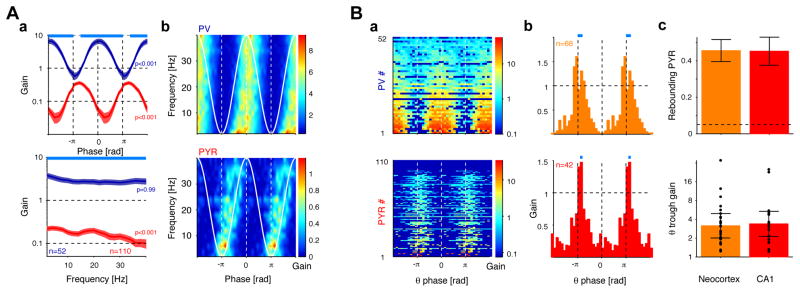
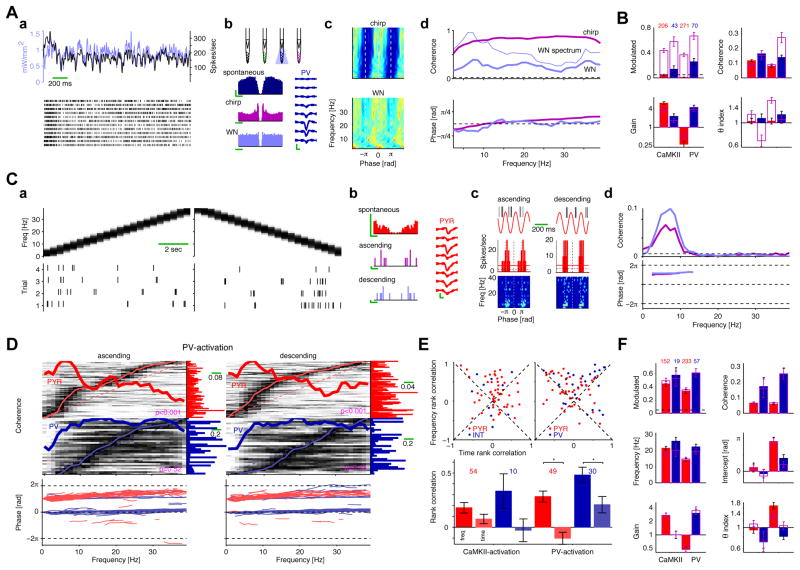
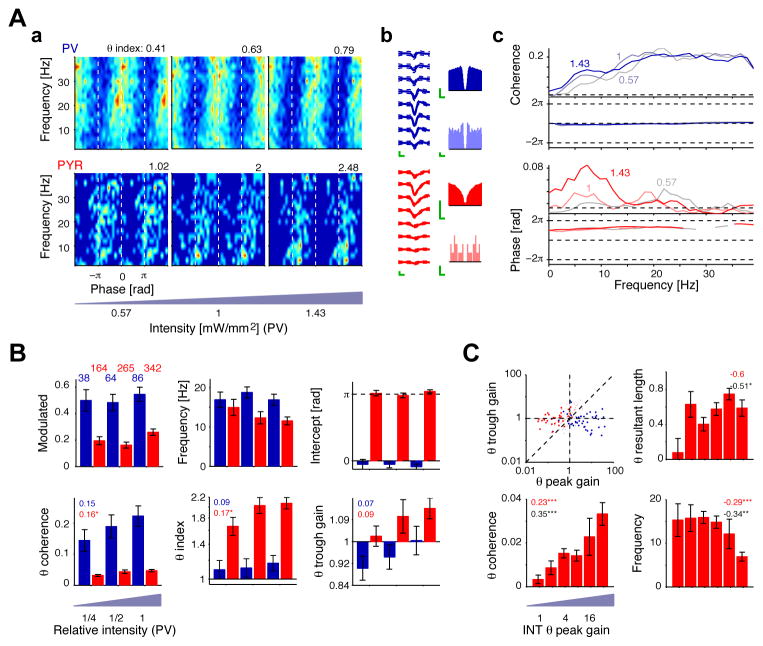
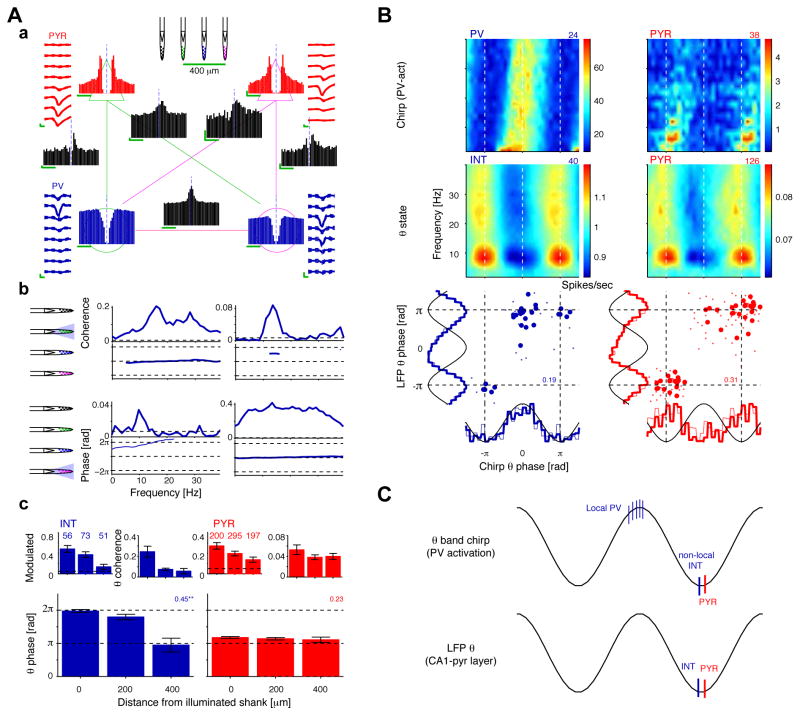
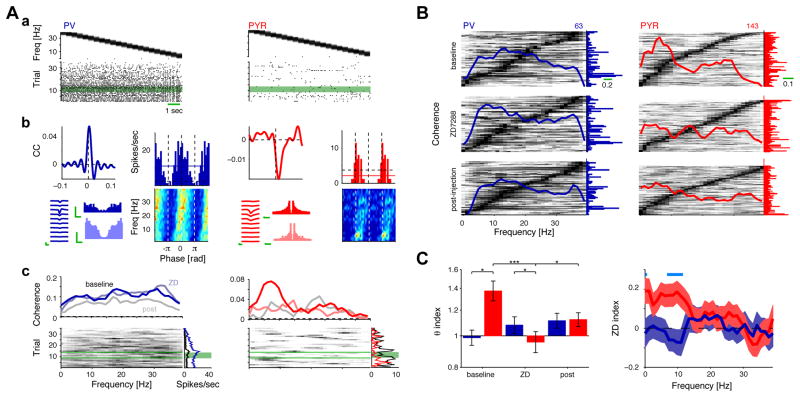
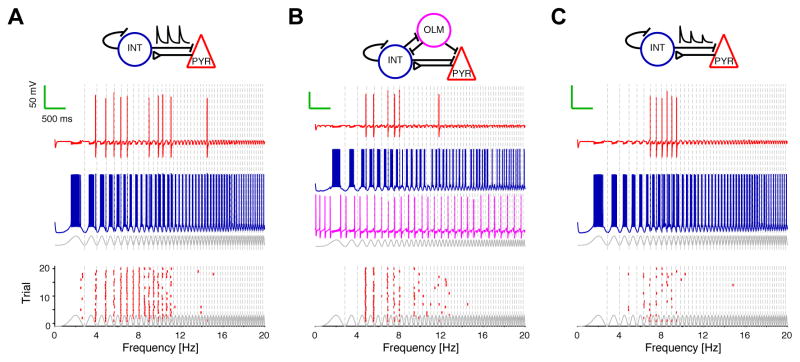
Both circuit and single-cell properties contribute to network rhythms. In vitro, pyramidal cells exhibit theta-band membrane potential (subthreshold) resonance, but whether and how subthreshold resonance translates into spiking resonance in freely behaving animals is unknown. Here, we used optogenetic activation to trigger spiking in pyramidal cells or parvalbumin immunoreactive interneurons (PV) in the hippocampus and neocortex of freely behaving rodents. Individual directly activated pyramidal cells exhibited narrow-band spiking centered on a wide range of frequencies. In contrast, PV photoactivation indirectly induced theta-band-limited, excess postinhibitory spiking in pyramidal cells (resonance). PV-inhibited pyramidal cells and interneurons spiked at PV-inhibition troughs, similar to CA1 cells during spontaneous theta oscillations. Pharmacological blockade of hyperpolarization-activated (I(h)) currents abolished theta resonance. Inhibition-induced theta-band spiking was replicated in a pyramidal cell-interneuron model that included I(h). Thus, PV interneurons mediate pyramidal cell spiking resonance in intact cortical networks, favoring transmission at theta frequency.


Figures

Figure 1
Figure 1. Local activation of specific cell types in freely-moving mice
(A) Immunostaining for PV co-localizes with EYFP, the reporter gene for ChR2 expression, in PV-cre::Ai32 mice but not in animals injected unilaterally with rAAV5/CamKIIa-hChR2(h134R)-EYFP viruses. In five PV-cre::Ai32 animals, all 84 EYFP+ cells were PV+ (100%) and 84 of 93 PV+ cells were EYFP+ (90%). Calibration, 15 μm. (B) Units are tagged as excitatory or inhibitory based on mono-synaptic peaks/troughs in the cross-correlation histogram (p<0.001, convolution method; Stark and Abeles, 2009) and/or locally-delivered 50–70 ms light pulses (p<0.001, Poisson test; PV animals only). Non-tagged units (692 of 1413, 51%) are classified as putative pyramidal cells (PYR) or interneurons (INT) according to waveform morphology; non-tagged units with low classification confidence (p>0.05, n=22, 1.6%) are not analyzed (“unclassified”). (C) Effect of single-shank pulses on locally-recorded and distant cells (≥200 μm; n=4 CaMKII mice, 8 PV mice). Intensities are scaled by the level used to induce the largest number of directly-activated units per shank (the “optimal” DC intensity). Mean intensities at the center of the illuminated shanks were 0.56 (CaMKII) and 1.1 mW/mm2 (PV). Bars below are group means (SEM) for the optimal intensity, and bars at the left refer to the local shank. CaMKII activation induces local spiking of PYR at a higher gain (bottom; defined as the firing rate during DC pulses divided by baseline firing rate, in the lack of light) than INT, whereas PV activation induces only localized INT spiking. See also Figure S1.
Figure 2
Figure 2. Band-limited spiking of pyramidal cells is centered at theta by inhibition
(A) Example traces of local field potentials (LFP) and spikes (1–5000 Hz; calibration: 100 ms, 200 μV) in the CA1 pyramidal layer during chirp pattern photostimulation (0–40 Hz gray ramp; peak 470 nm light intensity, approximately 0.9 mW/mm2 at shank center) of PYR (CaMKII, left) or PV-interneurons (PV, right). During CaMKII-activation, cells spike at a broad range of frequencies, while during PV-activation, PYR tend to spike specifically at theta frequency. (B) Example analysis for the CA1 PYR-PV pair during PV-activation. a, Waveforms of the pyramidal cell (PYR) and interneuron (PV) at the 8 sites of the diode-probe shank (20 μm spacing) during PV activation and spontaneous activity (mean and SD; calibration: 0.25 ms, 50 μV). Calibration for auto-correlation histograms: 10 ms, 10 spikes/sec. b, Time-domain cross-correlation between the chirp pattern and spiking activity (both sampled at 1250 Hz). While the PV cell is activated, PYR spiking is largely suppressed (note difference in scale). c, Theta phase histograms for all spikes, expressed as firing rates (20 phase bins/cycle); horizontal dashed lines show baseline rates (mean over all periods without light stimulation) and continuous colored lines show mean firing rate during the theta (6±1 Hz) chirp segment. Phase 0 corresponds to stimulus peak. d, Coherence (top) and phase (bottom) between chirp pattern and spiking; dashed line shows chance coherence; phase is shown only for frequencies in which coherence is significant (p<0.05, Bonferroni-corrected permutation test). During theta-band chirp pattern PV activation (red), the PYR spikes specifically at chirp troughs. (C) Spiking activity of neocortical (CX) and CA1 cells during PYR (left) or PV (right) photostimulation (0–40 Hz chirp pattern). Coherence (scaled 0–1; peak values shown at right) and phase plots for all neurons (rows) and group mean±SEM are shown. Bars at right show peak coherence for each cell; proportions of cells modulated by the chirp pattern (p<0.05, permutation test) are shown at top. Spike phases are near zero with a linear shift for both cell types during CaMKII stimulation (left) and for PV interneurons during PV stimulation (right). Note narrow-band coherence of individual PYR at a wide range of frequencies during CaMKII activation but predominant theta band-limited coherence during PV activation. (D) Statistical analysis of various measures for PYR (red) and INT (blue). Insets show comparisons between neocortical (orange) and CA1 (red) PYR during PV activation. Color code is the same for in all panels. Error bars, SEM; */**/***: p<0.05/0.01/0.005, Kruskal-Wallis test, Bonferroni-corrected for multiple comparisons. θ index is defined as theta band (4–11 Hz) coherence, divided by the overall mean coherence (0–40 Hz). Peak coherence frequency, phase intercept, and theta preference of PYR depend on the activated cell type. See also Figure S2.
Figure 3
Figure 3. Inhibition induces excess spiking of pyramidal cells
(A) Spiking gain during PV-activation. a, For each cell, firing rates resolved by chirp phase (top) or chirp frequency (bottom) were computed and divided by the baseline rate (in the lack of any light stimulation). Gain=1 thus indicates no change relative to spontaneous activity. Error bands, SEM; light blue bars, phases (or frequencies) for which PYR and PV gain differ (p<0.01, Bonferroni-corrected Kruskal-Wallis test). PYR spiking is suppressed at all phases (when averaged over all frequencies) and frequencies (when averaging over all phases). b, Gain plotted as a frequency- phase map (bin size: 2 Hz, π/10 rad). PV interneurons spike around chirp peaks (0 radians) at all frequencies; the peak average gain for PYR is at 6–8 Hz, just after the chirp trough. (B) a, Theta (4–11 Hz) gain of individual PV interneurons (top) and PYR (bottom). Units are sorted by the maximum gain; some light-driven units do not spike in the theta-band of the chirp. b, Mean theta gain for the PYR, partitioned by brain region. Blue bars indicate phase bins for which the number of units with increased spiking (gain>1) exceeds chance level (exact Binomial test, p<0.001). In both brain regions, the mean gain is >1 at the chirp theta trough. c, Top, the fractions of PYR exhibiting excess (“rebound”) spiking, defined as units with increased spiking during troughs of theta-band chirp, are similar in neocortex and CA1 (p=0.97, χ2 test). Bottom, gain (median±median average deviation) of rebounding PYR in neocortex and CA1 is similar (p=0.91, U-test). Dots, gain of individual PYR. For more details, see Figure S3.
Figure 4
Figure 4. Inhibition-induced PYR spiking depends on inhibition pattern
(A) White-noise (WN) stimulation of PV cells induces precisely-timed PV spiking (CA1 region). a, Stimulation pattern (light blue), and light-driven histogram of spiking (black overlay, rank correlation: 0.71) during 12 trials. Individual trials are shown at the bottom (black ticks). b, Auto-correlation histograms during no-light control (spontaneous activity, chirp, and WN stimulation. Right, waveforms of the PV unit recorded at the 8 recording sites. c, Spiking frequency-phase maps as in Figure 3Ab (color scales: chirp, 0–460 spikes/sec; WN, 0–91.6 spikes/sec). d, Coherence and phase during the two photostimulation patterns. Note similar shapes of the coherence and spectrum of the input signal (superimposed WN spectrum). (B) Full bars and purple bars show fraction of significantly modulated units during WN and chirp stimulation, respectively. Gain, coherence, and theta index are shown only for cells frequency modulated (p<0.05, permutation test) by either pattern. PYR theta index is diminished during WN stimulation of PV cells. (C) a, Spiking of a neocortical PYR during ascending (0–40 Hz) and descending (40-0 Hz) chirps (interleaved trials). Spiking is limited to the theta band in both cases. b, Auto-correlation histograms. c, Spiking histograms. Both patterns induce excess spiking during theta-band troughs (rebound). d, Coherence and phase. (D) Coherence and phase of light-modulated (p<0.05) units tested with ascending- and descending-chirp patterns (PV-activation only). Phase is plotted only at frequencies for which coherence is significant. PYR spiking is predominantly at theta troughs regardless of chirp direction. Magenta numbers, Kolmogorov-Smirnov test (uniform null). (E) Frequency-correlation (the rank correlation between the spiking coherence during ascending and descending chirps) vs. the time-correlation (between the ascending chirp coherence and the temporally-reversed spiking coherence) for CaMKII (left) and PV (right) animals. Bottom, rank correlations for CaMKII and PV mice. *: p<0.05, Wilcoxon’s paired signed rank test. Correlation with instantaneous chirp frequency is consistently larger than with time. (F) Statistics for the ascending (hollow purple bars) and descending (full bars) chirps. Note similar activity induced by the two patterns. Panels E and F include only doubly-modulated cells. For spiking gain maps and an equivalent presentation during CaMKII activation, see Figure S4.
Figure 5
Figure 5. Inhibition-induced PYR spiking depends on magnitude of inhibitory drive
(A) PYR spiking is confined to theta troughs by increased inhibition. Two neocortical units, recorded from the same shank, were stimulated with a chirp pattern at 3 intensities (5 repetitions/intensity). a, Spiking frequency-phase maps for the PV interneuron (top; color scale, gain 0–7) and PYR (bottom; 0–2.5). b, Spike waveforms and auto-correlation histograms for the two cells during evoked (bottom) and no-light (top) conditions. c, Coherence and phase plots at different light intensities. (B) Statistics for all units tested at multiple intensities during PV chirp-pattern activation. Relative intensity value of 1 corresponds to the “optimal” DC intensity (mean, 1.1 mW/mm2 at the center of the illuminated shank; see Figure 1C). Neuron numbers and rank correlations for INT/PYR are shown in blue/red; */**/***: p<0.05/0.01/0.005, permutation test. PYR theta-band spiking is more prominent with increased intensity. (C) PV interneuron theta peak gain predicts PYR theta-band coherence, phase, and specificity. Top left, During PV stimulation, spiking gain at theta trough is higher than at peak for PYR (p<0.001, U-test; red, n=110 light-modulated cells; light red, not significantly modulated) but the inverse applies to PV interneurons (p<0.001, n=52; blue). Other panels, Spiking properties of PYR during PV activation vs. theta peak gain of INT recorded on the same shank. Rank correlations for significantly light-modulated PYR (n=88) and all PYR (272) are shown in red/black text. As the local inhibitory drive increases, PYR theta-band coherence increases, PYR peak frequency decreases, and theta phase of PYR spiking becomes less variable (increased resultant length). See also Figure S5.
Figure 6
Figure 6. Phase preference of neuron spikes during induced firing and LFP theta oscillations
(A) Non-local INT tend to spike at the trough of theta-band chirp pattern PV activation. a, PYR-PV network recorded in CA1. One PYR and one PV are shown for each of two shanks, 400 μm apart. Auto- and cross-correlation histograms (calibration: 10 ms, 50 coincident counts) during spontaneous spiking (no-light condition) indicate mono-synaptic connectivity of the same-shank PYR-PV pairs, zero-lag synchronization between the PV pair (on shanks 2 and 4), and time-shifted temporal correlation between cross-shank PYR-PV pairs. b, Top: during chirp-pattern PV activation on shank 2, the local PV spikes in-phase with the chirp, whereas the non-local PV spikes anti-phase; the inverse occurs during PV activation on shank 4 (bottom). c, During PV activation in CA1, PV recorded on the illuminated shank spike at peak of theta-band light stimulation whereas non-local INT tend to spike around the trough. PYR emit spikes near the trough. Circular-linear correlation coefficients are shown; **: p<0.01, χ2 test. (B) Top panels, spiking frequency-phase maps of CA1 units during chirp-pattern PV activation. Only light-modulated units are included (p<0.05, permutation test). Middle panels, spiking gain maps of CA1 units during LFP theta; only theta-band modulated units are included (p<0.05, Rayleigh test). Bottom, phases for cells modulated by the chirp in the theta band and by LFP theta oscillations (both states: 24 PV, blue; 24 PYR, red; light dots, cells significantly modulated by either chirp or LFP theta). Circular-circular correlation coefficients are shown. Marginals show the mean firing rate (scaled 0–1 for each unit) during the two states (thin lines show marginals for cells modulated only in one state). (C) Diagram summarizing the spiking phases of CA1 neurons during LFP theta (local LFP, bottom) and during theta-band chirp-pattern PV-activation (top). During theta-band PV-activation, locally-driven PV cells follow the drive closely. Non-local cells spike at the opposite phase of the light-driven PV spikes. See also Figure S6.
Figure 7
Figure 7. Theta band rebound spiking is Ih-dependent
(A) a, Spiking of a CA1 PV (left) and PYR (right) recorded from the same diode-probe shank during 35 consecutive descending chirps (40-0 Hz; peak intensity, ~1 mW/mm2). An Ih blocker (ZD7288, 200 nl, 0.1M) was infused into the CA1 radiatum/lacunosum-moleculare after the 8th chirp (shaded green region). b, Spiking statistics before the injection. PYR spiking exhibits theta-band resonance. c, Bottom right, mean firing rate during (color) and surrounding (black) each chirp. While PV spiking is consistently driven by the chirp pattern (coherence by epochs/single-trials at top/bottom), PYR firing rate and theta-band coherence are diminished upon the infusion. (B) ZD7288 attenuates theta-frequency resonance in PYR (n=5 PV::ChR2 mice). Before ZD7288 injection, PYR spike predominantly at the chirp-pattern theta band, whereas PV spike uniformly at all frequencies. During Ih blockade, the frequency preference of PYR, but not of PV, changes and is no longer predominant in the theta-band. (C) Theta-band specificity of Ih-blockade. Left, Theta index of PYR is significantly reduced by the drug.*/**/***: p<0.05/0.01/0.005 (PV-PYR intra-epoch comparisons, U-test; PYR inter-epoch comparisons, Wilcoxon’s signed-rank paired test). Right, ZD-index (difference between control and drug coherence, divided by the sum) is high specifically for PYR during theta-band PV stimulation (blue bar, frequency bins for which PYR and PV indices differ; p<0.05, Bonferroni-corrected U-test). See also Figure S7.
Figure 8
Figure 8. Model of theta-resonance induced by feed-forward inhibition
(A) A minimal network of a reciprocally connected PYR and INT (mimicking PV basket interneuron) was simulated and the INT was stimulated using the same chirp pattern used in the extra-cellular experiments. During stimulation, the PYR exhibited Ih–dependent post-inhibitory spiking around the stimulus troughs (vertical dashed lines) at low frequencies. (B) Addition of a timing mechanism, implemented here by an additional inhibitory interneuron (OLM cell), sharpens band-limited spiking. During low-frequency INT stimulation, the OLM cell was inhibited by the INT and released from inhibition “just in time” to inhibit PYR and prevent post-inhibitory rebound during the high stimulus phase, in effect creating a PYR spiking band-pass filter. OLM cells are still active during the theta band. However, the combined effect of this inhibition and the OLM intrinsic properties, in particular Ih, generates a spiking frequency that does not interfere with PYR spiking. (C) A similar pattern was obtained in the PYR-INT model by including synaptic depression of the inhibitory synapses on the PYR. Following intense presynaptic INT spiking, the inhibitory synapses on the PYR are less activated, so the hyperpolarization drive to Ih activation is reduced. Synaptic depression is more effective at lower input frequencies where the pre-synaptic input spiking is higher. Thus, at low stimulation frequencies, post-inhibitory rebound spiking is not generated, resulting in theta-range resonant spiking.

References

    1. Barthó P, Hirase H, Monconduit L, Zugaro M, Harris KD, Buzsáki G. Characterization of neocortical principal cells and interneurons by network interactions and extracellular features. J Neurophysiol. 2004;92:600–608. - PubMed
    1. Boyden ES, Zhang F, Bamberg E, Nagel G, Deisseroth K. Millisecond-timescale, genetically targeted optical control of neural activity. Nat Neurosci. 2005;8:1263–1268. - PubMed
    1. Buzsáki G. Theta oscillations in the hippocampus. Neuron. 2002;33:325–340. - PubMed
    1. Buzsáki G, Moser EI. Memory, navigation and theta rhythm in the hippocampal-entorhinal system. Nat Neurosci. 2013;16:130–138. - PMC - PubMed
    1. Cardin JA, Carlén M, Meletis K, Knoblich U, Zhang F, Deisseroth K, Tsai LH, Moore CI. Driving fast-spiking cells induces gamma rhythm and controls sensory responses. Nature. 2009;459:663–667. - PMC - PubMed

Publication types

MeSH terms

Substances