. 2013 Dec 5;155(6):1337-50.
doi: 10.1016/j.cell.2013.11.002.

Parallel, redundant circuit organization for homeostatic control of feeding behavior

Affiliations

Parallel, redundant circuit organization for homeostatic control of feeding behavior

J Nicholas Betley et al. Cell. .

Abstract

Neural circuits for essential natural behaviors are shaped by selective pressure to coordinate reliable execution of flexible goal-directed actions. However, the structural and functional organization of survival-oriented circuits is poorly understood due to exceptionally complex neuroanatomy. This is exemplified by AGRP neurons, which are a molecularly defined population that is sufficient to rapidly coordinate voracious food seeking and consumption behaviors. Here, we use cell-type-specific techniques for neural circuit manipulation and projection-specific anatomical analysis to examine the organization of this critical homeostatic circuit that regulates feeding. We show that AGRP neuronal circuits use a segregated, parallel, and redundant output configuration. AGRP neuron axon projections that target different brain regions originate from distinct subpopulations, several of which are sufficient to independently evoke feeding. The concerted anatomical and functional analysis of AGRP neuron projection populations reveals a constellation of core forebrain nodes, which are part of an extended circuit that mediates feeding behavior.


Figures

Figure 1
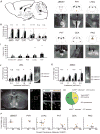
Figure 1. Evoked food intake from activation of AGRP neuron axons projections
(A) Diagram of prominent AGRP neuron axon projections analyzed in this study. Axon trajectories are schematic. (B-G) Diagrams and images of ChR2tdtomato-expressing AGRP neuron axon projections and optical fiber placement (white dotted line). ac: anterior commissure. fx: fornix. Scale bar, 500 μm. (H) Food intake before (pre) and during (stim) photostimulation of AGRP neuron axon projection fields. (PVH: n = 3, aBNST: n = 6, LHAs: n = 10, PVT: n = 9, CEA: n = 6, PAG: n = 7). Red dotted line: Mean food intake from somatic photostimulation (Aponte et al., 2011). For PVT experiments, data is shown from successive evoked feeding trials (t1, t2). Values are mean ± SEM. Paired t-tests, n.s. p>0.05, **p<0.01, ***p<0.001. (I) Latency to initiate first bout of feeding after photostimulation onset. Values are mean ± SEM. (J and K) Evoked feeding for axon projection photostimulation in the LHAs and aBNST for different irradiances (calculated for distal portion of target region). Images depict estimated irradiance values bracketing targeted projection fields based on theoretical model (Aravanis et al., 2007). Scale bar, 500 μm. Paired t-tests. n.s. p>0.05, *p<0.05, **p<0.01, ***p<0.001. (L) Fiber placement and ChR2tdtomato distribution in ARCAGRP→aBNST axon projections. Red square: area imaged for transgene penetrance. Scale bar, 1 mm. (M) Inset from (L) showing a confocal image of AGRP (green) and tdtomato immunofluorescence (red). Scale bar, 10 μm. (N) Inset from (M). Scale bar, 5 μm. (O) ChR2 penetrance for the aBNST in (L). (P) Food intake as a function of ChR2tdtomato penetrance in each projection field. Red dots, individual animals. Blue dot, mean. Bars, SD.
Figure 2
Figure 2. Inhomogeneous transgene penetrance in AGRP neuron axon projections
(A) Potential configurations for AGRP neuron projections. Shading denotes hypothetical subpopulations. (B) For one-to-many or one-to-one wiring configurations, fluorescent protein expression (blue) in a subset of AGRP neurons would be heterogeneously distributed. For one-to all wiring, fluorescent protein expression in a subset of AGRP neurons would be evenly distributed to all projection fields. (C) Fluorescent protein penetrance ratio with AGRP-immunoreactivity normalized to aBNST penetrance for each animal. Values are mean ± SEM. Paired t-tests against unity ratio. Holm's correction for multiple comparisons.
Figure 3
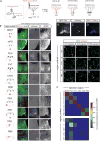
Figure 3. Separate AGRP neuron subpopulations project to different brain regions
(A) Strategy and potential outcomes for cell type-specific and axon projection-specific neuron transduction to visualize potential axon collateral configurations for AGRP neurons. Cell type-specific axon transduction with EnvA pseudotyped rabies virus requires the axonal expression of its receptor, TVA, for axonal uptake of the viral vector (inset) and fluorescent protein expression for neuron labeling. (B) BFP fluorescence from AGRP neurons selectively transduced with AAV2/1 -FLEX-rev-BFP-2a-TVA in an Agrp-IRES-Cre mouse. Scale bar, 100 μm. (C) mCherry fluorescence in the ARC following SADΔG-mCherry(EnvA) injection to the PVH of a mouse expressing TVA in AGRP neurons. (D) BFP and mCherry colocalization in AGRP neurons. (E) Ten AGRP neuron projection fields probed for mCherry and AGRP expression following SADΔG-mCherry(EnvA) infection in the PVH of an AGRPTVA mouse. (i) Red box indicates region probed for axon collateralization of PVH-projecting AGRP neurons. (ii) Overlaid images of AGRP immunoreactivity and mCherry fluorescence. (iii) mCherry expression reveals axonal arborization in the injection site (PVH) but mCherry fluorescence was very low or undetectable in probed regions. (iv) AGRP immunofluorescence in each target region. mPO, medial preoptic area. DMH, dorsomedial hypothalamus. Mesencephalic trigeminal tract (me5) shows autofluorescence near the PBN. Scale bar, 200 μm. (F-N) Representative confocal images of AGRP immunofluorescence and mCherry fluorescence in SADΔG-mCherry(EnvA) injection and probed sites. Scale bar, 20 μm. (O) Penetrance of mCherry colocalization with AGRP-immunofluorescence in each region probed normalized to penetrance at the SADΔG-mCherry(EnvA) injection site. Colocalization was assessed in 1510 ± 350 boutons per region (mean ± SD) (see Experimental and Supplemental Experimental Procedures). Xi, Xiphoid nucleus.
Figure 4
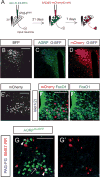
Figure 4. Transsynaptic transduction of ARCAGRP→PVH projections does not show detectable axon collateralization
(A) Scheme for genetically targeting SADΔG-mCherry(EnvA) to the PVH for transsynaptic retrograde transduction of ARCAGRP→PVH projections. AAV-FLEX-BTG: AAV2/1-FLEX-rev-BFP-2a-TVA-2a-RabiesG virus. Blue, BFP. Red, mCherry. (B) Expression of BFP in PVHSIM1 neurons after viral transduction with AAV2/1-FLEX-rev-BFP-2a-TVA-2a-RabiesG virus in a Sim1-Cre transgenic mouse. Scale bar, 200 μm. (C) Expression of BFP in PVHSIM1 neurons overlaps the domain of AGRP inputs to the PVH. (D) PVHSIM1 starter cells co-express BFP and mCherry following SADΔG-mCherry(EnvA) injection in the PVH. (E) ARC neurons show retrograde labeling with mCherry after transsynaptic transduction from PVH neurons. Scale bar, 100 μm. (F, F′) AGRP neurons, identified by the co-expression of FoxO1 and Islet1(2), are a subset of mCherry retrogradely labeled ARC neurons. Scale bar, 50 μm. (G, G′) Retrograde transport of FluoroGold (FG) from the PAG and Red RetroBeads (RR) from the aBNST labels AGRP neurons in the ARC of Agrp-IRES-Cre;ROSA::lox-STOP-lox-GNZ mice that express nuclear GFP specifically in AGRP neurons (AGRPnucGFP). Arrow identifies an AGRPnucGFP neuron labeled with FG and arrowheads point to AGRPnucGFP neurons labeled with RR. Scale bar, 100 μm. See also Figure S1.
Figure 5
Figure 5. Size and distribution of separate AGRP neuron projection-populations
(A-C) Representative images of AGRP neurons along the anterior-posterior axis of the ARC. Scale bar, 100 μm. (D) Distribution of AGRP neurons along the anterior-posterior axis of the ARC. Values are mean ± SD, n = 2 mice. (E) Number of AGRP neurons estimated to comprise each projection-population. Values are mean ± SD, n = 2 mice. (F) Distribution of AGRP neuron projection-populations along anterior-posterior axis of the ARC, subdivided into 400 μm bins. Shading denotes ipsilaterally (dark) and contralaterally (light) projecting subcomponents of each projection-population. (G-H) Bilateral labeling of ARCAGRP neurons transduced by a unilateral injection of SADΔG-mCherry(EnvA) in the PVT (G). AGRP axons projecting to the PVT show mCherry fluorescence restricted ipsilateral to the injection site (H) (mCherry colocalization, ipsilateral: 320/2935 AGRP boutons, contralateral: 1/1010 AGRP boutons). Therefore, AGRPPVT neurons comprise separate ipsilateral or contralateral projecting subpopulations. Scale bar, 100 μm. (I) AGRP-containing boutons lack mCherry fluorescence in the hemisphere contralateral to SADΔG-mCherry(EnvA) axonal infection in the PVT. Scale bar, 20 μm. See also Figure S1.
Figure 6
Figure 6. Responsiveness of AGRP neuron projection-populations to food deprivation and circulating hormonal signals important for energy homeostasis
(A-D) Fos-immunoreactivity in AGRP neurons marked by tdtomato expression (AGRPTom) from ad libitum fed and 24 h food-deprived (Dep) Agrp-IRES-Cre;ROSA-loxStoplox-tdtomato mice. Scale bar, 100 μm. (E-H) Fos-immunoreactivity in AGRP neurons FG-backlabeled from aBNST (top) or PAG (bottom) in Dep or ghrelin-treated (Ghr) animals. AGRP neurons identified by membrane delimited expression of EYFP (AGRPmembraneEYFP) from Agrp-IRES-Cre;ROSA-loxStoplox-ChR2-EYFP mice. Scale bar, 30 μm. (I) Fos-immunofluorescence intensity in AGRP neurons from three groups of mice: Dep, ghrelin treatment, and ad libitum fed. AU, Arbitrary Units. (J) Fos-immunofluorescence intensity after Dep or ghrelin treatment in AGRP neurons that project to either the aBNST (AGRPaBNST, red) or the PAG (AGRPPAG, blue). (K) Cumulative probability distribution of Fos-immunofluorescence intensity in AGRPaBNST (red) or AGRPPAG (blue) neuron subpopulations after Dep or ghrelin treatment. (L-O) Confocal images of leptin receptor (Lepr) neuron projections show colocalization with AGRP-immunofluorescence for extra-hypothalamic but not intra-hypothalamic projections. Scale bar, 20 μm. (P-S) Some POMC-immunofluorescence colocalizes with tdtomato in all projection fields. Note images in (L) and (P) are from the same brain section. (T) Penetrance of tdtomato reporter for Lepr+ neurons in AGRP (top) or POMC (bottom) axonal varicosities normalized to mean Lepr+/AGRP+ or Lepr+/POMC+ penetrance across sampled brain areas for each mouse. Values are mean ± SEM, n = 3 mice. (U) Summary of functional and anatomical findings. Projection areas sufficient (blue) and insufficient (grey) to elicit feeding. Line thickness of projections represents size of AGRP neuron subpopulation. Red outline, leptin receptor expression.
Figure 7
Figure 7. Core and extended feeding circuits
(A-J) Neurons retrogradely labeled from PVHSIM1 neurons (mCherry fluorescence, red) in relation to prominent AGRP neuron axon projection fields (A-F) (AGRP-immunoreactivity, green) and higher order brain regions (G-J). Midcingulate cortex (MCCx) Insular cortex (InsCx), ventral Subiculum (vSub), Lateral septum (LS). Scale bar, 200 μm. (K) A core feeding circuit comprised of interconnections between PVH, aBNST, LHAs and PVT brain areas. The core feeding circuit is modulated by multiple inputs including homeostatic inputs, for example from AGRP neurons; cortical and hippocampal areas; as well as visceral processing areas. Homeostatic AGRP neuron projections also modulate the inputs to the core feeding circuit, such as the visceral processing areas. Blue arrows: projections sufficient to evoke eating. ILCx, Infralimbic cortex.

References

    1. Aponte Y, Atasoy D, Sternson SM. AGRP neurons are sufficient to orchestrate feeding behavior rapidly and without training. Nat Neurosci. 2011;14:351–355. - PMC - PubMed
    1. Aravanis AM, Wang LP, Zhang F, Meltzer LA, Mogri MZ, Schneider MB, Deisseroth K. An optical neural interface: in vivo control of rodent motor cortex with integrated fiberoptic and optogenetic technology. J Neural Eng. 2007;4:S143–156. - PubMed
    1. Atasoy D, Aponte Y, Su HH, Sternson SM. A FLEX switch targets Channelrhodopsin-2 to multiple cell types for imaging and long-range circuit mapping. J Neurosci. 2008;28:7025–7030. - PMC - PubMed
    1. Atasoy D, Betley JN, Su HH, Sternson SM. Deconstruction of a neural circuit for hunger. Nature. 2012;488:172–177. - PMC - PubMed
    1. Balthasar N, Dalgaard LT, Lee CE, Yu J, Funahashi H, Williams T, Ferreira M, Tang V, McGovern RA, Kenny CD, et al. Divergence of melanocortin pathways in the control of food intake and energy expenditure. Cell. 2005;123:493–505. - PubMed

Publication types