. 2013 Dec 5;155(6):1396-408.
doi: 10.1016/j.cell.2013.11.005.

Circadian control of global gene expression by the cyanobacterial master regulator RpaA

Affiliations

Circadian control of global gene expression by the cyanobacterial master regulator RpaA

Joseph S Markson et al. Cell. .

Abstract

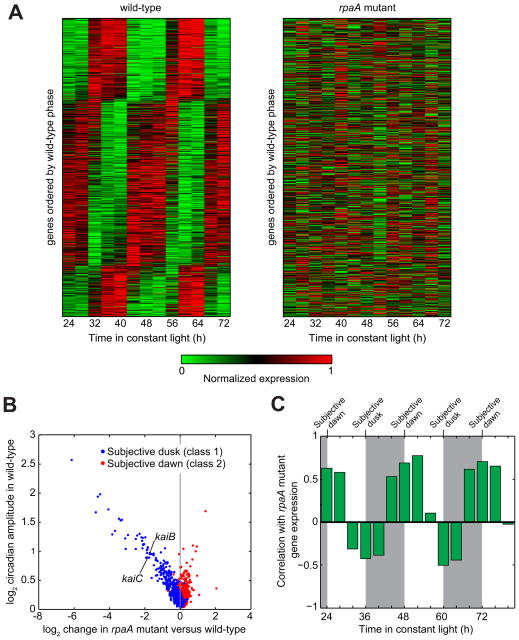
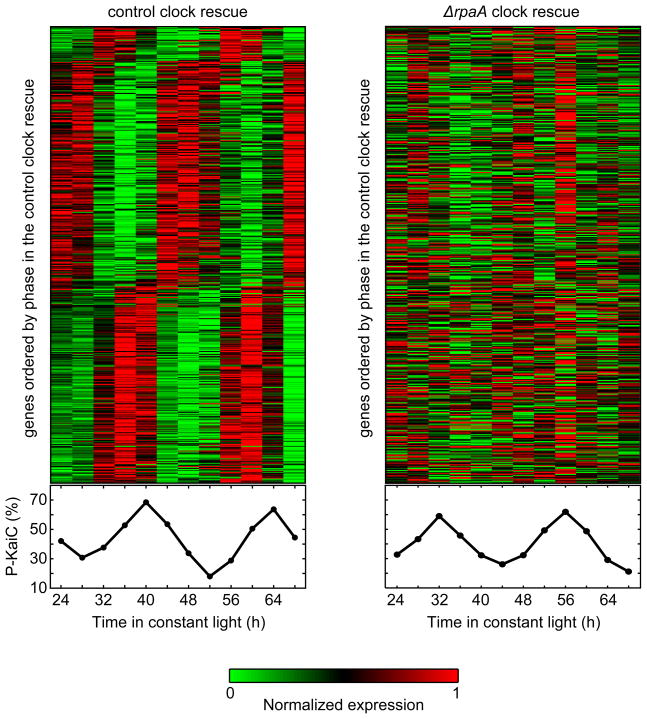
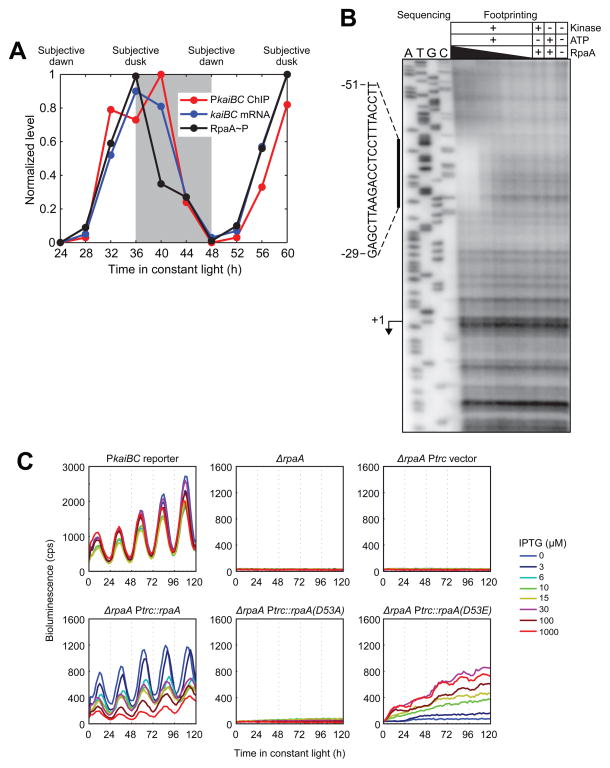
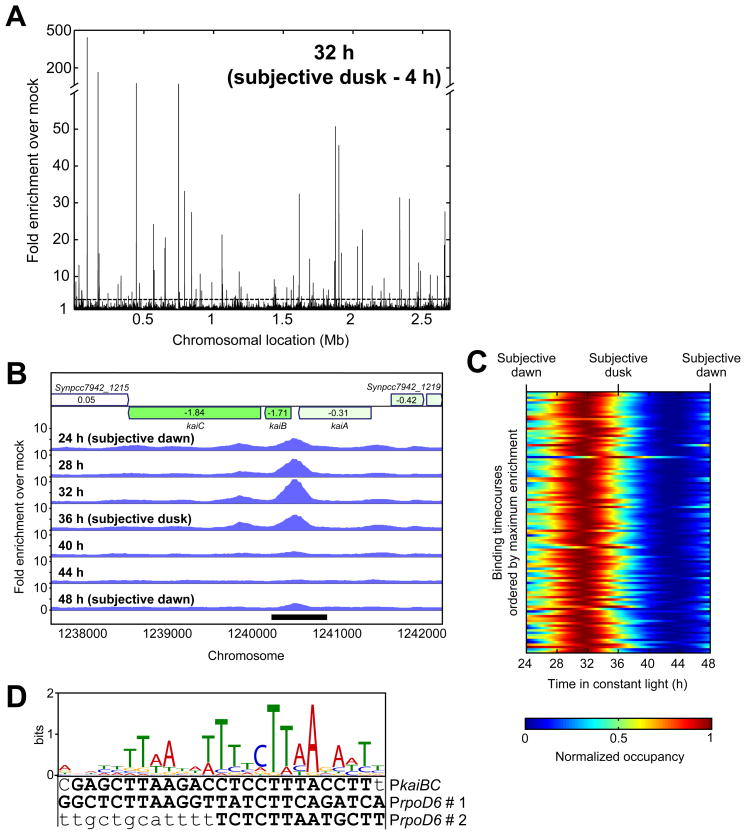
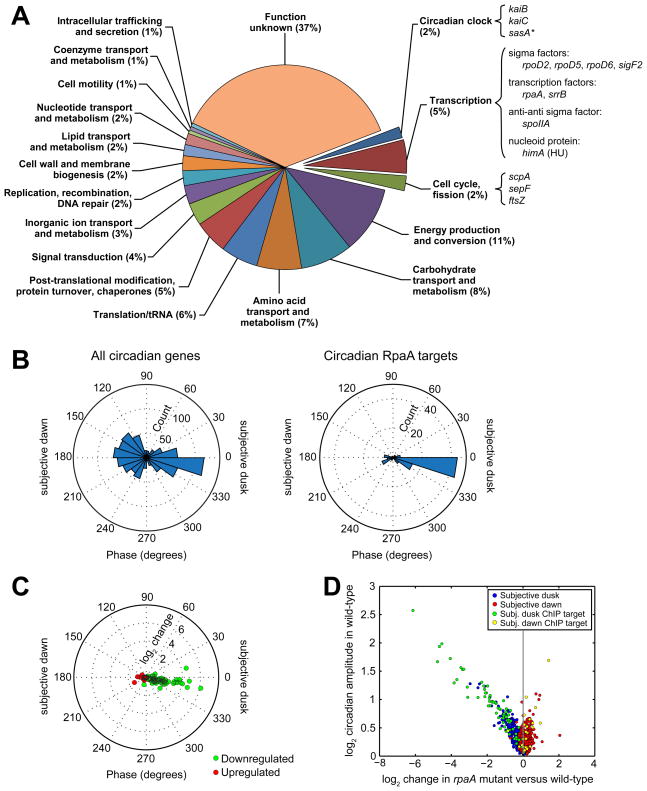
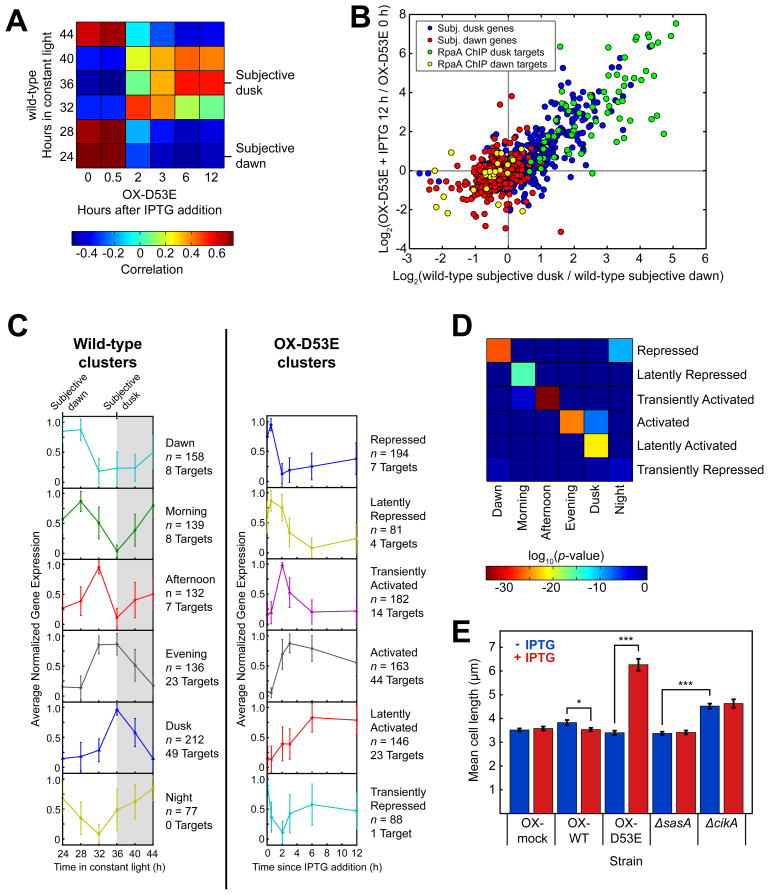
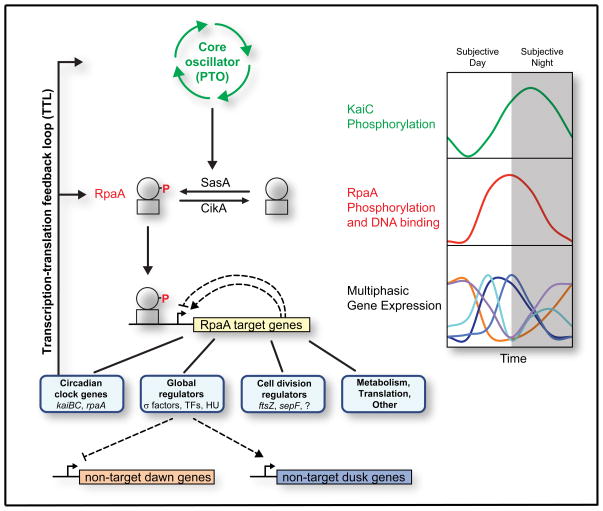
The cyanobacterial circadian clock generates genome-wide transcriptional oscillations and regulates cell division, but the underlying mechanisms are not well understood. Here, we show that the response regulator RpaA serves as the master regulator of these clock outputs. Deletion of rpaA abrogates gene expression rhythms globally and arrests cells in a dawn-like expression state. Although rpaA deletion causes core oscillator failure by perturbing clock gene expression, rescuing oscillator function does not restore global expression rhythms. We show that phosphorylated RpaA regulates the expression of not only clock components, generating feedback on the core oscillator, but also a small set of circadian effectors that, in turn, orchestrate genome-wide transcriptional rhythms. Expression of constitutively active RpaA is sufficient to switch cells from a dawn-like to a dusk-like expression state as well as to block cell division. Hence, complex global circadian phenotypes can be generated by controlling the phosphorylation of a single transcription factor.


Figures

Figure 1
Figure 1. Gene expression is globally perturbed by deletion of rpaA
A. Global gene expression timecourse in the wild-type and rpaA mutant. (Left) Circadian gene expression in the wild-type strain (data from Vijayan et al, 2009). Expression timecourses of genes reproducibly oscillating with a circadian period (n = 856; see Extended Experimental Procedures) were normalized to the interval [0 1] and sorted by phase. (Right) Gene expression in the rpaA mutant. Expression timecourse of the same set of genes as in wild-type, displayed in the same order. B. Comparison of gene expression change in the rpaA mutant with circadian amplitude in the wild-type strain. We computed the expression change in the rpaA mutant by comparing the average rpaA mutant expression over one day with the average wild-type expression over one day (see Experimental Procedures). Only genes that oscillate with circadian periodicity in the wild-type strain are shown (n = 856). kaiB and kaiC are indicated; kaiA is not classified as circadian and hence is not shown. C. Correlation of global gene expression in the rpaA mutant with each timepoint in the wild-type timecourse. Expression of all genes (both circadian and non-circadian) in the rpaA mutant was time-averaged as in Figure 1B, and the correlation between this time-averaged expression and the expression in the wild-type strain at each timepoint over a 60-h timespan was computed. Wild-type data are from Vijayan et al., 2009. Subjective night is shaded. Subjective dawn occurs at 24, 48, and 72 h, while subjective dusk falls at 36 and 60 h. See also Figure S1 and Table S1.
Figure 2
Figure 2. RpaA is required for control of global gene expression by the PTO
(Left) Gene expression timecourse upon rescue of Kai oscillator function in a ΔkaiBC background via ectopic expression of kaiBC (ΔkaiBC Ptrc::kaiBC, termed the “control clock rescue”). The heatmap shows the expression timecourse of the 471 genes that oscillate with a circadian period in the control clock rescue in each of two biological replicates, with genes normalized individually and ordered by phase. KaiC phosphorylation levels during the timecourse are shown below the heatmap. (Right) Gene expression timecourse upon rescue of Kai oscillator function in the absence of rpaA via ectopic expression of kaiBC (ΔrpaA ΔkaiBC Ptrc::kaiBC, termed the “ΔrpaA clock rescue”). The heatmap shows the expression timecourse of the same set of genes as in (A), displayed in the same order. KaiC phosphorylation levels during the timecourse are shown below the heatmap. See also Figure S2 and Table S2.
Figure 3
Figure 3. RpaA binds to the kaiBC promoter in vivo and in vitro and promoteskaiBC expression in a phosphorylation-dependent manner
A. Correlation between RpaA phosphorylation, RpaA enrichment at the kaiBC promoter, and abundance of the kaiBC transcript. Subjective night is shaded. RpaA phosphorylation was measured by Phos-tag Western blot (see Figure S3B for gel image), association with PkaiBC by ChIP-qPCR, and kaiBC expression by RT-qPCR. Note that while the apex of the ChIP-qPCR enrichment is at 40 h (four hours after subjective dusk) in this experiment, the precise phase of RpaA (as well as that of global gene expression oscillations) varies between experiments, with RpaA binding typically peaking at or a few hours before subjective dusk. B. In vitro DNase I footprinting of RpaA on the kaiBC promoter as a function of recombinant RpaA phosphorylation and concentration. Sanger sequencing reactions used to identify the location of the footprint are shown on the left; footprinting reactions are shown on the right. The region protected from digestion by RpaA~P is indicated by the vertical bar. The kaiBC transcription start site (Kutsuna et al., 2005) is indicated with an arrow. RpaA pre-treatment and concentration are indicated above each footprinting lane. RpaA was at least 50% phosphorylated in the presence of both CikA and ATP but was unphosphorylated otherwise (Figure S3D). RpaA was added to a final concentration of 6.0, 3.0, 0.6, 0.3, 0.06, or 0.03 μM as indicated by the thickness of the wedge. C. Activity of the kaiBC promoter was assayed using a PkaiBC::luxAB luciferase reporter in various genetic backgrounds: wild-type, ΔrpaA, and ΔrpaA expressing wild-type RpaA, unphosphorylatable RpaA (D53A), or an RpaA phosphomimetic (D53E) from the IPTG-inducible Ptrc promoter. IPTG was added at the indicated concentration prior to entrainment with two 12-h dark pulses. See also Figure S3.
Figure 4
Figure 4. Identification of RpaA binding sites by ChIP-Seq
A. Genome-wide binding profile of RpaA by ChIP-Seq. The enrichment of read density in the RpaA ChIP-Seq (anti-RpaA antibody on the wild-type strain) at four hours prior to subjective dusk (32 h), relative to the mock ChIP-Seq (anti-RpaA antibody on the rpaA mutant), is plotted as a function of position on the chromosome. The dotted line indicates the 3-fold enrichment cutoff for identification of RpaA binding sites. B. Genome browser view of ChIP-Seq enrichment profiles in the vicinity of the kaiBC locus over one day in the wild-type strain. Genes are shown at the top, with the log2 of their expression change in the rpaA mutant represented by shading (green is decreased expression and red is increased expression) and indicated by the text inside the gene. C. Timecourse of RpaA enrichment at the 110 RpaA binding sites. ChIP-Seq was performed every four hours for 24 h, and enrichment relative to the mock IP was calculated at the location of maximum wild-type ChIP-Seq read density within each binding site. Enrichment at intermediate timepoints was computed by interpolation with cubic splines. Each row in the heatmap represents the binding timecourse for one binding site; the rows are sorted by the maximum enrichment observed during the timecourse, which ranged from 411-fold (top) to 3.1-fold (bottom). The dynamic range (maximum enrichment divided by minimum enrichment for each binding site) varied from 38-fold to 1.4-fold. D. A 25-basepair motif is overrepresented near RpaA binding sites (E-value, 1.7 × 10−36; Table S4A) and is found within the RpaA~P footprint in the kaiBC promoter (Figure 3B) and in both footprints in the rpoD6 promoter (Figure S4E). Bases protected by RpaA~P binding in the DNase I footprinting assays are capitalized and boldfaced. See also Figure S4 and Tables S3 and S4.
Figure 5
Figure 5. The RpaA regulon
A. Functional characterization of protein and tRNA ChIP targets of RpaA. We identified 134 transcripts closest to the 110 binding sites (see Extended Experimental Procedures). Of those transcripts, 93 encode proteins or tRNAs (corresponding to 170 genes, some of which are co-expressed in operons), while the other 41 are classified as non-coding RNAs (Vijayan et al., 2011). Because the function of the non-coding RNAs is not known, we restrict our functional analysis to the 170 protein-coding or tRNA genes (“RpaA ChIP target genes”). RpaA ChIP target genes were categorized as described in the Extended Experimental Procedures. Some genes of particular interest are highlighted. The asterisk (*) indicates that the gene’s classification as an RpaA ChIP target is artifactual because of assignment to an incorrectly-demarcated operon containing a bona fide target (Vijayan et al., 2011). B. Comparison of the distribution of phases of all circadian genes (left, n = 856, from Figure 1A) and of the ChIP target genes whose expression oscillates with circadian periodicity (right, n = 95). C. Change in expression of circadian ChIP target genes downregulated (green, n = 72) or upregulated (red, n = 23) in the rpaA mutant plotted as a function of their phase in the wild-type strain. D. Comparison of gene expression change in the rpaA mutant with circadian amplitude in the wild-type strain (from Figure 1B). Only genes that oscillate with circadian periodicity in the wild-type strain are shown (n = 856). Circadianly-expressed RpaA ChIP target genes (n = 95) are highlighted. See also Tables S1 and S6.
Figure 6
Figure 6. RpaA orchestrates global circadian gene expression and controls the cell division gate
A. Correlation between the expression of circadian genes (n = 856) in the wild-type strain over the course of one day and the expression of those genes in the ΔrpaA ΔkaiBC Ptrc::rpaA(D53E) (OX-D53E) strain before (t = 0 h) and after induction with IPTG. Gene expression was measured by RNA-Seq. B. Correlation between the change in expression of circadian genes (n = 856) caused by induction of RpaA(D53E) in the OX-D53E strain (y-axis) with the change in expression between subjective dusk and dawn in the wild-type strain (x-axis). RpaA ChIP target genes are highlighted (n = 95; 71 subjective dusk and 24 subjective dawn). Gene expression was measured by RNA-Seq. C. K-means identification of gene expression clusters in the wild-type and OX-D53E strains. Gene expression was measured by RNA-Seq. With K = 6, wild-type circadian genes (n = 856) were separated into six clusters with distinct expression phases (left), consistent with previous microarray observations (Vijayan et al., 2009). Timecourses of the same set of genes in the OX-D53E strain were also clustered using K = 6 (right). The traces show the average normalized timecourse of genes within each cluster; error bars show standard deviation. The numbers of all genes (n) and RpaA ChIP target genes in each cluster are indicated. Non-coding RNAs were not included in this analysis. D. Mapping between clusters in the wild-type (x-axis) and OX-D53E (y-axis) strains. Each element of the heatmap shows the log10 of the statistical significance (Fisher’s exact test) of the overlap between the corresponding clusters on each axis. E. Mean cell lengths in ΔrpaA ΔkaiBC strains containing a Ptrc promoter driving expression of wild-type RpaA (OX-WT), RpaA(D53E) (OX-D53E), or an empty multi-cloning site (OX-mock) grown in the presence (red) or absence (blue) of the inducer IPTG (100 μM). At least 80 cells were analyzed for each strain. Error bars show standard error of the mean (SEM). *, p < 0.05; ***, p < 10−13 (one-way ANOVA). See also Figure S5 and Table S6.
Figure 7
Figure 7. Model for RpaA and the cyanobacterial circadian program
Model for control of clock output by RpaA. Time encoded in the PTO is transduced into RpaA phosphorylation via SasA and CikA, producing oscillations in RpaA~P (red) that phase-lead those of phosphorylated KaiC (green) by approximately 4 hours (Gutu and O’Shea, 2013). RpaA~P binds to DNA and controls the expression of the RpaA regulon, which consists of global regulators, cell division regulators, certain clock genes (kaiBC and rpaA), and genes involved in metabolism and translation. The global regulators are at the top of a transcriptional cascade that orchestrates multiphasic circadian gene expression, repressing subjective dawn genes while activating subjective dusk genes. Fine patterns within the dusk and dawn categories could be generated by a network of interactions amongst RpaA ChIP targets (hypothetical positive and negative feedbacks are shown as dotted lines). RpaA control of kaiBC and rpaA expression forms the clock TTL.

References

    1. Abruzzi KC, Rodriguez J, Menet JS, Desrochers J, Zadina A, Luo W, Tkachev S, Rosbash M. Drosophila CLOCK target gene characterization: implications for circadian tissue-specific gene expression. Genes Dev. 2011;25:2374–2386. - PMC - PubMed
    1. Ashby MK, Mullineaux CW. Cyanobacterial ycf27 gene products regulate energy transfer from phycobilisomes to photosystems I and II. FEMS Microbiol Lett. 1999;181:253–260. - PubMed
    1. Dong G, Yang Q, Wang Q, Kim YI, Wood TL, Osteryoung KW, van Oudenaarden A, Golden SS. Elevated ATPase activity of KaiC applies a circadian checkpoint on cell division in Synechococcus elongatus. Cell. 2010;140:529–539. - PMC - PubMed
    1. Ducat DC, Way JC, Silver PA. Engineering cyanobacteria to generate high-value products. Trends Biotechnol. 2011;29:95–103. - PubMed
    1. Edery I. A master CLOCK hard at work brings rhythm to the transcriptome. Genes Dev. 2011;25:2321–2326. - PMC - PubMed

Publication types

Substances

Associated data