. 2013 Dec 5;155(6):1422-34.
doi: 10.1016/j.cell.2013.11.004.

Using optogenetics to interrogate the dynamic control of signal transmission by the Ras/Erk module

Affiliations

Using optogenetics to interrogate the dynamic control of signal transmission by the Ras/Erk module

Jared E Toettcher et al. Cell. .

Abstract

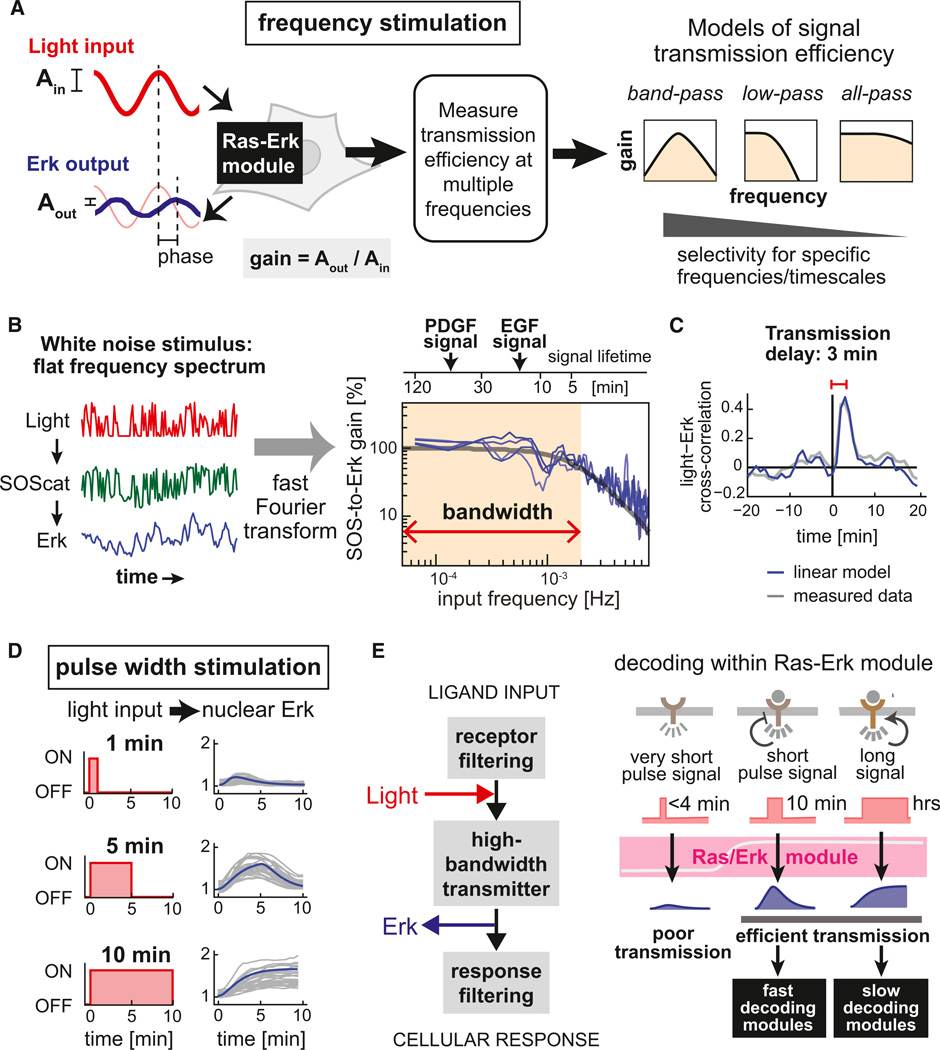
The complex, interconnected architecture of cell-signaling networks makes it challenging to disentangle how cells process extracellular information to make decisions. We have developed an optogenetic approach to selectively activate isolated intracellular signaling nodes with light and use this method to follow the flow of information from the signaling protein Ras. By measuring dose and frequency responses in single cells, we characterize the precision, timing, and efficiency with which signals are transmitted from Ras to Erk. Moreover, we elucidate how a single pathway can specify distinct physiological outcomes: by combining distinct temporal patterns of stimulation with proteomic profiling, we identify signaling programs that differentially respond to Ras dynamics, including a paracrine circuit that activates STAT3 only after persistent (>1 hr) Ras activation. Optogenetic stimulation provides a powerful tool for analyzing the intrinsic transmission properties of pathway modules and identifying how they dynamically encode distinct outcomes.


Figures

Figure 1
Figure 1. Cellular Optogenetics: Approaches for Dissecting Complex Signaling Networks
(A) Optogenetic inputs can be used to stimulate a single intracellular node to isolate subnetworks within the full physiological signaling response network. (B) By applying time-varying light inputs, it is possible to dissect how dynamics are transmitted and drive specific responses. (C) These approaches can be used to understand how a shared signaling node can yield distinct responses when reused in multiple physiological pathways. Specificity can be encoded by distinct combinations of activated pathways (left panel) or by the dynamics of activation (e.g., duration or amplitude) of a single pathway (right panel). (D) Direct optogenetic activation of shared nodes provides a powerful approach to dissect these mechanisms of encoding.
Figure 2
Figure 2. Opto-SOS: Engineering a Light-Gated Switch to Drive Ras Activation
(A) Light drives the heterodimerization of membrane-localized Phy with a cytoplasmic PIF-tagged SOScat construct, leading to Ras activation and nuclear translocation of BFP-Erk2. (B) Representative fluorescent images of YFP-PIF-SOScat (upper panels) and BFP-Erk (lower panels) from an NIH 3T3 opto-SOS cell under inactivating and activating light, showing light-dependent cytoplasmic depletion of SOScat and nuclear Erk accumulation. (C) The fold-change in nuclear Erk intensity in response to activating (650 nm) and inactivating (750 nm) light inputs (n = 3 cells). Still images from (B) are taken at starred time points. Mean + SEM. (D) NIH 3T3 opto-SOS cells proliferate after stimulation with either 100 ng/µl PDGF or red light, measured by an increase in S-G2 DNA content after serum starvation (histograms, shaded area). (E) PC12 opto-SOS cells differentiate after stimulation with either 100 ng/µl NGF or red light, measured by neurite outgrowth after 24 hr. (F) Growth factor activates both Ras/Erk and PI3K/Akt signaling; optogenetic inputs could be selective for Ras/Erk. (G) Time course of phospho-Erk and phospho-Akt western blots of NIH 3T3 opto-SOS cells stimulated by either 100 ng/µl PDGF or red light; opto-SOS activation is specific for Erk but not Akt signaling. See also Figure S1.
Figure 3
Figure 3. Single-Cell SOS-to-Erk Dose Responses Show that Stimulus Levels Are Precisely Transmitted by Individual Cells
(A) Both light-gated input (membrane localization of PIF-YFP-SOScat) and output (nuclear BFP-Erk fold-change) can be measured in live cells over time, revealing full dose-response relationships in each cell. (B) All cells in a field of light-stimulated NIH 3T3 opto-SOS cells exhibit membrane SOScat translocation (upper panels) and nuclear Erk translocation (lower panels). (C) Single-cell dose-response curves from four representative cells. Each point shows the membrane SOScat and nuclear Erk nuclear fold-change induced by a defined red/infrared light ratio (mean + SD). (D) The SOScat/Erk activity induced in each cell by light across a population of 25 single cells. Envelope shows the variability of single-cell fits across the population. (E) SOScat-to-Erk dose responses for two representative cells, where envelopes show the confidence in dose-response curve fit for each cell, overlaid on the cell-to-cell variability from (D) (dotted lines). See also Figure S2 and Movies S1 and S2.
Figure 4
Figure 4. The Ras/Erk Module Is a High-Bandwidth, Low-Pass Filter, Faithfully Transmitting Dynamic Signals from 4 min to 2 hr
(A) By applying oscillating light inputs and measuring responses, a pathway’s gain (output versus input amplitude) and phase shift (delay in peak response) can be obtained at each frequency. Possible frequency-response behaviors range from the narrow response of a band-pass filter to broad all-pass transmission. (B) Left panel: Measuring the response to a light input containing multiple frequencies can efficiently reconstruct entire frequency responses from individual cells. Right panel: The frequency responses of five cells (blue curves) match a linear second-order low-pass filter (gray line). Upper timeline shows activation pulse timescales that correspond to stimulus frequencies shown on the x axis; typical Erk-response lifetimes (for PDGF and EGF stimulation) are shown. (C) The mean cross-correlation between light input and nuclear Erk fold-change from five cells (gray line) and the predicted low-pass filter response of the linear frequency response model from (B) (blue line) show a 3 min delay of Erk activation following light input. (D) Single-cell pulse responses from 25 cells (gray lines), shown with predictions of the linear frequency response model from (B) (blue lines). (E) A model of signal transmission by the Ras/Erk module. Very short input stimuli are filtered and ignored by the Ras/Erk module, whereas inputs from minutes to hours are faithfully and efficiently transmitted by the MAPK cascade. The distinct patterns of Erk activity are then likely decoded by downstream dynamic filtering modules (black boxes). See also Figure S3.
Figure 5
Figure 5. A Proteomic Screen Identifies Proteins downstream of Ras/Erk Signaling that Decode Dynamic Inputs
(A) Downstream proteins are measured in response to 100 ng/µl PDGF or transient (20 min) and sustained (2 hr) light inputs by reverse phase protein array (RPPA). (B and C) Scatter plots showing PDGF-responsive proteins (B; black circles) and light-responsive proteins (C; red circles) as well as the rest of the 180 protein RPPA panel (gray circles). Black diagonal lines indicate identical responses between unstimulated and stimulated conditions. (D–F) Twenty-seven proteins show a clear response to either light or PDGF. The responses of class I (D), II (E), and III (F) nodes are shown after PDGF, constant light, and pulsed light. Upper panels: RPPA results for each responding protein are feature normalized (i.e., mean-subtracted and divided by SD) and shown in false color. Lower panels show relative protein levels over time, normalized for protein loading, for three representative proteins in each class. See also Figure S4.
Figure 6
Figure 6. The Erk-to-STAT3 Circuit Is a Paracrine Persistence Detector
(A) Proposed model whereby Ras-stimulated cell activates JAK/STAT signaling in neighboring cells by cytokine secretion. (B) Immunofluorescence images of mixed WT and opto-SOS NIH 3T3 cells: untreated (left), stimulated with the STAT3 activator IL-6 (middle), or stimulated with light (right). Membrane Phy-mCherry-CAAX expression (red) and nuclear phospho-STAT3 (green) are shown. (C) These data suggest a model whereby light-stimulated opto-SOScells secrete aSTAT3-activating ligand but are themselves insensitive toSTAT3-activating ligand. (D) An experimental test for persistence detection: measuring whether a 2 hr continuous light input is sensed differently than two 1 hr light inputs. (E) Immunofluorescence images of mixed opto-SOS and WT NIH 3T3 cells stimulated by the light inputs in (D). Fluorescent channels are as in (B). (F) Quantification of nuclear pSTAT3 (mean + SEM) from opto-SOS and WT cells in (E). Dotted line shows signal corresponding to low STAT3 response in light-treated opto-SOS cells. See also Figures S5 and S6.
Figure 7
Figure 7. Dynamic Signal Processing downstream of the Ras/Erk Module
(A) A broad range of dynamics are transmitted through the Ras/MAPK module to Erk activation (representative timecourses shown in blue) and are differentially sensed by “fast” and “slow” downstream decoding modules (representative timecourses shown in green). (B) Diverse responses identified by our array-based proteomics screen. Shown are pathway combinations activated by PDGF but not Ras (brown nodes), “fast” responding modules (red nodes), and “slow” responding modules (blue nodes) across a number of canonical signaling pathways. Gold arrows represent connections for which optogenetic Ras/Erk signaling is sufficient for activation, and gray nodes/arrows are not directly measured by our technique.

References

    1. Albeck JG, Mills GB, Brugge JS. Frequency-modulated pulses of ERK activity transmit quantitative proliferation signals. Mol. Cell. 2013;49:249–261. Published online December 6, 2012. - PMC - PubMed
    1. Amit I, Citri A, Shay T, Lu Y, Katz M, Zhang F, Tarcic G, Siwak D, Lahad J, Jacob-Hirsch J, et al. A module of negative feedback regulators defines growth factor signaling. Nat. Genet. 2007;39:503–512. - PubMed
    1. Barber MA, Donald S, Thelen S, Anderson KE, Thelen M, Welch HC. Membrane translocation of P-Rex1 is mediated by G protein betagamma subunits and phosphoinositide 3-kinase. J. Biol. Chem. 2007;282:29967–29976. - PubMed
    1. Bishop JM, Capobianco AJ, Doyle HJ, Finney RE, McMahon M, Robbins SM, Samuels ML, Vetter M. Proto-oncogenes and plasticity in cell signaling. Cold Spring Harb. Symp. Quant. Biol. 1994;59:165–171. - PubMed
    1. Boyden ES, Zhang F, Bamberg E, Nagel G, Deisseroth K. Millisecond-timescale, genetically targeted optical control of neural activity. Nat. Neurosci. 2005;8:1263–1268. - PubMed

Publication types