. 2013 Dec 3;18(6):816-30.
doi: 10.1016/j.cmet.2013.11.001.

Obesity activates a program of lysosomal-dependent lipid metabolism in adipose tissue macrophages independently of classic activation

Affiliations

Obesity activates a program of lysosomal-dependent lipid metabolism in adipose tissue macrophages independently of classic activation

Xiaoyuan Xu et al. Cell Metab. .

Abstract

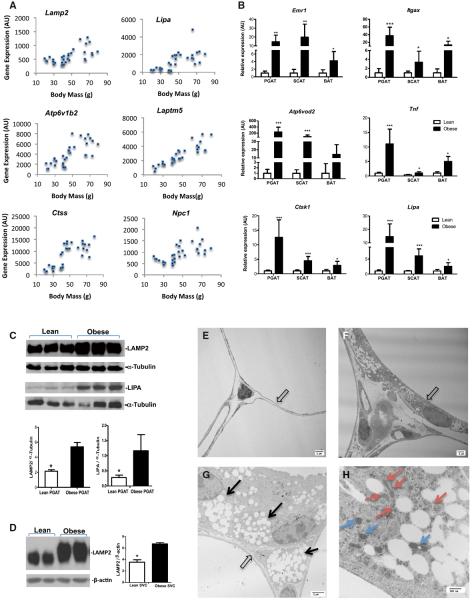
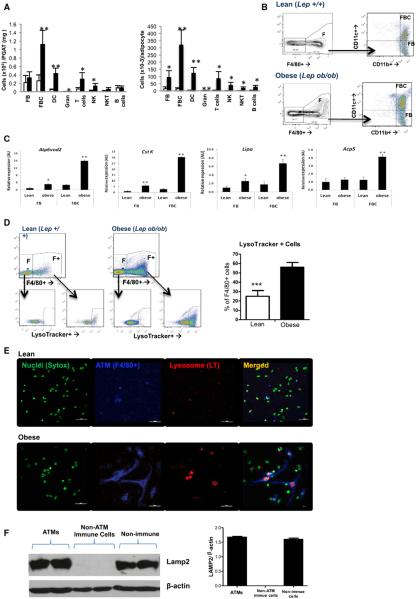
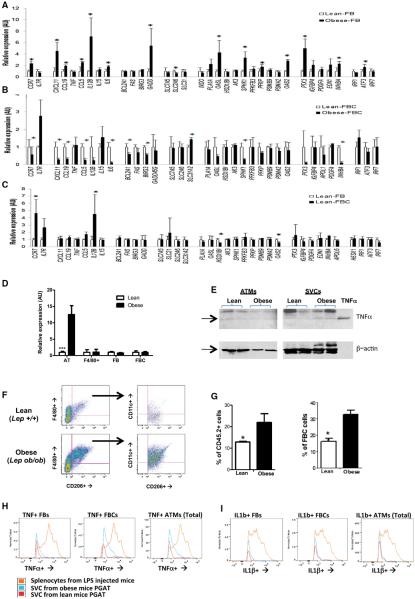
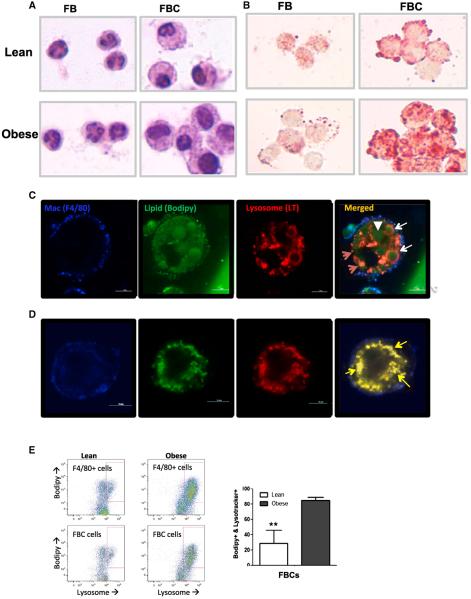
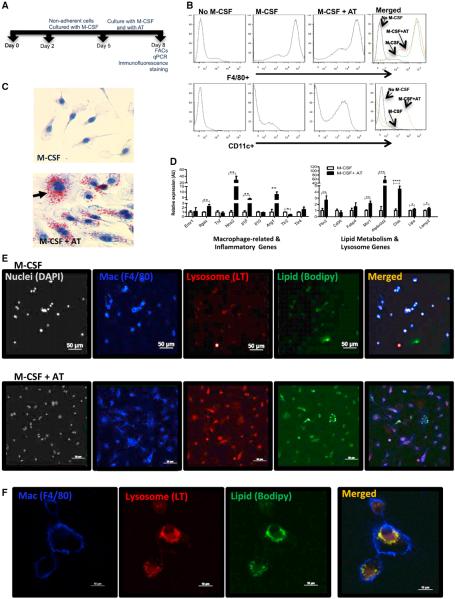
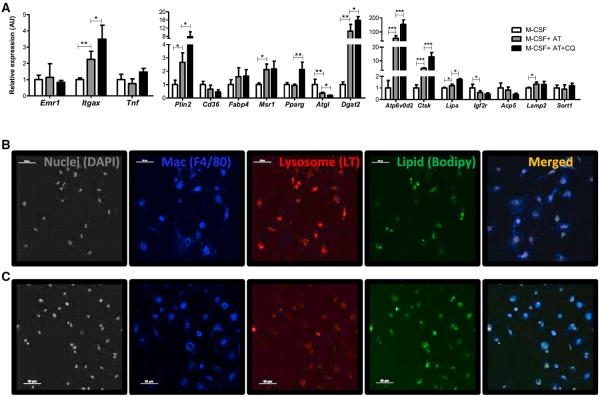
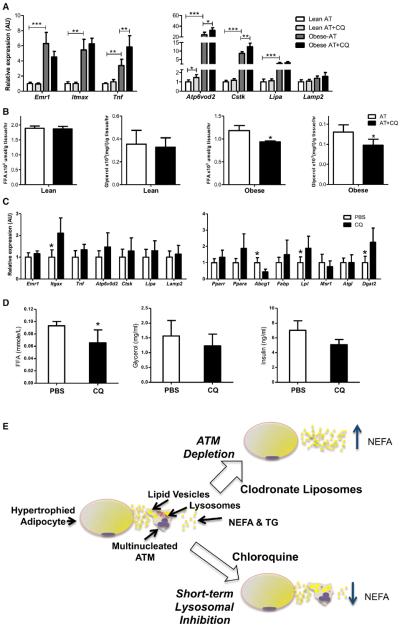
Obesity activates a complex systemic immune response that includes the recruitment of macrophages and other immune cells to key metabolic tissues. Current models postulate that obesity and excess lipids classically activate macrophages, polarizing them toward an M1 (inflammatory) state. Little is known about noninflammatory functions of adipose tissue macrophages (ATMs). Here, we show that the expansion of adipose tissue (AT) across models of obesity induces a program of lysosome biogenesis in ATMs and is associated with lipid catabolism but not a classic inflammatory phenotype. This program is induced by factors produced by AT and is tightly coupled to lipid accumulation by ATMs. Inhibition of ATM lysosome function impairs lipid metabolism and increases lipid content in ATMs and reduces whole AT lipolysis. These data argue that ATMs contribute quantitatively to the development of obesity-induced inflammation but also serve an important role in lipid trafficking independent of their inflammatory phenotype.


Figures

Figure 1
Figure 1. Obesity Activates a Program of Lysosome Biogenesis in Adipose Tissue
(A) PGAT expression of genes encoding lysosome structural proteins (Lamp2 and Laptm5), hydrolases (Lipa and Ctss), and transport proteins (Npc and Atp6v0d2) correlate with body mass. (B) The expression of macrophage (Emr1 and Itgax) inflammatory (Tnf) and lysosome (Adp6v0d2, Ctss, and Lipa) genes in multiple fat depots including PGAT, inguinal subcutaneous (SCAT), and intrascapular BAT from obese (C57BL/6J Lepob/ob) and lean (C57BL/6J Lep+/+) mice (n = 6). (C) The expression of the lysosome protein LAMP2 and LIPA in whole PGAT. (D and E) The expression of LAMP2 protein is strongly increased in SVCs of PGAT from obese (C57Bl/6J Lepob/ob) and lean (C57Bl/6J Lep+/+) mice; representative western blots and quantification (n = 2). Transmission electron micrographs of PGAT from a lean (C57BL/6J Lep+/+) mouse with thin adipocytes (E, open arrows) and few other interstitial cells or lysosomes. (F and G) PGAT from obese (C57BL/6J Lepob/ob) mice revealing many interstitial nonadipocyte cells. At higher magnification, these nonadipocyte contain lipid-filled vesicles (G, black arrows). (H) The lipid-filled vesicles are surrounded by lysosomal-like structures (red arrows) and mitochondria (blue arrows) in nonadipocyte cells (outlines) (*p < 0.05, **p < 0.01, ***p < 0.005, ****p < 0.001). All values are means ± SD. See also Table S1 and Figure S1.
Figure 2
Figure 2. Obesity Activities Lysosome Biogenesis in ATMs
(A) Quantification of individual immune cell populations, including CD11c− (FB) and CD11c+ (FBC) macrophages, dendritic cells (DCs), granulocytes (Gran), T cells, NK cells (NK), NKT cells (NKT), and B cells in PGAT from lean (C57BL/6J Lep+/+) and obese (C57BL/6J Lepob/ob) PGAT SVCs as measured by FACS (n = 5–6). (B) FBC and FB macrophages were purified from lean and obese PGAT with FACS and profiled with expression microarrays. (C) The expression of lysosome genes was increased in both CD11c− (FBs) and CD11c+ (FBCs) from obese mice in comparison to lean mice (n = 4). (D) Lysosome content as measured by a fluorescent amine (LysoTracker) that accumulates in acidic cellular compartments is increased in F4/80+ ATMs (F+) from obese mice but not other immune cells (F−); representative FACS and quantification (n = 5). (E) With the use of immunofluorescence staining of SVCs to identify nuclei (Sytox, green), macrophages (F4/80+, blue) and lysosomes (LysoTracker, red) revealed that most ATMs from obese mice contain visible lysosomes. Lysosomes were also visible in a population of non-ATM SVCs from obese mice (calibration mark = 40 mm). (F) The expression of LAMP2 protein in ATMs (F4/80+), nonmacrophage immune cells (CD45+, F4/80−), and nonimmune SVCs from PGAT of obese (C57BL/6J Lepob/ob) mice (n = 4; *p < 0.05, **p < 0.01, ***p < 0.005). All values are means ± SD. See also Figure S2.
Figure 3
Figure 3. Obesity Does Not Classically Activate or M1 Polarize ATMs
The expression of genes activated by M1 polarization of macrophages in (A) lean (C57BL/6J Lep+/+) and obese (C57BL/6J Lepob/ob) CD11c− (FB) or (B) CD11c+ (FBC) macrophages. (C) Relative expression of M1 polarization genes in FBs from FBCs from lean mice (n = 5). (D) Expression of Tnf, the prototypical M1 activation gene, in whole PGAT, ATMs (F4/80+), and subpopulations of FBs and FBCs from lean and obese mice. (E) TNFa protein protein expression in whole SVCs and purified ATMs from obese mice in comparison to lean mice. The last lane contains purified TNFa (10 pg) as a positive control. (F) Typical FACS plot of SVCs expressing the M2-marker CD206 and (G) increased numbers of CD206+ ATMs in PGAT from obese compared to lean mice as either the fraction of all immune CD45.2+ or fraction of ATMs. (H) Typical FACS histograms of FBs, FBCs or all ATMs stained for TNFa. The beige curve represents data from splenocytes isolated from a mouse injected with LPS. (I) Typical FACS histograms of FBs, FBCs or all ATMs stained for IL1b (n = 4). The beige curve represents data from splenocytes isolated from a mouse injected with LPS (*p < 0.05, **p < 0.01, ***p < 0.005). All values are means ± SD. See also Figure S3.
Figure 4
Figure 4. Lysosomes Accumulate in Lipid-Laden ATMs
(A and B) Purified FB (CD11c−) and FBC (CD11c+) ATMs from lean (C57BL/6J Lep+/+) and obese (C57BL/6J Lepob/ob) mice stained with hematoxylin (A) or Oil Red O (B) in order to reveal morphology and lipid content, respectively. (C) Immunofluorescent confocal images of buoyant ATMs (copurify with adipocytes) isolated from the AT of obese mice and containing large lipid vesicles. (D) Immunofluorescent confocal images of a live nonbuoyant ATM (with classic SVCs) containing smaller lipid vesicles. Lipid-laden ATMs expressing the macrophage specific antigen F4/80 (blue) and containing lipid (green) vesicles and lysosomes (red). White arrowheads identify large lipid-containing vesicles, red arrows indicate lysosomes, white arrows indicate lipid vesicles with acidic rings, and yellow arrows indicate colocalization of lysosome and lipid staining. Calibration mark = 10 μm. (E) Lipid and lysosome content of macrophages (F/80+ cells) and FBCs from lean and obese mice were quantified by FACS (n = 5; **p < 0.01). All values are means ± SD. See also Figure S4.
Figure 5
Figure 5. Adipose Tissue Induces an ATM Phenotype without Inflammation
(A) Cartoon of ATM differentiation protocol with timeline of bone marrow cells cultured with M-CSF (CSF-1) in the absence or presence of AT. (B) F4/80+ and CD11c+ populations identified by FACS among bone marrow cells differentiated in the absence of both M-CSF and AT in the presence of M-CSF only or in the presence of both M-CSF and AT. (C) Hematoxylin and Oil Red O staining for lipid of bone marrow cells differentiated with M-CSF in the absence or presence of AT. (D) Inconsistent induction of inflammatory gene expression when bone marrow cells are differentiated in the presence of AT; activation of lipid metabolism and lysosome genes by AT-induced differentiation (n = 5). (E) Immunofluorescent staining of bone marrow cells differentiated in the absence or presence of AT to identify nuclei (DAPI, silver), macrophages (F4/80+, blue), lysosomes (LysoTracker [LT], red), and neutral lipid (Bodipy, green). Calibration mark = 50 μm. (F) High magnification of immunofluorescent stained confocal images. Calibration mark = 10 μm (*p < 0.05, **p < 0.01, ***p < 0.005). All values are means ± SD. See also Figure S5.
Figure 6
Figure 6. Inhibition of Lysosome Function Increases Lipid Accumulation in ATMs
(A) The expression of macrophage-related, lysosome and lipid metabolism genes in AT induced in ATM-like cells in the presence or absence of chloroquine. (n = 6; *p < 0.05, **p < 0.01, ***p < 0.005). (B and C) Immunofluorescent confocal images of lysosomes and lipid among in vitro differentiated ATMs (B) and ATMs treated with chloroquine (C). Nuclei were identified with DAPI, macrophages (Mac) with an anti-F4/80, lysosomes with LT, neutral lipid with Bodipy. All values are means ± SD. See also Figure S6.
Figure 7
Figure 7. Lysosome Function Modulates Lipolysis in Macrophage-Rich Adipose Tissue
(A) Expression of macrophage and lysosome genes from PGAT of lean (C57BL/6J Lep+/+) and obese (C57BL/6J Lepob/ob) mice treated ex vivo with chloroquine. (B) The effect of lysosome inhibition by chloroquine on the release of free fatty acids and glycerol from PGAT of lean and obese mice. (C) Macrophage, lysosome, and lipid metabolism genes in PGAT 24 hr after injection of either PBS or chloroquine. (D) Circulating concentrations of free fatty acids, glycerol, and insulin 24 hr after injection of PBS or chloroquine into PGAT of obese mice (n = 5–6; *p < 0.05, **p < 0.01, ***p < 0.005). All values are means ± SD. (E) During the development of obesity, adipocytes undergo hypertrophy and apoptosis, leading to increases in the local concentrations of lipids, including NEFAs and TGs. Excess lipids are recognized by the immune system and increase the accumulation of ATMs. By uptaking extracellular lipids, ATMs buffer surrounding cells from lipotoxic effects. Once in ATMs, the lipids are directed to lysosomal pathway of catabolism. In the absence of ATMs after clodronate treatment, the release of NEFAs by AT is increased. Conversely, short-term inhibition of lysosomal catabolism increases lipid content of ATMs and reduces net lipolysis of AT. Inhibition of lysosomes may reduce lipolysis through direct stoichiometric effects on lipid fluxes or via increased production of antilipolytic factors as lipid content increases in ATMs.

Comment in

References

    1. Benoit FL. The inhibitory effect of chloroquine on rat adipose tissue metabolism in vitro. Metabolism. 1967;16:557–561. - PubMed
    1. Bourlier V, Zakaroff-Girard A, Miranville A, De Barros S, Maumus M, Sengenes C, Galitzky J, Lafontan M, Karpe F, Frayn KN, Bouloumié A. Remodeling phenotype of human subcutaneous adipose tissue macrophages. Circulation. 2008;117:806–815. - PubMed
    1. Chawla A, Nguyen KD, Goh YP. Macrophage-mediated inflammation in metabolic disease. Nat. Rev. Immunol. 2011;11:738–749. - PMC - PubMed
    1. Edwards JR, Mundy GR. Advances in osteoclast biology: old findings and new insights from mouse models. Nat Rev Rheumatol. 2011;7:235–243. - PubMed
    1. Feuerer M, Herrero L, Cipolletta D, Naaz A, Wong J, Nayer A, Lee J, Goldfine AB, Benoist C, Shoelson S, Mathis D. Lean, but not obese, fat is enriched for a unique population of regulatory T cells that affect metabolic parameters. Nat. Med. 2009;15:930–939. - PMC - PubMed

Publication types

MeSH terms

Associated data