. 2013 Dec 19;155(7):1451-63.
doi: 10.1016/j.cell.2013.11.024. Epub 2013 Dec 5.

Microbiota modulate behavioral and physiological abnormalities associated with neurodevelopmental disorders

Affiliations

Microbiota modulate behavioral and physiological abnormalities associated with neurodevelopmental disorders

Elaine Y Hsiao et al. Cell. .

Abstract

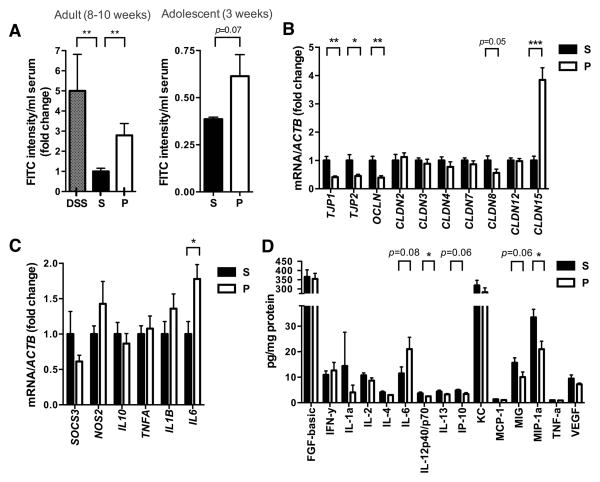
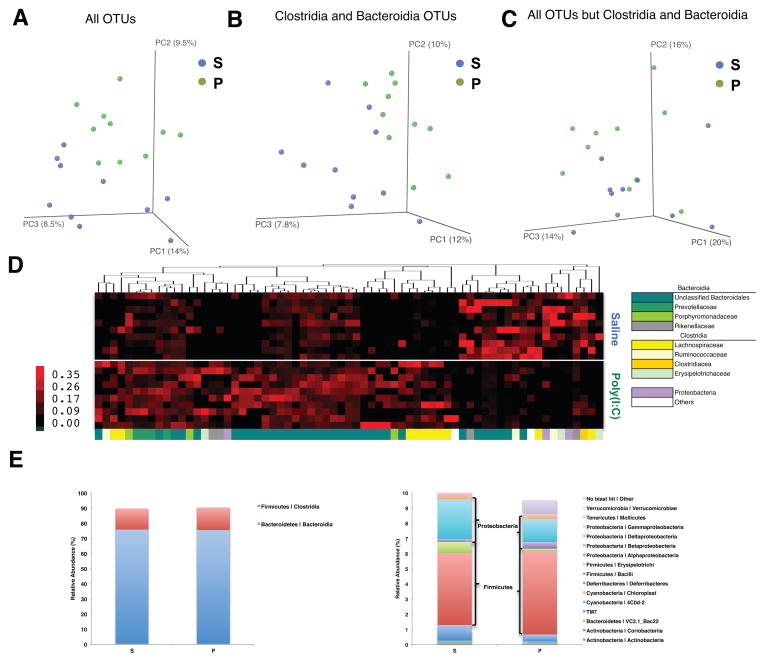
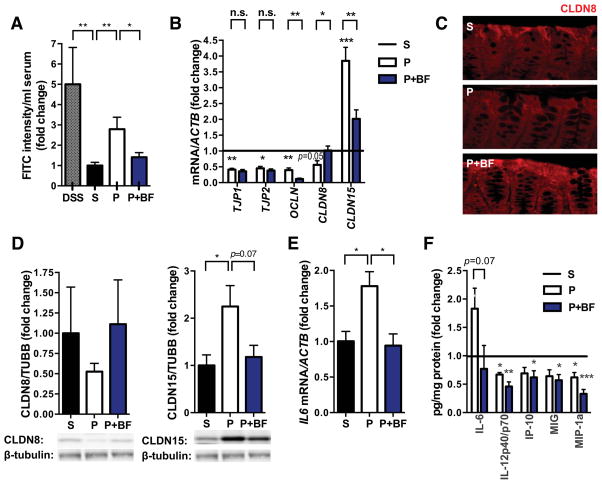
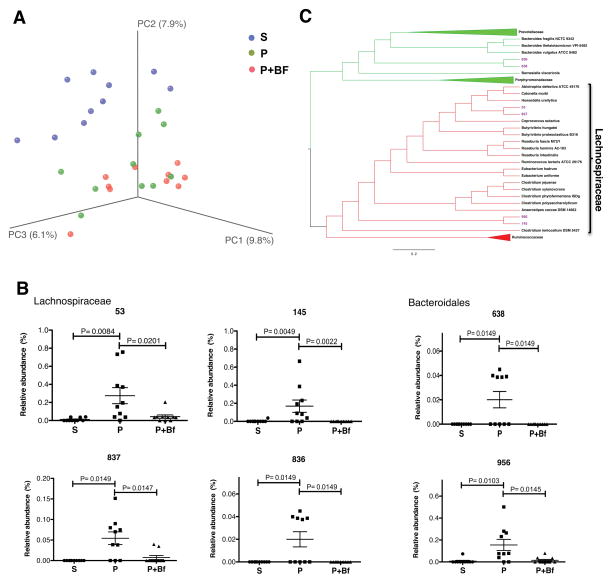
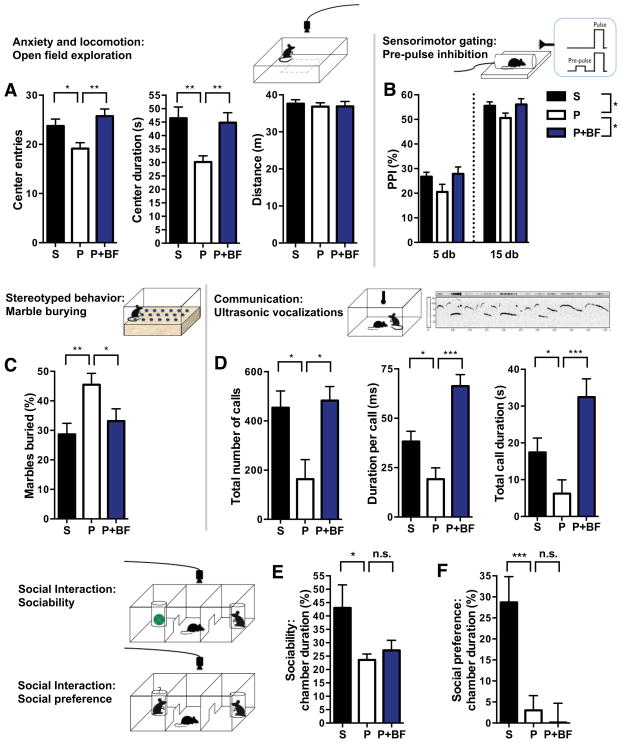
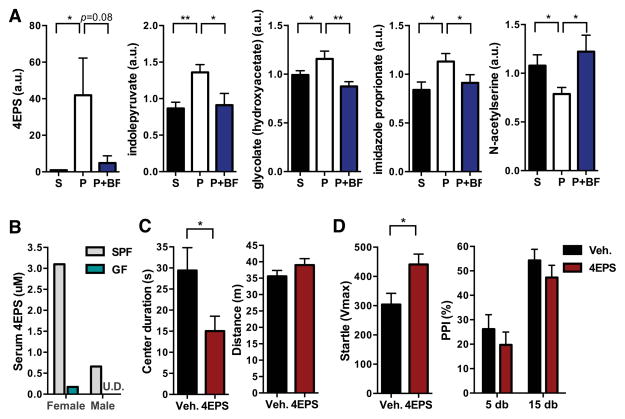
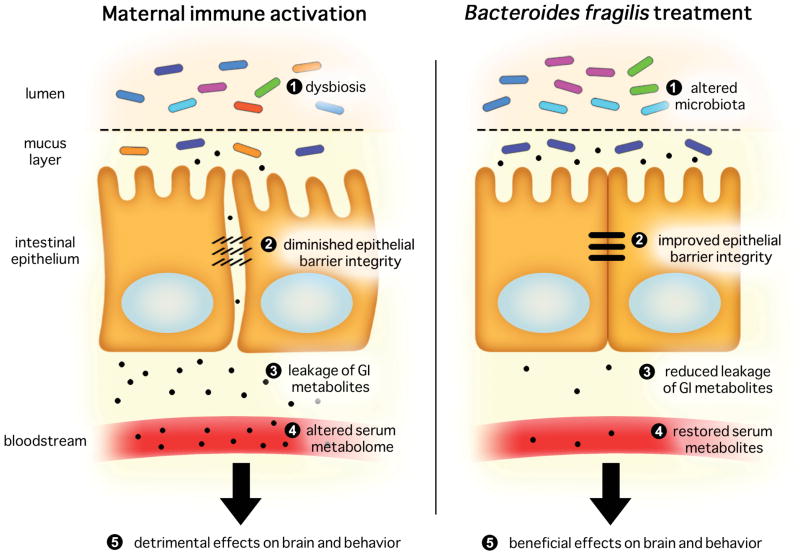
Neurodevelopmental disorders, including autism spectrum disorder (ASD), are defined by core behavioral impairments; however, subsets of individuals display a spectrum of gastrointestinal (GI) abnormalities. We demonstrate GI barrier defects and microbiota alterations in the maternal immune activation (MIA) mouse model that is known to display features of ASD. Oral treatment of MIA offspring with the human commensal Bacteroides fragilis corrects gut permeability, alters microbial composition, and ameliorates defects in communicative, stereotypic, anxiety-like and sensorimotor behaviors. MIA offspring display an altered serum metabolomic profile, and B. fragilis modulates levels of several metabolites. Treating naive mice with a metabolite that is increased by MIA and restored by B. fragilis causes certain behavioral abnormalities, suggesting that gut bacterial effects on the host metabolome impact behavior. Taken together, these findings support a gut-microbiome-brain connection in a mouse model of ASD and identify a potential probiotic therapy for GI and particular behavioral symptoms in human neurodevelopmental disorders.


Conflict of interest statement

Conflict of interests: None

Figures

Figure 1
Figure 1. MIA Offspring Exhibit GI Barrier Defects and Abnormal Expression of Tight Junction Components and Cytokines
(A) Intestinal permeability assay, measuring FITC intensity in serum after oral gavage of FITC-dextran. Dextran sodium sulfate (DSS): n=6, S (saline+vehicle): adult n=16; adolescent n=4, P (poly(I:C)+vehicle): adult n=17; adolescent n=4. Data are normalized to saline controls. (B) Colon expression of tight junction components relative to β-actin. Data for each gene are normalized to saline controls. n=8/group (C) Colon expression of cytokines and inflammatory markers relative to β-actin. Data for each gene are normalized to saline controls. n=6–21/group (D) Colon protein levels of cytokines and chemokines relative to total protein content. n=10/group For each experiment, data were collected simultaneously for poly(I:C)+B. fragilis treatment group (See Figure 3). See also Figure S1.
Figure 2
Figure 2. MIA Offspring Exhibit Dysbiosis of the Intestinal Microbiota
(A) Unweighted UniFrac-based 3D PCoA plot based on all OTUs. (B) Unweighted UniFrac-based 3D PCoA plot based on subsampling of Clostridia and Bacteroidia OTUs (2003 reads per sample). (C) Unweighted UniFrac-based 3D PCoA plot based on subsampling of OTUs remaining after subtraction of Clostridia and Bacteroidia OTUs (47 reads per sample). (D) Relative abundance of unique OTUs of the gut microbiota (bottom, x-axis) for individual biological replicates (right, y-axis), where red huesde note increasing relative abundance of a unique OTU. (E) Mean relative abundance of OTUs classified at the class level for the most (left) and least (right) abundant taxa. n=10/group. Data were simultaneously collected and analyzed for poly(I:C)+B. fragilis treatment group (See Figure 4). See also Figure S2 and Table S1.
Figure 3
Figure 3. B. fragilis Treatment Corrects GI Deficits in MIA offspring
(A) Intestinal permeability assay, measuring FITC intensity in serum after oral gavage of FITC-dextran. Data are normalized to saline controls. Data for DSS, saline (S) and poly(I:C) (P) are as in Figure 1. poly(I:C)+B. fragilis (P+BF): n=9/group (B) Colon expression of tight junction components relative to β-actin. Data for each gene are normalized saline controls. Data for S and P are as in Figure 1. Asterisks directly above bars indicate significance compared to saline control (normalized to 1, as denoted by the black line), whereas asterisks at the top of the graph denote statistical significance between P and P+BF groups. n=8/group (C) Immunofluorescence staining for claudin 8. Representative images for n=5. (D) Colon protein levels of claudin 8 (left) and claudin 15 (right). Representative signals are depicted below. Data are normalized to signal intensity in saline controls. n=3/group (E) Colon expression of IL-6 relative to β-actin. Data are normalized to saline controls. Data for S and P are as in Figure 1. P+BF: n=3/group (F) Colon protein levels of cytokines and chemokines relative to total protein content. Data are normalized to saline controls. Data for S and P are as in Figure 1. n=10/group See also Figure S1.
Figure 4
Figure 4. B. fragilis Treatment Alters the Intestinal Microbiota and Corrects Species-Level Abnormalities in MIA Offspring
(A) Unweighted UniFrac-based 3D PCoA plot based on all OTUs. Data for saline (S) and poly(I:C) (P) are as in Figure 2. (B) Relative abundance of key OTUs of the family Lachnospiraceae (top) and order Bacteroidales (bottom) that are significantly altered by MIA and restored by B. fragilis treatment. (C) Phylogenetic tree based on nearest-neighbor analysis of 16S rRNA gene sequences for key OTUs presented in panel B. Red clades indicate OTUs of the family Lachnospiraceae and green clades indicate OTUs of the order Bacteriodales. Purple taxa indicate OTUs that are significantly elevated in P and corrected by B. fragilis(BF) treatment. n=10/group. See also Figure S2 and Table S2.
Figure 5
Figure 5. B. fragilis Treatment Ameliorates Autism-Related Behavioral Abnormalities in MIA Offspring
(A) Anxiety-like and locomotor behavior in the open field exploration assay. n=35–75/group (B) Sensorimotor gating in the pre-pulse inhibition (PPI) assay. n=35–75/group (C) Repetitive marble burying assay. n=16–45/group (D) Ultrasonic vocalizations produced by adult male mice during social encounter. n=10/group S=saline+vehicle, P=poly(I:C)+vehicle, P+BF=poly(I:C)+B. fragilis. Data were collected simultaneously for poly(I:C)+B. fragilisΔPSA and poly(I:C)+B. thetaiotaomicron treatment groups(See also Figures S3 and S4).
Figure 6
Figure 6. B. fragilis Treatment Corrects MIA-Mediated Changes in 4-ethylphenylsulfate (4EPS), a Microbe-Dependent Metabolite that Induces Anxiety-like Behavior
(A) Relative quantification of metabolites detected by GC/LC-MS that are significantly altered by MIA and restored by B. fragilis treatment. n=8/group (B) Serum concentrations of 4EPS detected by LC-MS. n=1, where each represents pooled sera from 3–5 mice (C) Anxiety-like and locomotor behavior in the open field exploration assay. n=10/group (D) Potentiated startle reflex in the pre-pulse inhibition (PPI) assay. n=10/group S=saline+vehicle, P=poly(I:C)+vehicle, P+BF=poly(I:C)+B. fragilis, SPF=specific pathogen-free (conventionally-colonized), GF=germ-free, Veh.=vehicle (saline), 4EPS=4-ethylphenylsulfate. U.D.=undetectable. See also Figures S5, S6 and S7 and Tables S3 and S4.
Figure 7
Figure 7. Proposed Microbiota-Gut-Brain Connection in the MIA Model
Adult offspring of immune-activated mothers exhibit dysbiosis of the gut microbiota, with corresponding increases in intestinal permeability, altered intestinal expression of tight junction components and cytokines, changes in the serum metabolome and abnormal autism-related behaviors. Treatment of MIA offspring with B. fragilis further alters the composition of the gut microbiota, improves gut barrier integrity and restores levels of particular serum metabolites that can cause downstream effects on brain and behavior.

Comment in

References

    1. Abdallah MW, Larsen N, Grove J, Norgaard-Pedersen B, Thorsen P, Mortensen EL, Hougaard DM. Amniotic fluid inflammatory cytokines: Potential markers of immunologic dysfunction in autism spectrum disorders. The world journal of biological psychiatry : the official journal of the World Federation of Societies of Biological Psychiatry. 2013;14:528–538. - PubMed
    1. Adams JB, Johansen LJ, Powell LD, Quig D, Rubin RA. Gastrointestinal flora and gastrointestinal status in children with autism--comparisons to typical children and correlation with autism severity. BMC Gastroenterol. 2011;11:22. - PMC - PubMed
    1. Altieri L, Neri C, Sacco R, Curatolo P, Benvenuto A, Muratori F, Santocchi E, Bravaccio C, Lenti C, Saccani M, et al. Urinary p-cresol is elevated in small children with severe autism spectrum disorder. Biomarkers. 2011;16:252–260. - PubMed
    1. Atladottir HO, Pedersen MG, Thorsen P, Mortensen PB, Deleuran B, Eaton WW, Parner ET. Association of family history of autoimmune diseases and autism spectrum disorders. Pediatrics. 2009;124:687–694. - PubMed
    1. Atladottir HO, Thorsen P, Ostergaard L, Schendel DE, Lemcke S, Abdallah M, Parner ET. Maternal infection requiring hospitalization during pregnancy and autism spectrum disorders. J Autism Dev Disord. 2010;40:1423–1430. - PubMed

Publication types