. 2013 Dec 12;39(6):1082-1094.
doi: 10.1016/j.immuni.2013.10.017. Epub 2013 Dec 5.

The inhibitory receptor BTLA controls γδ T cell homeostasis and inflammatory responses

Affiliations

The inhibitory receptor BTLA controls γδ T cell homeostasis and inflammatory responses

Vasileios Bekiaris et al. Immunity. .

Abstract

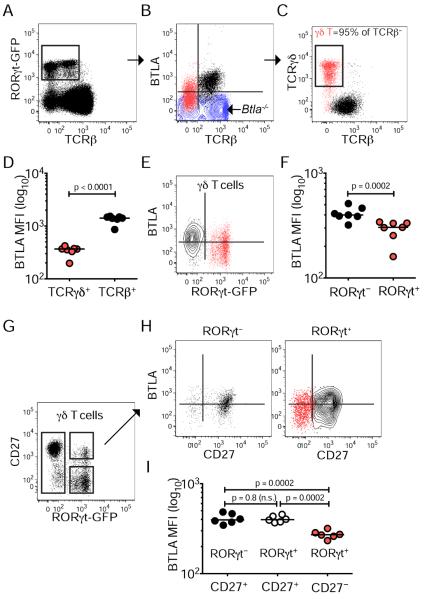
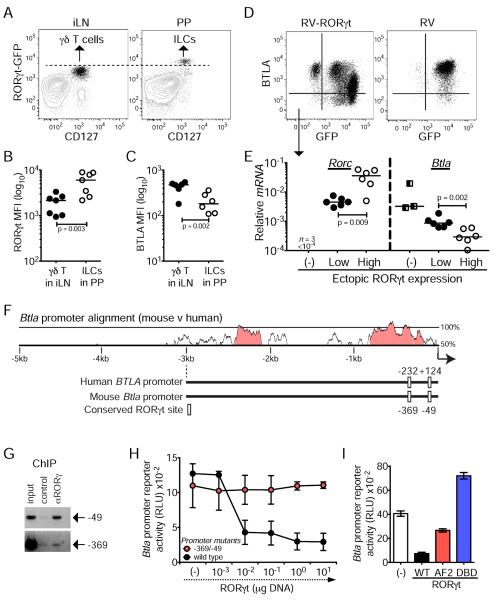
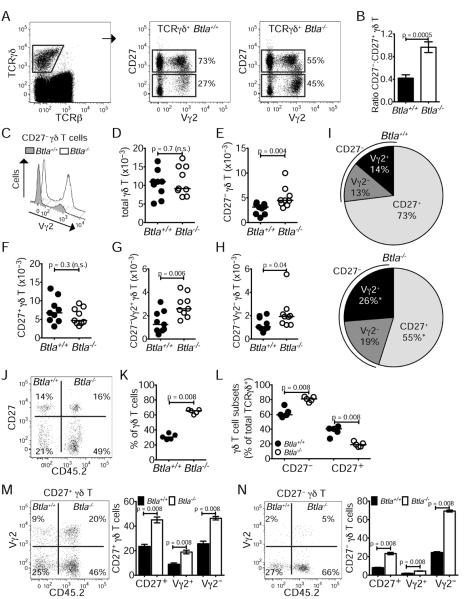
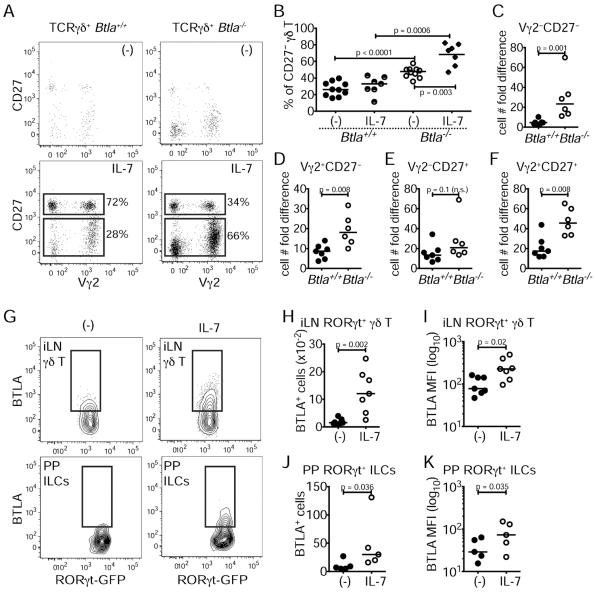
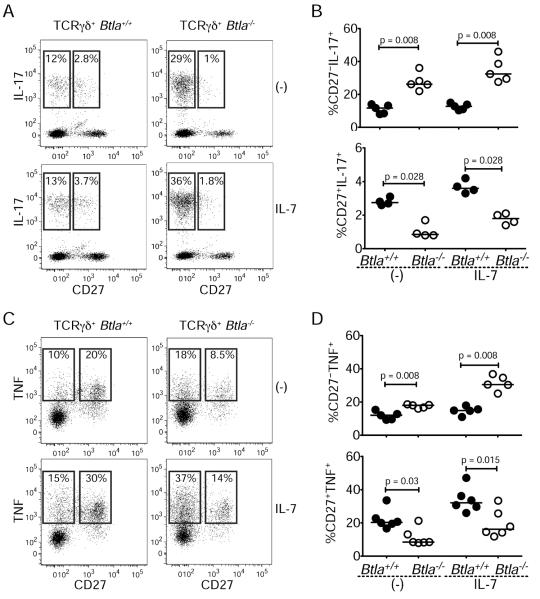
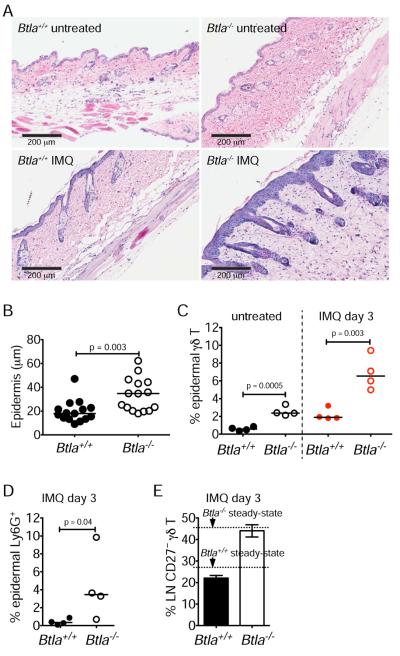
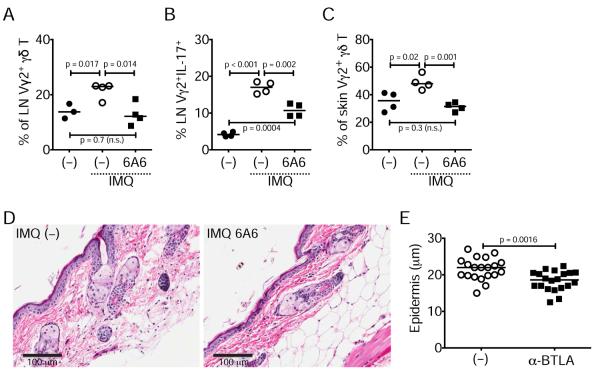
γδ T cells rapidly secrete inflammatory cytokines at barrier sites that aid in protection from pathogens, but mechanisms limiting inflammatory damage remain unclear. We found that retinoid-related orphan receptor gamma-t (RORγt) and interleukin-7 (IL-7) influence γδ T cell homeostasis and function by regulating expression of the inhibitory receptor, B and T lymphocyte attenuator (BTLA). The transcription factor RORγt, via its activating function-2 domain, repressed Btla transcription, whereas IL-7 increased BTLA levels on the cell surface. BTLA expression limited γδ T cell numbers and sustained normal γδ T cell subset frequencies by restricting IL-7 responsiveness and expansion of the CD27(-)RORγt(+) population. BTLA also negatively regulated IL-17 and TNF production in CD27(-) γδ T cells. Consequently, BTLA-deficient mice exhibit enhanced disease in a γδ T cell-dependent model of dermatitis, whereas BTLA agonism reduced inflammation. Therefore, by coordinating expression of BTLA, RORγt and IL-7 balance suppressive and activation stimuli to regulate γδ T cell homeostasis and inflammatory responses.


Figures

Figure 1
Figure 1. Reduced BTLA expression in CD27 γδ T cells
Lymphocytes isolated from the iLN of Rorcgfp/+ mice were analyzed by flow cytometry for BTLA expression and the indicated T cell subset surface markers. Expression of RORγt and TCRβ (A), BTLA and TCRβ in RORγt-gated cells (B), TCRγδ and TCRβ in RORγt-gated cells (C), BTLA and RORγt in γδ T cells (E), CD27 and RORγt in γδ T cells (G), and BTLA and CD27 in RORγt (left) and RORγt+ (right) γδ T cells (H). (D, F, I) Mean fluorescent intensity (MFI) for BTLA expression in TCRγδ+ and TCRβ+ cells (D), in RORγt and RORγt+ γδ T cells (F), and in CD27+RORγt, CD27+RORγt+ and CD27RORγt+ γδ T cells (I). Each FACS plot is representative of six mice; in graphs, each symbol represents a mouse and lines are medians. See also Figure S1
Figure 2
Figure 2. RORγt is a transcriptional repressor of Btla
(A) Expression of RORγt and CD127 in freshly isolated lymphocytes gated on TCRβ live cells from the iLN (left) and PP (right) of Rorcgfp/+ mice (representative of 8 mice). (B, C) MFI for RORγt-GFP expression in iLN γδ T cells and PP ILCs (B), and for BTLA expression in RORγt+ γδT cells and ILCs (C). (D) Expression of BTLA and GFP in cells transduced with pMSCV-IRES-GFP-RORγt retrovirus (RV-RORγt) or with empty retrovirus (RV) (representative of two transduction experiments and six different passages after transduction). (E) mRNA levels (relative to L32) of Rorc and Btla in FACS-sorted RORγt-GFP, RORγt-GFPLow and RORγt-GFPHigh cells that were transduced with RV-RORγt (each symbol represents a different passage of the indicated FACS-sorted cell populations). In (B–C) each symbol represents a mouse and in (B) lines are medians. (F) VISTA plot of sequence similarity (>70%, 100 bp, pink) between the 5kb promoter regions of the human and mouse BTLA coding genes and graphical representation of the conserved RORγt binding sites and their positions relative to the transcription start (indicated by arrow). (G) PCR analysis using primers specific for the RORγt binding sites −49 and −369 following a ChIP assay with anti-RORγ or control IgG in RV-RORγt transduced cells (representative of two experiments). (H) Btla promoter reporter activity in Jurkat cells co-transfected with wild type or mutated promoter, and the indicated amounts of RORγt expressing plasmid (mean±sem of two experiments with two replicates each). (I) Btla promoter reporter activity in Jurkat cells co-transfected with wild-type promoter in the presence or absence of wild-type (wt) or Activation Function domain 2 (AF2)-mutant or DNA Binding Domain (DBD)-mutant RORγt (mean±sem of two experiments with two replicates each). See also Figure S2.
Figure 3
Figure 3. BTLA negatively regulates the homeostasis of γδ T cells in lymph nodes
Lymphocytes isolated from the iLN of Btla+/+ and Btla−/− mice were analyzed for TCRγδ, TCRβ, CD27 and Vγ2 expression by flow cytometry. (A) Expression of CD27 and Vγ2 in TCRγδ+TCRβ gated cells from Btla+/+ and Btla−/− mice. (B) Ratio of CD27:CD27+ γδ T cells in Btla+/+ and Btla−/− mice. (C) Offset overlayed histograms indicate the increase in CD27Vγ2+ cells in Btla−/− mice. (D–H) Numbers of γδ T cells. (D) total, (E) CD27, (F) CD27+, (G) CD27Vγ2, (H) CD27Vγ2+. (I) Pie charts showing the distribution of CD27+, CD27Vγ2+ and CD27Vγ2 γδ T cells in Btla+/+ (top) and Btla−/− (bottom) mice (* denotes a p value < 0.05). Each FACS plot is representative of nine mice from three experiments; in the graphs, each symbol represents a mouse and lines are medians. (J–N) Mice were lethally irradiated and reconstituted with a 1:1 mixture of Btla+/+ (CD45.2) and Btla−/− (CD45.2+) bone marrow, and blood at three weeks (J–L) or iLN at eight weeks (M–N) following reconstitution were analyzed. (J) FACS plot indicates frequencies of γδ T cell subsets in TCRγδ+TCRβ gated cells. (K, L) Percentage (%) of CD45.2+ Btla−/− and CD45.2Btla+/+ total γδ T cells (K), or of CD45.2+ Btla−/− and CD45.2Btla+/+ γδ T cell subsets (L) in blood. (M, N) Frequencies of CD45.2+ Btla−/− and CD45.2Btla+/+ CD27+ γδ T cell subsets (M) or of CD45.2+ Btla−/− and CD45.2Btla+/+ CD27 γδ T cell subsets (N) in iLN. Graphs show percentages of CD45.2+ Btla−/− and CD45.2Btla+/+ within CD27+ (M) or CD27 (N) subsets (left bars), and within Vγ2+/− fractions (right bars). Data are representative of five mice; in scatter graphs, each symbol represents a mouse and lines are medians; bar graphs show mean±sem of five mice. See also Figure S3.
Figure 4
Figure 4. IL-7 and BTLA form a negative feedback loop
Equal numbers of lymphocytes from the iLN of Btla+/+ and Btla−/− mice were cultured for four days with or without 10 ng/ml IL-7. (A) Expression of CD27 and Vγ2 with or without IL-7 in TCRγδ+TCRβ gated cells. (B) Percentage (%) of Btla+/+ and Btla−/− CD27 γδ T cells with or without IL-7. (C–F) The fold difference in γδ T cell cellularity as defined by the ratio of cell number with or without IL-7. (C) Vγ2CD27 γδ T cells, (D) Vγ2+CD27 γδ T cells, (E) Vγ2CD27+ γδ T cells, (F) Vγ2+CD27+ γδ T cells (FACS plots are representative of four experiments; in graphs each symbol represents an experiment and lines are medians). (G–K) Lymphocytes from the iLN and PP of Rorcgfp/+ mice were enriched for ILCs and CD27 γδ T cells and cultured with or without IL-7 for two days (cells are RORγt+TCRβ gated). (G) Expression of BTLA and RORγt in iLN γδ T cells (top) and PP ILCs (bottom) with or without IL-7. (H) Numbers of BTLA+ iLN γδ T cells. (I) MFI for BTLA expression in iLN γδ T cells. (J) Numbers of BTLA+ PP ILCs. (K) MFI for BTLA expression in PP ILCs. FACS plots are representative of seven (iLN) or five (PP) independent experiments. In graphs each symbol represents an experiment and lines are medians. See also Figure S4.
Figure 5
Figure 5. BTLA regulates γδ T cell production of IL-17 and TNF
Lymph node lymphocytes from Btla+/+ and Btla−/− mice were cultured for 18 hours with or without IL-7 before stimulating with PMA and ionomycin for 3.5 hours and then analyzed for cytokine production by flow cytometry. (A, C) Expression of IL-17 (A) or TNF (C) and CD27 with (bottom) or without (top) IL-7. (B, D) Percentage of IL-17- (B) or TNF- (D) expressing CD27 (top) or CD27+ (bottom) Btla+/+ and Btla−/− γδ T cells with or without IL-7. Each FACS plot is representative of four experiments; graphs are percent cytokine positive cells within subset gate, each symbol represents an experiment and lines are medians. See also Figure S5.
Figure 6
Figure 6. Btla−/− animals are susceptible to dermatitis
Btla+/+ and Btla−/− mice were treated once with 50 mg Aldara (IMQ) cream and were analyzed three days later (all data are representative of two experiments). (A) H&E staining of skin sections from untreated or IMQ-treated Btla+/+ and Btla−/− mice. (B) Thickness of the epidermis in IMQ-treated mice (each symbol represents an epidermal region within the tissue sections; data are pooled of three mice per group). (C–E) Percentage (%) of epidermal γδ T cells (TCRγδ+Vg3) in untreated or IMQ-treated mice (C), of epidermal Ly6G+ cells in IMQ-treated Btla+/+ and Btla−/− mice (D), and of lymph node (LN) CD27 γδ T cells in IMQ-treated Btla+/+ and Btla−/− mice (E). In (C–D) each symbol represents a mouse and lines are medians. (E) shows mean±sem of four mice. See also Figure S6.
Figure 7
Figure 7. Treatment with agonistic anti-BTLA inhibits γδ T cells and restricts dermatitis
Normal wild-type mice were treated three times with IMQ alone or with IMQ and anti-BTLA (6A6) antibody and at day 6 lymph nodes and skin were analyzed (in graphs each symbol represents a mouse and line is median). (A–C) Percentage (%) of lymph node Vγ2+ CD27 γδ T cells in naïve (–) and IMQ- or IMQ+6A6- treated animals (A), of lymph node Vγ2+CD27IL-17+ γδ T cells in naïve (–) and IMQ- or IMQ+6A6-treated animals (B), and of skin Vγ2+ CD27 γδ T cells in naïve (–) and IMQ- or IMQ+6A6-treated animals (C). (D) H&E staining of skin sections from IMQ- or IMQ+6A6-treated animals (E) Thickness of the epidermis in IMQ- or IMQ+6A6-treated animals (each symbol represents an epidermal region within the tissue sections; data are pooled of four mice per group).

References

    1. Baccala R, Witherden D, Gonzalez-Quintial R, Dummer W, Surh CD, Havran WL, Theofilopoulos AN. Gamma delta T cell homeostasis is controlled by IL-7 and IL-15 together with subset-specific factors. J Immunol. 2005;174:4606–4612. - PubMed
    1. Bekiaris V, Gaspal F, McConnell FM, Kim MY, Withers DR, Sweet C, Anderson G, Lane PJ. NK cells protect secondary lymphoid tissue from cytomegalovirus via a CD30-dependent mechanism. Eur J Immunol. 2009;39:2800–2808. - PubMed
    1. Bekiaris V, Timoshenko O, Hou TZ, Toellner K, Shakib S, Gaspal F, McConnell FM, Parnell SM, Withers D, Buckley CD, et al. Ly49H+ NK cells migrate to and protect splenic white pulp stroma from murine cytomegalovirus infection. J Immunol. 2008;180:6768–6776. - PubMed
    1. Cheung TC, Oborne LM, Steinberg MW, Macauley MG, Fukuyama S, Sanjo H, D'Souza C, Norris PS, Pfeffer K, Murphy KM, et al. T cell intrinsic heterodimeric complexes between HVEM and BTLA determine receptivity to the surrounding microenvironment. J Immunol. 2009;183:7286–7296. - PMC - PubMed
    1. Coenen MJ, Trynka G, Heskamp S, Franke B, van Diemen CC, Smolonska J, van Leeuwen M, Brouwer E, Boezen MH, Postma DS, et al. Common and different genetic background for rheumatoid arthritis and coeliac disease. Hum Mol Genet. 2009;18:4195–4203. - PubMed

Publication types

Substances