. 2014 Feb:50:82-94.
doi: 10.1016/j.exger.2013.11.011. Epub 2013 Dec 3.

Epigallocatechin-3-gallate improves plantaris muscle recovery after disuse in aged rats

Affiliations

Epigallocatechin-3-gallate improves plantaris muscle recovery after disuse in aged rats

Stephen E Alway et al. Exp Gerontol. 2014 Feb.

Abstract

Aging exacerbates muscle loss and slows the recovery of muscle mass and function after disuse. In this study we investigated the potential that epigallocatechin-3-gallate (EGCg), an abundant catechin in green tea, would reduce signaling for apoptosis and promote skeletal muscle recovery in the fast plantaris muscle and the slow soleus muscle after hindlimb suspension (HLS) in senescent animals. Fischer 344 × Brown Norway inbred rats (age 34 months) received either EGCg (50 mg/kg body weight), or water daily by gavage. One group of animals received HLS for 14 days and a second group of rats received 14 days of HLS, then the HLS was removed and they recovered from this forced disuse for 2 weeks. Animals that received EGCg over the HLS followed by 14 days of recovery, had a 14% greater plantaris muscle weight (p<0.05) as compared to the animals treated with the vehicle over this same period. Plantaris fiber area was greater after recovery in EGCg (2715.2±113.8 μm(2)) vs. vehicle treated animals (1953.0±41.9 μm(2)). In addition, activation of myogenic progenitor cells was improved with EGCg over vehicle treatment (7.5% vs. 6.2%) in the recovery animals. Compared to vehicle treatment, the apoptotic index was lower (0.24% vs. 0.52%), and the abundance of pro-apoptotic proteins Bax (-22%), and FADD (-77%) was lower in EGCg treated plantaris muscles after recovery. While EGCg did not prevent unloading-induced atrophy, it improved muscle recovery after the atrophic stimulus in fast plantaris muscles. However, this effect was muscle specific because EGCg had no major impact in reversing HLS-induced atrophy in the slow soleus muscle of old rats.

Keywords: Apoptosis; Catechin; Muscle atrophy; Muscle fiber area; Muscle function; Sarcopenia.


Figures

Figure 1
Figure 1. Muscle wet weight
Muscle wet weight was obtained in the plantaris and the soleus muscles of the hindlimbs in cage control animals treated with the vehicle (n=12) or EGCg (n=12) or in animals that had received either EGCg after 14 days of hindlimb suspension (HLS, n=12/group) or after 14 days of hindlimb suspension followed by 14 days of reloading (Recovery, n=12/group). The animals received EGCg or the vehicle (water) daily by gavage, for a total of 21 days (HLS) or for 32 days (Recovery). *p<0.05, Cage Control vs. treatment group; †p<0.05, Vehicle vs. EGCg treatments. VC, vehicle cage control; EGCg-C, EGCg treated cage control; VHLS, vehicle-treated animals that received either 14 days of HLS only, or 14 days of HLS followed by 14 days of recovery; EGCg-HLS, EGCg treated animals that received either 14 days of HLS only, or 14 days of HLS followed by 14 days of recovery.
Figure 2
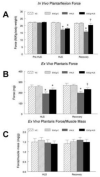
Figure 2. Muscle force
Maximal in vivo in the plantar flexor isometric force (A), ex vivo plantaris isometric force (B), and ex vivo force per plantaris muscle wet weight (C), was measured after 14 days of hindlimb suspension (HLS) and after 14 days of hindlimb suspension followed by 14 days of reloading (Recovery). The animals received either EGCg, or the vehicle (water) daily, for 7 days before and throughout the experimental period. *p<0.05, Cage Control vs. treatment group; †p<0.05, Vehicle vs. EGCg. VC, vehicle cage control; EGCg-C, EGCg treated cage control; VHLS, vehicle-treated animals that received either 14 days of HLS only, or 14 days of HLS followed by 14 days of recovery; EGCg-HLS, EGCg treated animals that received either 14 days of HLS only, or 14 days of HLS followed by 14 days of recovery.
Figure 3
Figure 3. Plantaris muscle fiber morphology
A. Mean fiber cross sectional area was obtained in plantaris muscle of cage control, after 14 days of hindlimb suspension (HLS), or after 14 days of hindlimb suspension followed by 14 days of reloading (Recovery). The animals received EGCg or the vehicle (water) daily by gavage, for a total of 21 days (HLS, Control) or for 32 days (Control and Recovery). *p<0.05, Cage Control vs. treatment group; †p<0.05, Vehicle vs. EGCg. Cumulative frequency distribution of plantaris muscle fibers after 14 days of HLS (B), or after 14 days of hindlimb suspension followed by 14 days of reloading (C). As the fiber area distribution of cage controls was the same, whether they were treated with the vehicle or EGCg, these two control groups were combined into a single control group for data analysis. D. Top row. Representative plantaris cross sections after staining the basal lamina (red) that were obtained from that were cage control (Control), vehicle-gavaged HLS animals (Vehicle-HLS) or EGCg-gavaged HLS animals (EGCg-HLS) animals. Bottom row. Representative plantaris cross sections after staining the basal lamina (red) from cage control (Control), vehicle-gavaged recovery (Vehicle-Recovery) or EGCg-gavaged recovery (EGCg-Recovery) animals. The animals received EGCg or the vehicle (water) daily by gavage, for a total of 21 days (HLS) or for 32 days (Recovery). Nuclei were stained with DAPI.
Figure 4
Figure 4. Soleus muscle fiber morphology
A. Mean fiber cross sectional area was obtained in soleus muscles of cage control, after 14 days of hindlimb suspension (HLS), or after 14 days of hindlimb suspension followed by 14 days of reloading (Recovery). The animals received EGCg or the vehicle (water) daily by gavage, for a total of 21 days (HLS, Control) or for 32 days (Control and Recovery). *p<0.05, Vehicle vs. EGCg. Cumulative frequency distribution of soleus muscle fibers after 14 days of HLS (B), or after 14 days of hindlimb suspension followed by 14 days of reloading (C). As the fiber area distribution of cage controls was the same, whether they were treated with the vehicle or EGCg, these two control groups were combined into a single control group for data analysis. D. Top row. Representative soleus cross sections after staining the basal lamina (red) that were obtained from that were cage control (Control), vehicle-gavaged HLS animals (Vehicle-HLS) or EGCg-gavaged HLS animals (EGCg-HLS) animals. Bottom row. Representative soleus cross sections after staining the basal lamina (red) from cage control (Control), vehicle-gavaged recovery (Vehicle-Recovery) or EGCg-gavaged recovery (EGCg-Recovery) animals. The animals received EGCg or the vehicle (water) daily by gavage, for a total of 21 days (HLS) or for 32 days (Recovery).Nuclei were stained with DAPI.
Figure 5
Figure 5. BrdU labeling in reloaded muscles
Left panel. Representative tissue sections from the plantaris muscle (top row) and soleus muscle (bottom row). Fluorescent staining is shown for BrdU (green) to identify activated myogenic progenitor cells nuclei. DAPI identified all nuclei (blue). The basal lamina (red) was identified the membrane boundaries of the muscle fibers to confirm that the BrdU positive nuclei were myonuclei/myogenic progenitor cells. Right panel. The BrdU labeling index was calculated from tissue cross-sections of the plantaris muscle (top) and the soleus muscle (bottom). The BrdU labeling index was determined from the number of BrdU positive nuclei per total nuclei in after 14 days of reloading. A time released BrdU pellet was placed in the animals after 14 days of HLS, and at the point of reloading the hindlimbs. * p<0.05, Cage Control vs. treatment group; † p<0.05, Vehicle vs. EGCg.
Figure 6
Figure 6. Western blots and analyses for the plantaris muscle
Akt, phosphorylated Akt, and GSK3-ß protein abundance and were determined by Western blot analysis in the plantaris muscles of rats after 14 days of hindlimb suspension (HLS) or after 14 days of HLS followed by 14 days of reloading (Recovery). The animals received EGCg (E) or the vehicle (V) daily by gavage. The data were normalized to GAPDH and were expressed as mean ± SE. * p<0.05, Cage Control vs. treatment group; † p<0.05, Vehicle vs. EGCg.
Figure 7
Figure 7. Western blots and analyses for the soleus muscle
Akt, phosphorylated Akt, and GSK3-ß protein abundance and were determined by Western blot analysis in the soleus muscles of rats after 14 days of hindlimb suspension (HLS) or after 14 days of HLS followed by 14 days of reloading (Recovery). The animals received EGCg (E) or the vehicle (V) daily by gavage. GAPDH was used as a loading control. The data were normalized to GAPDH and were expressed as mean ± SE. * p<0.05, Cage Control vs. treatment group; †p<0.05, Vehicle vs. EGCg.
Figure 8
Figure 8. Apoptotic signaling proteins in the plantaris muscle
Left panel. Apoptotic signaling protein abundance was determined by Western blot analysis in the plantaris muscles of rats under control, hindlimb suspension (HLS), or reloading (Recovery) conditions. The animals received EGCg (E) or the vehicle (V) daily by gavage. GAPDH was used as a loading control. Right panel. The band density and area from the respective apoptotic signaling proteins were quantified and the data were normalized to GAPDH and expressed as mean ± SE.
Figure 9
Figure 9. TUNEL labeling as an indication of apoptosis in the plantaris muscle
Left panel. Representative tissue sections from plantaris muscles, with fluorescent staining for TUNEL (green) to identify apoptotic nuclei in cage control animals and in rats after 14 days of hindlimb suspension (HLS) or following 14 days of reloading that occurred after the 14 days of hindlimb suspension (Recovery). DAPI identified all nuclei (blue). The arrows show TUNEL positive nuclei. Right panel. The apoptotic index was calculated from tissue cross sections of the plantaris muscle by determining the ratio of TUNEL positive nuclei to total nuclei in plantaris muscles of control animals for cage control (Control), hindlimb suspension group (HLS), and after reloading (Recovery) groups. The animals received EGCg or the vehicle (water) daily by gavage. * p<0.05, Cage Control vs. treatment group; † p<0.05, Vehicle vs. EGCg.
Figure 10
Figure 10. Apoptotic signaling proteins in the soleus muscle
Left panel. Apoptotic signaling protein abundance was determined by Western blot analysis in the soleus muscles of rats under control, hindlimb suspension (HLS), or reloading (Recovery) conditions. The animals received EGCg (E) or the vehicle (V) daily by gavage. GAPDH was used as a loading control. Right panel. The band density and area from the respective apoptotic signaling proteins were quantified and the data were normalized to GAPDH and expressed as mean ± SE. *p<0.05, Cage Control vs. treatment group; † p<0.05, Vehicle vs. EGCg..
Figure 11
Figure 11. TUNEL labeling as an indication of apoptosis in the soleus muscle
Left panel. Representative tissue sections from soleus muscles, with fluorescent staining for TUNEL (green) to identify apoptotic nuclei in cage control animals and in rats after 14 days of hindlimb suspension (HLS) or following 14 days of reloading that occurred after the 14 days of hindlimb suspension (Recovery). DAPI identified all nuclei (blue). The arrows show TUNEL positive nuclei. Right panel. The apoptotic index was calculated from tissue cross sections of the soleus muscle by determining the ratio of TUNEL positive nuclei to total nuclei in soleus muscles of control animals for cage control (Control), hindlimb suspension group (HLS), and after reloading (Recovery) groups. The animals received EGCg or the vehicle (water) daily by gavage. *p<0.05, Cage Control vs. treatment group.

References

    1. Adams GR. Satellite cell proliferation and skeletal muscle hypertrophy. Appl.Physiol Nutr.Metab. 2006;31:782–790. - PubMed
    1. Alway SE. Force and contractile characteristics after stretch overload in quail anterior latissimus dorsi muscle. J.Appl.Physiol. 1994;77:135–141. - PubMed
    1. Alway SE. Attenuation of Ca(2+)-activated ATPase and shortening velocity in hypertrophied fast twitch skeletal muscle from aged Japanese quail. Exp.Gerontol. 2002;37:665–678. - PubMed
    1. Alway SE, Lowe DA, Chen KD. The effects of age and hindlimb supension on the levels of expression of the myogenic regulatory factors MyoD and myogenin in rat fast and slow skeletal muscles. Exp.Physiol. 2001;86:509–517. - PubMed
    1. Alway SE, Martyn JK, Ouyang J, Chaudhrai A, Murlasits ZS. Id2 expression during apoptosis and satellite cell activation in unloaded and loaded quail skeletal muscles. Am.J.Physiol Regul.Integr.Comp Physiol. 2003;284:R540–R549. - PubMed

Publication types

MeSH terms