

Structure and self-assembly of the calcium binding matrix protein of human metapneumovirus
- PMID: 24316400
- PMCID: PMC3887258
- DOI: 10.1016/j.str.2013.10.013
Structure and self-assembly of the calcium binding matrix protein of human metapneumovirus
Abstract
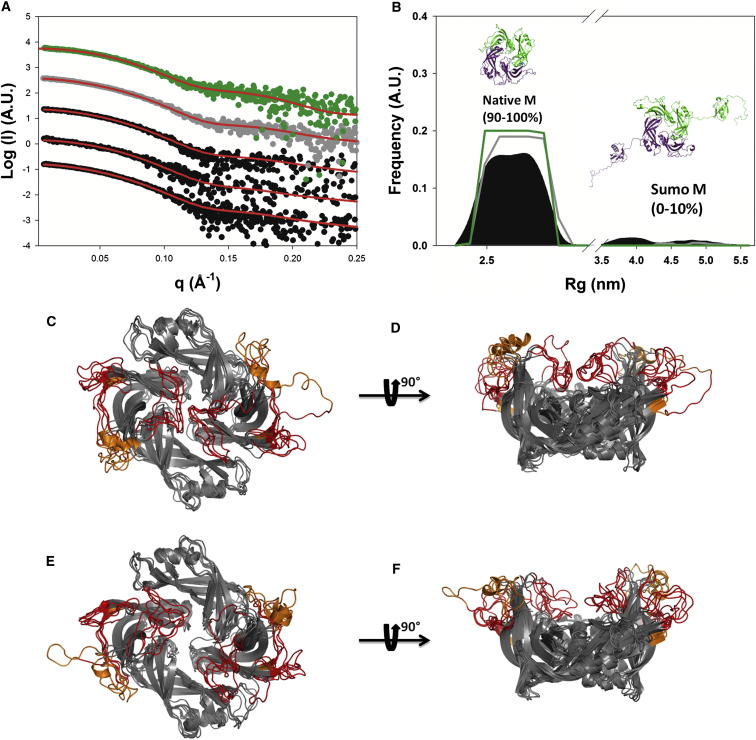
The matrix protein (M) of paramyxoviruses plays a key role in determining virion morphology by directing viral assembly and budding. Here, we report the crystal structure of the human metapneumovirus M at 2.8 Å resolution in its native dimeric state. The structure reveals the presence of a high-affinity Ca²⁺ binding site. Molecular dynamics simulations (MDS) predict a secondary lower-affinity site that correlates well with data from fluorescence-based thermal shift assays. By combining small-angle X-ray scattering with MDS and ensemble analysis, we captured the structure and dynamics of M in solution. Our analysis reveals a large positively charged patch on the protein surface that is involved in membrane interaction. Structural analysis of DOPC-induced polymerization of M into helical filaments using electron microscopy leads to a model of M self-assembly. The conservation of the Ca²⁺ binding sites suggests a role for calcium in the replication and morphogenesis of pneumoviruses.
Copyright © 2014 The Authors. Published by Elsevier Inc. All rights reserved.
Figures


Comment in
-
A calcium-fortified viral matrix protein.Structure. 2014 Jan 7;22(1):5-7. doi: 10.1016/j.str.2013.12.008. Structure. 2014. PMID: 24411575 Free PMC article.
Similar articles
-
A calcium-fortified viral matrix protein.Structure. 2014 Jan 7;22(1):5-7. doi: 10.1016/j.str.2013.12.008. Structure. 2014. PMID: 24411575 Free PMC article.
-
Strontium Binding to α-Parvalbumin, a Canonical Calcium-Binding Protein of the "EF-Hand" Family.Biomolecules. 2021 Aug 5;11(8):1158. doi: 10.3390/biom11081158. Biomolecules. 2021. PMID: 34439824 Free PMC article.
-
Electrostatic Interactions between Hendra Virus Matrix Proteins Are Required for Efficient Virus-Like-Particle Assembly.J Virol. 2018 Jun 13;92(13):e00143-18. doi: 10.1128/JVI.00143-18. Print 2018 Jul 1. J Virol. 2018. PMID: 29695428 Free PMC article.
-
Phosphorylation of Human Metapneumovirus M2-1 Protein Upregulates Viral Replication and Pathogenesis.J Virol. 2016 Jul 27;90(16):7323-7338. doi: 10.1128/JVI.00755-16. Print 2016 Aug 15. J Virol. 2016. PMID: 27252537 Free PMC article.
-
Parainfluenza virus 5 m protein interaction with host protein 14-3-3 negatively affects virus particle formation.J Virol. 2011 Mar;85(5):2050-9. doi: 10.1128/JVI.02111-10. Epub 2010 Dec 8. J Virol. 2011. PMID: 21147917 Free PMC article.
Cited by
-
A stochastic assembly model for Nipah virus revealed by super-resolution microscopy.Nat Commun. 2018 Aug 3;9(1):3050. doi: 10.1038/s41467-018-05480-2. Nat Commun. 2018. PMID: 30076303 Free PMC article.
-
Clustered Lysine Residues of the Canine Distemper Virus Matrix Protein Regulate Membrane Association and Budding Activity.J Virol. 2020 Dec 9;95(1):e01269-20. doi: 10.1128/JVI.01269-20. Print 2020 Dec 9. J Virol. 2020. PMID: 33028721 Free PMC article.
-
Negative-sense RNA viruses: An underexplored platform for examining virus-host lipid interactions.Mol Biol Cell. 2021 Oct 1;32(20):pe1. doi: 10.1091/mbc.E19-09-0490. Mol Biol Cell. 2021. PMID: 34570653 Free PMC article. Review.
-
Paramyxovirus glycoprotein incorporation, assembly and budding: a three way dance for infectious particle production.Viruses. 2014 Aug 7;6(8):3019-54. doi: 10.3390/v6083019. Viruses. 2014. PMID: 25105277 Free PMC article. Review.
-
Induction of Protective Immunity by a Single Low Dose of a Master Cell Bank cGMP-rBCG-P Vaccine Against the Human Metapneumovirus in Mice.Front Cell Infect Microbiol. 2021 Jun 29;11:662714. doi: 10.3389/fcimb.2021.662714. eCollection 2021. Front Cell Infect Microbiol. 2021. PMID: 34268134 Free PMC article.
References
-
- Abrescia N.G., Bamford D.H., Grimes J.M., Stuart D.I. Structure unifies the viral universe. Annu. Rev. Biochem. 2012;81:795–822. - PubMed
-
- Bernadó P., Mylonas E., Petoukhov M.V., Blackledge M., Svergun D.I. Structural characterization of flexible proteins using small-angle X-ray scattering. J. Am. Chem. Soc. 2007;129:5656–5664. - PubMed
Publication types
MeSH terms
Substances
Grants and funding
LinkOut - more resources
Full Text Sources
Other Literature Sources
Molecular Biology Databases
Research Materials
Miscellaneous
