. 2014 Jan;16(1):55-65.
doi: 10.1038/ncb2883. Epub 2013 Dec 8.

Plasma membrane translocation of trimerized MLKL protein is required for TNF-induced necroptosis

Affiliations

Plasma membrane translocation of trimerized MLKL protein is required for TNF-induced necroptosis

Zhenyu Cai et al. Nat Cell Biol. 2014 Jan.

Erratum in

  • Nat Cell Biol. 2014 Feb;16(2):200

Abstract

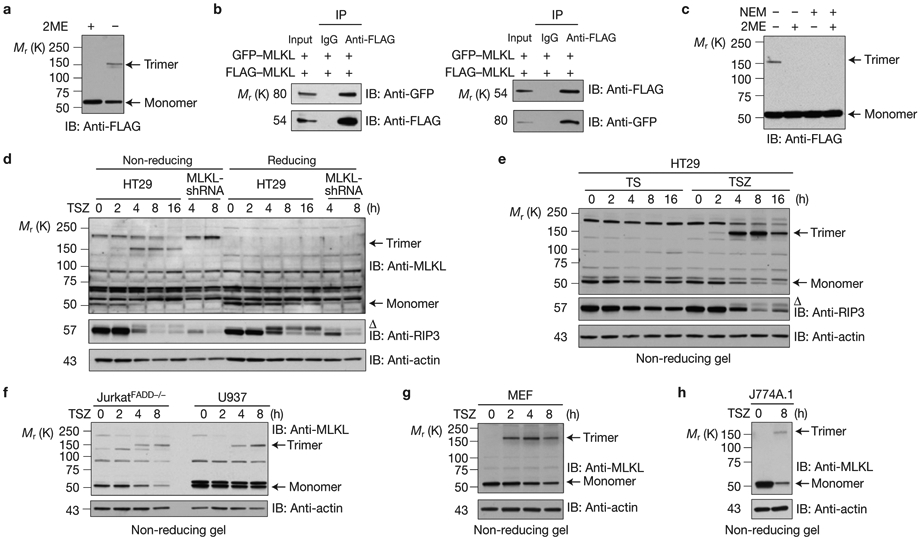
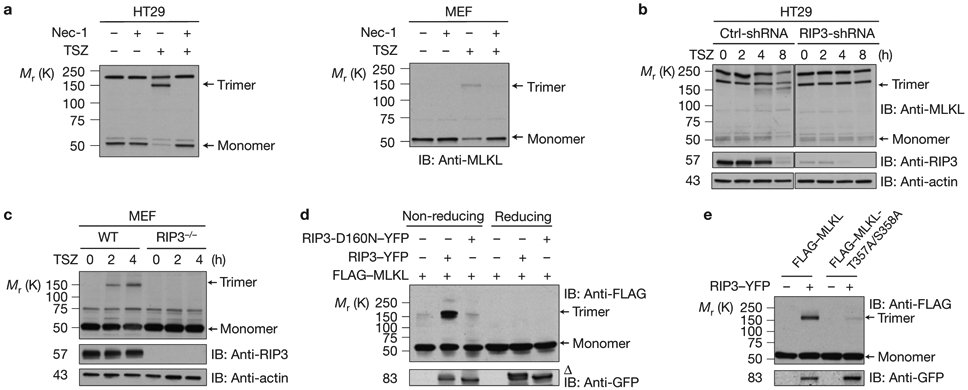
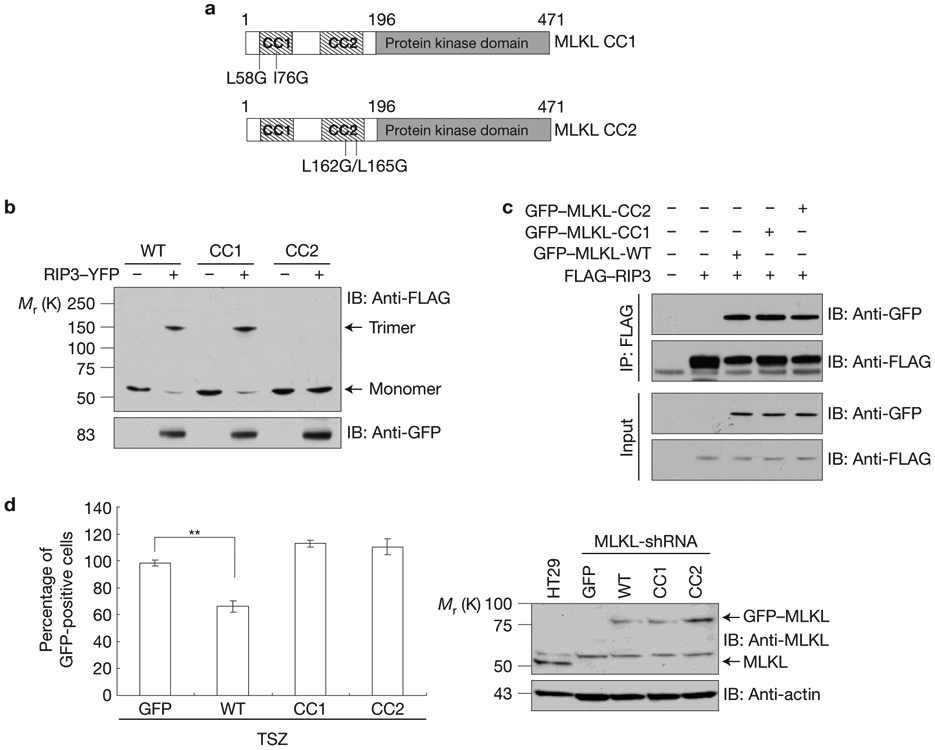
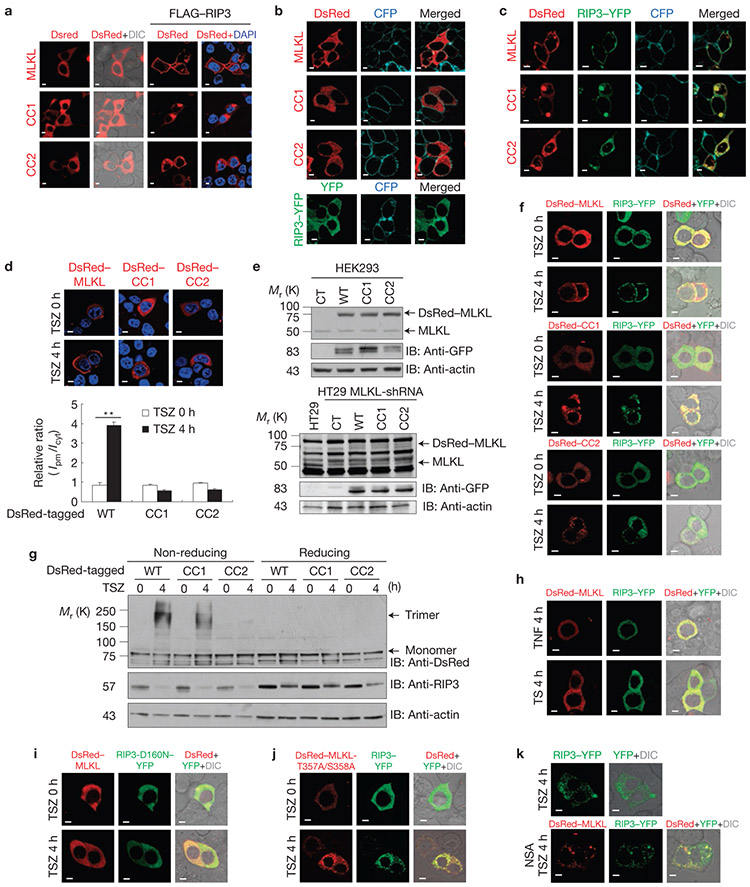
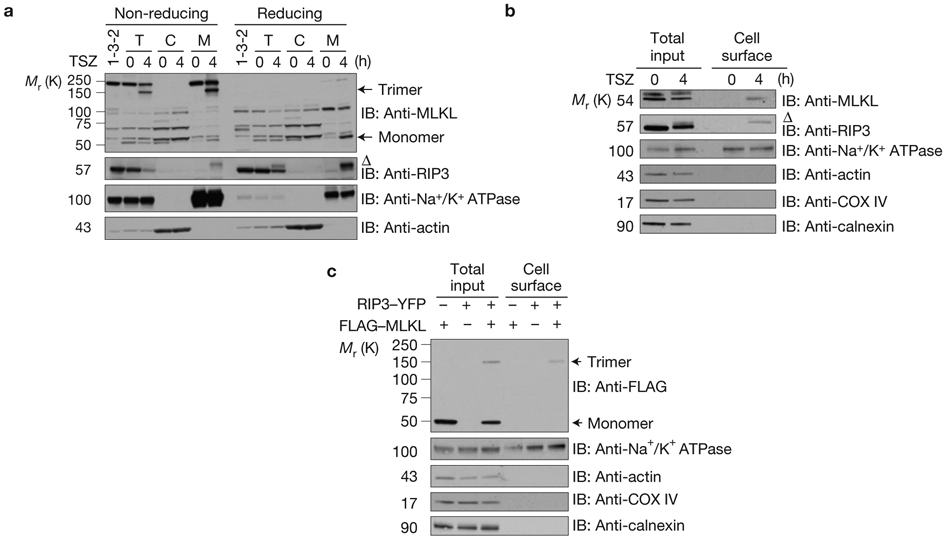
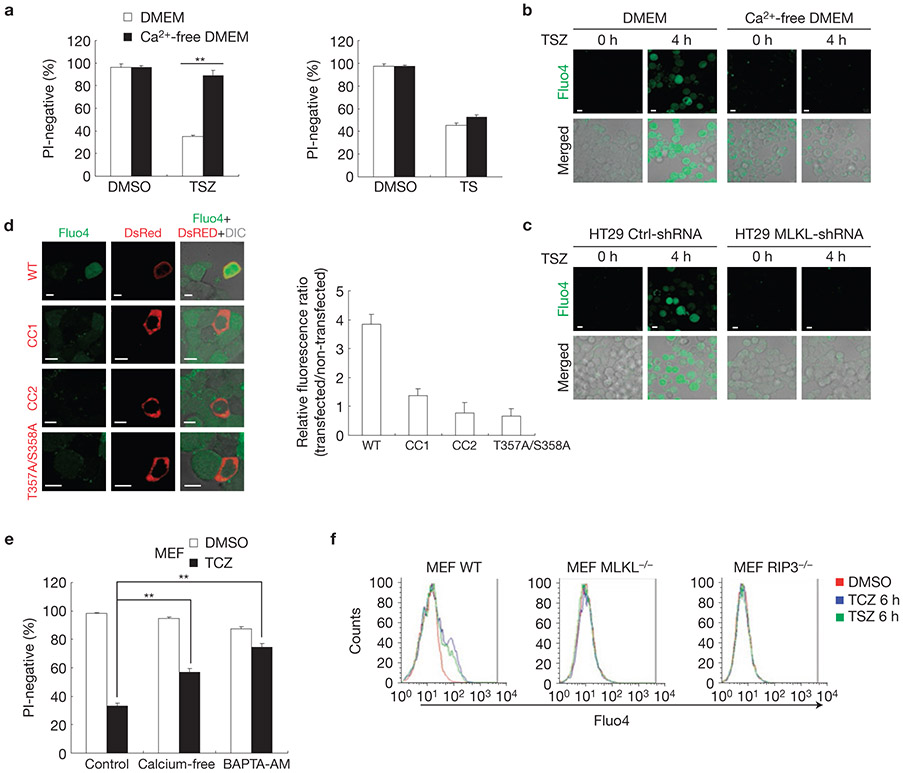
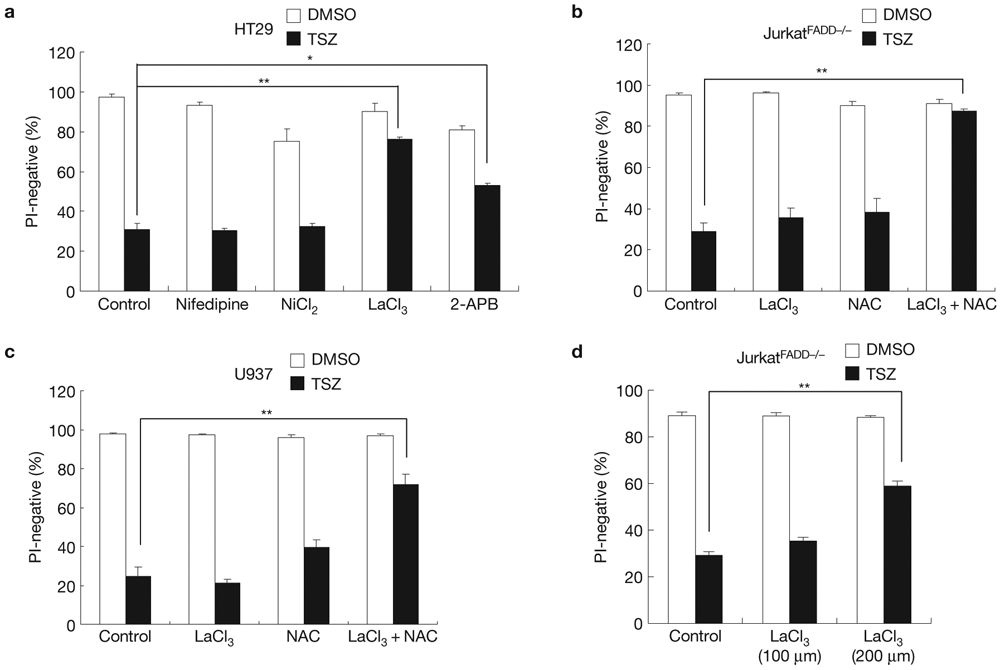
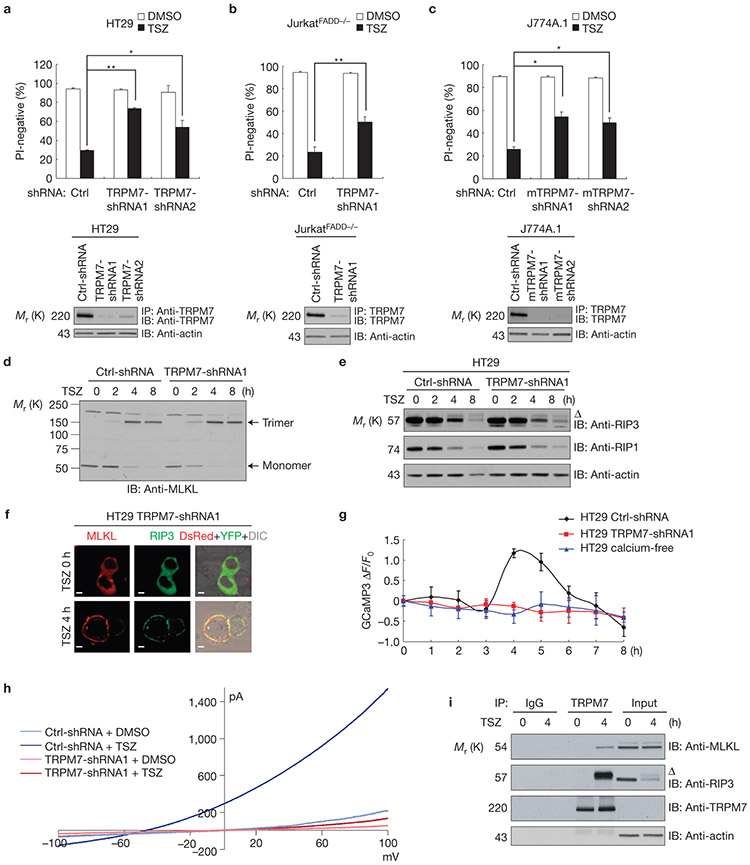
The mixed lineage kinase domain-like protein (MLKL) has recently been identified as a key RIP3 (receptor interacting protein 3) downstream component of tumour necrosis factor (TNF)-induced necroptosis. MLKL is phosphorylated by RIP3 and is recruited to the necrosome through its interaction with RIP3. However, it is still unknown how MLKL mediates TNF-induced necroptosis. Here, we report that MLKL forms a homotrimer through its amino-terminal coiled-coil domain and locates to the cell plasma membrane during TNF-induced necroptosis. By generating different MLKL mutants, we demonstrated that the plasma membrane localization of trimerized MLKL is critical for mediating necroptosis. Importantly, we found that the membrane localization of MLKL is essential for Ca(2+) influx, which is an early event of TNF-induced necroptosis. Furthermore, we identified that TRPM7 (transient receptor potential melastatin related 7) is a MLKL downstream target for the mediation of Ca(2+) influx and TNF-induced necroptosis. Hence, our study reveals a crucial mechanism of MLKL-mediated TNF-induced necroptosis.


Figures

Figure 1
Figure 1
MLKL forms homotrimeric protein on necrosis induction. (a) HEK293 cells were transfected with FLAG–MLKL. The cell lysates were resolved on an SDS–PAGE gel with or without β-mercaptoethanol (2ME) and analysed by immunoblotting with anti-FLAG antibody. (b) HEK293 cells were transfected with GFP–MLKL and FLAG–MLKL as indicated. Cell lysates were immunoprecipitated either with anti-FLAG antibody (left panel) or anti-GFP antibody (right panel) and analysed by immunoblotting with the indicated antibodies. (c) HEK293 cells were transfected with FLAG–MLKL, then lysed with or without 30 mM N-ethylmaleimide (NEM) to block all reactive sulphydryl groups. The cell lysates were resolved with or without 2ME and analysed by immunoblotting with anti-FLAG antibody. (d,e) Control-shRNA or MLKL-shRNA HT29 cells were treated with TSZ (TNF, Smac mimetic and the caspase inhibitor z-VAD-FMK) or TS (TNF and Smac mimetic) as indicated. The cell lysates were resolved either on reducing or non-reducing gel and analysed by immunoblotting with the indicated antibodies. (fh) JurkatFADD−/−, U937 (f), MEF (g) and J774A.1 (h) cells were treated with TSZ at different time points as indicated. The cell lysates were resolved on non-reducing gel and analysed by immunoblotting with the indicated antibodies. Δ indicates phosphorylated RIP3. All western data are representative of two or three independent experiments. Uncropped images of western blots are shown in Supplementary Fig. 8.
Figure 2
Figure 2
RIP3 kinase activity is critical for MLKL trimerization (a) HT29 cells (left) or MEF cells (right) were pre-treated with or without necrostatin-1 (Nec-1) and then treated with TSZ for 4 h. The cell lysates were resolved on non-reducing gel and analysed by immunoblotting with anti-MLKL antibody. (b) Control-shRNA or RIP3-shRNA HT29 cells were treated with TSZ as indicated. The cell lysates were resolved on non-reducing gel and analysed by immunoblotting with anti-MLKL antibody. (c) WT or RIP3-deficient MEF cells were treated with TSZ and cell lysates were resolved on non-reducing gel and analysed by immunoblotting with the indicated antibodies. (d) HEK293 cells were transfected with FLAG–MLKL, RIP3–YFP or RIP3-D160N–YFP as indicated. The cell lysates were resolved either on reducing or non-reducing gel and analysed by immunoblotting with the indicated antibodies. (e) HEK293 cells were transfected with FLAG–MLKL or FLAG–MLKL-T357A/S358A with or without RIP3–YFP as indicated. The cell lysates were resolved on non-reducing gel and analysed by immunoblotting with the indicated antibodies. Δ indicates phosphorylated RIP3. All western data are representative of two or three independent experiments. Uncropped images of western blots are shown in Supplementary Fig. 8.
Figure 3
Figure 3
The coiled-coil domain 2 of MLKL is responsible for its trimerization (a) Schematic of coiled-coil-defective mutant proteins of MLKL. The hatched rectangles represent the predicted regions of the coiled-coil domains, named CC1 and CC2. (b) HEK293 cells were transfected with FLAG–MLKL, FLAG–MLKL-CC1 mutant or FLAG–MLKL-CC2 mutant with or without RIP3–YFP as indicated. The cell lysates were resolved on non-reducing gel and analysed by immunoblotting as indicated. (c) HEK293 cells were transfected with GFP–MLKL, GFP–MLKL-CC1 or GFP–MLKL-CC2 with FLAG–RIP3 as indicated. After 24 h, cell lysates were immunoprecipitated with anti-FLAG antibody (IP: FLAG) and analysed by immunoblotting with anti-FLAG and anti-GFP antibodies. (d) Left, HT29 MLKL-shRNA cells were transfected with GFP, GFP–MLKL, GFP–MLKL-CC1 or GFP–MLKL-CC2 plasmids as indicated for 24 h, followed by treatment with TSZ for 24 h. Survival was determined by counting GFP+ cells and normalized to untreated cells. Results shown are averages ± s.d. from three independent experiments. Right, immunoblot analysis of MLKL and its mutants’ levels in HT29 cells or rescue MLKL-shRNA HT29 cells. All western data are representative of two or three independent experiments. **P < 0.01. Statistics source data for d can be found in Supplementary Table 1. Uncropped images of western blots are shown in Supplementary Fig. 8.
Figure 4
Figure 4
MLKL locates to plasma membrane following necroptosis induction. (a) HEK293 cells expressing DsRed–MLKL, DsRed–MLKL-CC1 or DsRed–MLKL-CC2 with or without FLAG–RIP3 were analysed for subcellular localization by confocal imaging. (b,c) HEK293 cells expressing DsRed–MLKL, DsRed–MLKL-CC1 or DsRed–MLKL-CC2 with (c) or without (b) RIP3–YFP were analysed for co-localization with plasma marker (CellLight Plasma Membrane–CFP). (d) MLKL-shRNA HT29 cells were transfected with DsRed–MLKL, DsRed–MLKL-CC1 or DsRed–MLKL-CC2 and treated with or without TSZ as indicated. Upper panel, subcellular localization of MLKL and its mutants was imaged by confocal microscopy. Lower panel, relative fluorescence intensity ratio of plasma-membrane-adjacent area (Ipm) versus average cytosolic area (Icyt). Thirty transfected cells were analysed from each sample. Results shown are averages ±s.e.m. from three independent experiments. (e) Western blotting analysis of expression levels of DsRed–MLKL and RIP3–YFP in HT29 and HEK293 cells. (f) Representative images of MLKL-shRNA HT29 cells co-expressing DsRed–MLKL (upper panel), DsRed–MLKL-CC1 (middle panel) and DsRed–MLKL-CC2 (lower panel) with RIP3–YFP treated with TSZ. (g) Analysis of trimerization of DsRed–MLKL and DsRed-CC1 in cells from d. The cell lysates were resolved either on reducing or non-reducing gel and analysed by immunoblotting with the indicated antibodies. (hj) Confocal imaging of the subcellular localization of MLKL and RIP3 in MLKL-shRNA HT29 cells co-expressing RIP3–YFP and DsRed–MLKL treated with TNF (h, upper panel) or TS (h, lower panel) or RIP3-D160N–YFP (i), or DsRed–MLKL-T357A/S358A (j). (k) Confocal imaging of the subcellular localization of MLKL and RIP3 in MLKL-shRNA HT29 cells transfected with RIP3–YFP and treated with TSZ (upper panel) or DsRed–MLKL plus RIP3–YFP and treated with TSZ plus NSA (lower panel) as indicated. Scale bar, 5 μm; DIC, differential interference contrast; DAPI was used as a nuclear staining marker; **P < 0.01. Statistics source data for d can be found in Supplementary Table 1. Scale bar, 10 μm. Uncropped images of western blots are shown in Supplementary Fig. 8.
Figure 5
Figure 5
Plasma membrane translocation of trimerized MLKL in response to necroptosis induction. (a) Control shRNA or MLKL shRNA HT29 cells (clone 1-3-2) were treated with TSZ. The total, cytosolic and crude membrane fractions were resolved either on reducing or non-reducing gel and analysed by immunoblotting as indicated. T, total cell lysate. C, cytosolic fraction. M, membrane fraction. (b) HT29 cells were treated with TSZ as indicated. Total cellular lysate and the biotinylated, cell surface fraction were resolved on reducing gel and analysed by immunoblotting as indicated. (c) HEK293 cells were transfected as indicated. Total cellular lysate and the biotinylated, cell surface fraction were resolved on non-reducing gel and analysed by immunoblot as indicated. Δ indicates phosphorylated RIP3. Data shown are representative of two independent experiments. Uncropped images of western blots are shown in Supplementary Fig. 8.
Figure 6
Figure 6
MLKL-mediated calcium influx is involved in plasma membrane rupture during necroptosis. (a) HT29 cells were cultured in DMEM with or without calcium and treated with dimethylsulphoxide (DMSO) control, TSZ for 24 h or TS for 48 h. Cell survival was determined by PI staining. Results shown are averages ± s.e.m. from three independent experiments. (b) HT29 cells were loaded with Fluo4 AM and then treated with TSZ in the presence of normal medium or calcium-free medium for 4 h. Representative confocal images of live HT29 cells are shown. (c) HT29 shRNA control cells or MLKL shRNA cells were loaded with Fluo4 AM and then treated with TSZ for 4 h. Representative confocal images of live HT29 cells are shown. (d) Left, HT29 MLKL-shRNA cells were transfected with DsRed–MLKL-WT, DsRed–MLKL-CC1, DsRed–MLKL-CC2 or DsRed–MLKL-T357A/S358A as indicated. After 24 h transfection, cells were loaded with Fluo4 and then treated with TSZ for 4 h. The representative confocal images are shown. Right, ratiometric measurement of Fluo4 mean fluorescence intensity between transfected and non-transfected cells (20 cells from each part). Results shown are averages ± s.e.m. from three independent experiments. (e) MEF cells were cultured with or without calcium or pre-treated with BAPTA-AM (10 μm) for 30 min and then treated with TCZ for 13 h. Cell survival was determined by PI staining. Results shown are averages ± s.e.m. from three independent experiments. (f) WT, MLKL-deficient or RIP3-deficient MEF cells were treated with TSZ or TCZ for 6 h. Cells were collected and loaded with Fluo4. Fluo4 fluorescent cells were determined by FACS analysis. **P < 0.01. Scale bar, 10 μm. Statistics source data for this figure can be found in Supplementary Table 1.
Figure 7
Figure 7
Calcium channels are involved in necroptosis. (a) HT29 cells were treated with nifedipine (100 μm), NiCl2 (1 mM), LaCl3 (100 μm) or 2-APB (50 μm) and TSZ for 24 h. Cell survival was determined by flow cytometry of PI staining. (b,c) JurkatFADD−/− cells (b) or U937 cells (c) were pre-treated with LaCl3(100 μM), NAC (5 mM) or LaCl3 plus NAC. Then, the cells were treated with TSZ as indicated. After 10 h, cell survival was determined by PI staining. (d) JurkatFADD−/− cells were pre-treated with the increased concentration of LaCl3 (200 μM) and then treated with TSZ as indicated. After 10 h, cell survival was determined by PI staining. Results shown are averages ± s.e.m. from three independent experiments. *P < 0.05, **P < 0.01. Statistics source data for this figure can be found in Supplementary Table 1.
Figure 8
Figure 8
TRPM7 is involved in MLKL-mediated necroptosis. (ac) HT29 (a), JurkatFADD−/− (b) or J774A.1 (c) cells expressing control-shRNA or TRPM7-shRNAs were treated with or without TSZ for 24 h. Cell survival was determined by PI staining. Upper panel, results shown are averages ± s.e.m. from three independent experiments. Lower panel, TRPM7 protein levels were determined by immunoprecipitation and immunoblotting with anti-TRPM7 antibody. (d,e) Control-shRNA or TRPM7-shRNA HT29 cells were treated with TSZ as indicated. The cell lysates were resolved either on non-reducing (d) or reducing gel (e) and analysed by immunoblotting as indicated. (f) Representative confocal images of live TRPM7-shRNA HT29 cells co-expressing DsRed–MLKL and RIP3–YFP treated with TSZ at time 0 and 4 h. Scale bar, 5 μm. (g) The changes of GCaMP3 fluorescence in control-shRNA, MLKL-shRNA HT29 cells or HT29 cells cultured in calcium-free medium during TSZ treatment. Data are expressed as change of GCaMP3 fluorescence ΔF over basal fluorescence F0 at any given time. Results shown are averages ± s.e.m. in 10 cells. (h) Recording TSZ-induced current in control-shRNA or TRPM7-shRNA HT29 cells. I–V curve measurements were obtained after a 4 h TSZ treatment and averaged from the 10 cells in each experiment. (i) HT29 cells were treated with TSZ for 4 h. Cell lysates were immunoprecipitated with anti-TRPM7 antibody. The immunoprecipitated complexes were analysed by immunoblotting as indicated. Δ indicates phosphorylated RIP3. Data shown are representative of three independent experiments. *P < 0.05, **P < 0.01. Scale bar, 10 μm. Statistics source data for this figure can be found in Supplementary Table 1. Uncropped images of western blots are shown in Supplementary Fig. 8.

References

    1. Chen G & Goeddel DV TNF-R1 signaling: a beautiful pathway. Science 296, 1634–1635 (2002). - PubMed
    1. Ashkenazi A & Dixit VM Apoptosis control by death and decoy receptors. Curr. Opin. Cell Biol 11, 255–260 (1999). - PubMed
    1. Grivennikov SI, Greten FR & Karin M Immunity, inflammation, and cancer. Cell 140, 883–899 (2010). - PMC - PubMed
    1. Vandenabeele P, Galluzzi L, Vanden Berghe T & Kroemer G Molecular mechanisms of necroptosis: an ordered cellular explosion. Nat. Rev. Mol. Cell Biol 11, 700–714 (2010). - PubMed
    1. Christofferson DE & Yuan J Necroptosis as an alternative form of programmed cell death. Curr. Opin. Cell Biol 22, 263–268 (2010). - PMC - PubMed

Publication types

MeSH terms