. 2014 Jan;16(1):47-54.
doi: 10.1038/ncb2886. Epub 2013 Dec 8.

Autophagy variation within a cell population determines cell fate through selective degradation of Fap-1

Affiliations

Autophagy variation within a cell population determines cell fate through selective degradation of Fap-1

Jacob M Gump et al. Nat Cell Biol. 2014 Jan.

Abstract

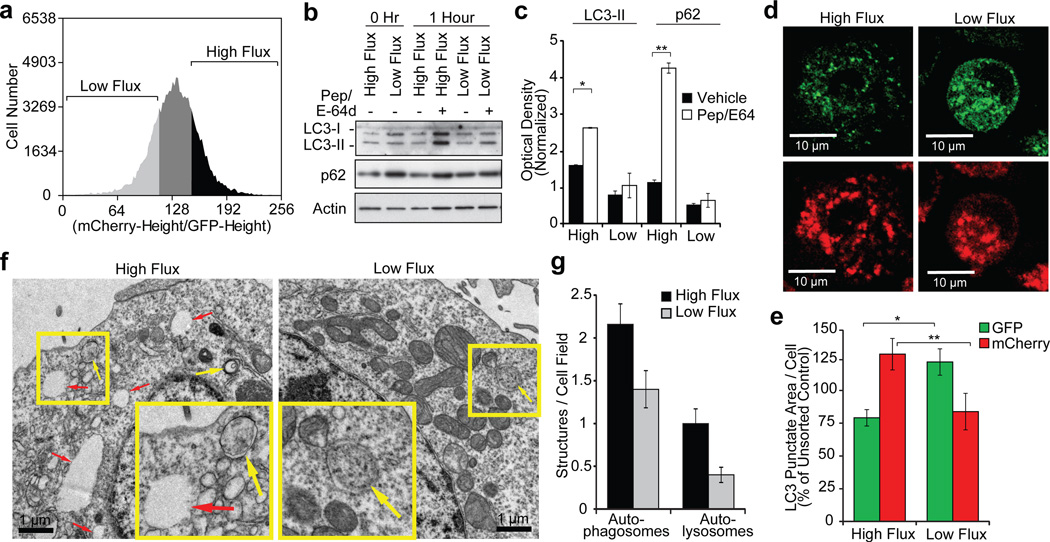
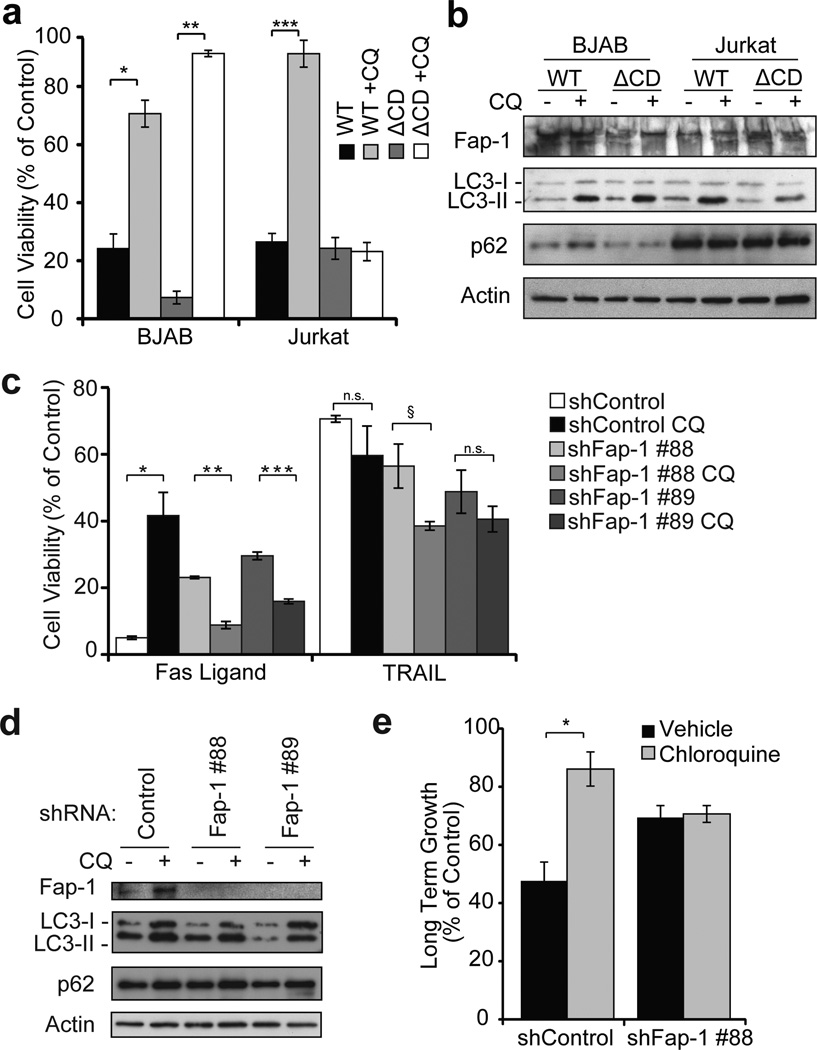
Autophagy regulates cell death both positively and negatively, but the molecular basis for this paradox remains inadequately characterized. We demonstrate here that transient cell-to-cell variations in autophagy can promote either cell death or survival depending on the stimulus and cell type. By separating cells with high and low basal autophagy using flow cytometry, we demonstrate that autophagy determines which cells live or die in response to death receptor activation. We have determined that selective autophagic degradation of the phosphatase Fap-1 promotes Fas apoptosis in Type I cells, which do not require mitochondrial permeabilization for efficient apoptosis. Conversely, autophagy inhibits apoptosis in Type II cells (which require mitochondrial involvement) or on treatment with TRAIL in either Type I or II cells. These data illustrate that differences in autophagy in a cell population determine cell fate in a stimulus- and cell-type-specific manner. This example of selective autophagy of an apoptosis regulator may represent a general mechanism for context-specific regulation of cell fate by autophagy.


Figures

Figure 1
Figure 1. Log-phase proliferating cells in optimal growth media exhibit significant steady-state differences in autophagic flux
a, b, BJAB lymphoma cells stably expressing mCherry-GFP-LC3 were serially cultured at log phase followed by FACS sorting for cells with high and low autophagic flux using the ratio of mCherry/GFP (a). The high and low 20% were sorted (a), replated and treated with lysosomal protease inhibitors pepstatin and E-64d for 1 hour; lysates were then immunoblotted for the indicated proteins (b). c, Densitometry of LC3-II and p62 westerns (normalized to actin and hour 0, mean ± s.e.m., n=3 blots from 2 independent experiments, *p=0.051, **p=0.0091). d, e, HeLa Cherry-GFP-LC3 cells were sorted as in (a), cytospun onto slides, fixed and visualized by confocal microscopy (d); autophagic LC3 puncta were assessed by quantitative microscopy (e) (punctate area per cell, mean±s.e.m., n=50 fields, *p=0.010, **p=0.053). f, Electron micrographs of HeLa mCherry-GFP-LC3 cells sorted for autophagic flux as in (a). Yellow arrows denote autophagosomes; red arrows indicate autolysosomes. g, Quantitation of autophagosomes and autolysomes from electron micrographs (mean ± s.e.m., n=50 fields).
Figure 2
Figure 2. Differences in basal autophagic flux are transient but determine apoptotic response in a stimulus-specific manner
a–c, BJAB lymphoma cells stably expressing mCherry-GFP-LC3 were serially cultured at log phase followed by FACS sorting for cells with high and low autophagic flux using the ratio of mCherry/GFP. Cells were then re-plated in growth medium and autophagic flux was again measured by flow cytometry at the indicated timepoints (median ratio of mCherry/GFP fluorescence ± s.e.m., n=3 wells). Lysates from cells harvested at the indicated timepoints were immunoblotted with the indicated antibodies (b). Representative flow cytometry histograms for cells at 0 hours and 24 hours after sorting (c). d, BJAB mCherry-GFP-LC3 cells were sorted for autophagic flux as in (a) (top and bottom 20%). Following treatment with Fas ligand (1.5 ng/mL) or TRAIL (4 ng/mL), cell viability was determined by MTS assay at 24 hours (% of untreated control, mean ± s.e.m., n=3 wells, *p=2.3×10⁻⁴, **p=0.0036). e, Long term growth of BJAB mCherry-GFP-LC3 cells sorted for autophagic flux followed by treatment with Fas ligand (4 ng/mL) or TRAIL (15 ng/mL) for 24 hours. Cells were then re-plated and allowed to recover for 5 (Fas Ligand) or 6 (TRAIL) days then assayed for viability (% of no ligand control, mean ± s.e.m., n=3 wells, *p=0.012). f, BJAB mCherry-GFP-LC3 cells were sorted for autophagic flux as above and apoptosis was measured at 1 hour by flow cytometry using AnnexinV and DAPI (mean ± s.e.m., n=3 wells, *p=0.0046). g, cells sorted as in (a), were re-plated and, starting at the indicated times following sorting, treated with Fas ligand (4 ng/mL) for 24 hours; cell viability was then determined by MTS (% of untreated control, mean ± s.e.m., n=3 wells).
Figure 3
Figure 3. Autophagy inhibition suppresses Fas ligand induced cell killing in a cell type-specific manner
a, BJAB and Jurkat cells were treated with vehicle or chloroquine (BJAB 20 μM, Jurkat 10 μM) for 16 hours followed by Fas ligand (1.5 ng/mL). Cell viability was determined by MTS 24 hours later (% of control (no ligand), mean ± s.e.m., n=3 wells, *p=0.0058). b, Immunoblots of cells in (a, c) probed for the indicated antibodies. c, BJAB and Jurkat cells were treated with chloroquine (BJAB 20 μM, Jurkat 10 μM) for 16 hours followed by treatment with Fas ligand (4 ng/mL) for 24 hours (same technical replicate as (a)). Cells were then re-plated at low density in growth media and allowed to recover for 5 days, then assayed for viability (% of no ligand control, mean ± s.e.m., n=3 wells, *p=0.0024). d, BJAB and Jurkat cells were transduced with the indicated lentiviral shRNA constructs, followed by 3 days of puromycin selection. Selected cells were plated and treated with Fas ligand (1.5 ng/mL) or TRAIL (4 ng/mL) for 24 hours and viability was assessed by MTS (% of control (no ligand), mean ± s.e.m., n=3, *p=1.7×10⁻⁴, **p=0.024). e, Immunoblots for Atg5, Atg7 and p62 confirm protein depletion and autophagy inhibition in (d, f). f, BJAB and Jurkat cells expressing control or Atg5 shRNA were treated with Fas ligand (15 ng/mL) or TRAIL (12.5 ng/mL) for 24 hours (same technical replicate as (d)). Cells were then re-plated at low density and allowed to recover for 5–6 days then assayed for viability (% of no ligand control, mean ± s.e.m., n=3 wells, *p=0.0089). Atg7 knockdown data were not included for long term viability due to growth suppressive effect of Atg7 knockdown in the absence of drug treatment.
Figure 4
Figure 4. Autophagy facilitates Fas apoptosis in Type I cells and correlates with Fap-1 expression
a–b, BJAB and Jurkat cells stably expressing mCherry-GFP-LC3 were flow sorted for high and low autophagic flux, treated with Fas ligand (1.5 ng/mL) for 24 hours and viability was assessed by MTS (a) (% of no ligand control, mean ± s.e.m., n=3 wells, *p=0.0046). b, Immunoblots following sorting of the samples in (a). c–d, The indicated cell lines were treated with chloroquine (BJAB, CEM 20 μM; SKW6.4, 25 μM; Jurkat, 10 μM) for 16 hours, followed by Fas ligand (BJAB, 12.5 ng/mL; SKW6.4, 50 ng/mL; Jurkat, 0.4 ng/mL; CEM, 40 ng/mL). Lysates from cells harvested after chloroquine treatment were immunoblotted with the indicated antibodies (c). Cell viability was assessed by MTS 24 hours following Fas ligand treatment (d) (% of control (no ligand), mean ± s.e.m., n=3 wells, *p=2.7×10⁻⁴, **p=1.6×10⁻⁴). e–f, BJAB and Jurkat cells were transduced with control, Atg5, Atg7 or Vps34 shRNA lentiviruses, followed by 3 days of puromycin selection. Cells were then treated with Fas ligand (1.25 ng/mL) or TRAIL (1.25 ng/mL) for 24 hours and viability was assessed by MTS (e) (% of control (no ligand), mean ± s.e.m., n=3 wells, *p=1.4×10⁻⁶, **p=2.3×10⁻⁵, ***p=3.9×10⁻⁵, §p=9.2×10⁻⁶, §§p=3.4×10⁻⁶, §§§p=1.7×10⁻⁵). Immunoblots demonstrate Atg5, Atg7 and Vps34 knockdown, autophagy inhibition and altered Fap-1 levels (f).
Figure 5
Figure 5. Autophagy facilitates apoptosis via selective degradation of Fap-1
a–b, BJAB and Jurkat cells expressing the indicated Fap-1 wild-type (WT) and catalytically-inactive (ΔCD) constructs were treated with chloroquine (BJAB, 20 μM; Jurkat, 10 μM) for 16 hours followed by Fas ligand (BJAB, 1.5 ng/mL; Jurkat 15 ng/mL) for 24 hours. Cell viability was determined by MTS (a) (% of control (no ligand), mean ± s.e.m., n=3 wells, *p=2.7×10⁻⁴, **p=2.4×10⁻⁵, ***p=0.0024). Cell lysates were blotted and probed with the indicated antibodies (b). c–e, BJAB cells expressing control or Fap-1 shRNAs were treated with 20 µM chloroquine for 16 hours followed by Fas ligand (12.5 ng/mL) or TRAIL (25 ng/mL) for 24 hours; cell viability was then determined by MTS (c) (% of control (no ligand), mean ± s.e.m., n=3 wells, *p=4.8×10⁻⁶, **p=8.1×10⁻⁵, ***p=8.0×10⁻⁴, §p=0.013, n.s. p>0.05). Immunoblots of lysates harvested following chloroquine treatment (d). Long term growth was assessed in cells from (c) by re-plating at low density and allowing to recover for 5 days, followed by viability assay (% of untreated control, mean ± s.e.m., n=3 wells, *p=0.043) (e).
Figure 6
Figure 6. p62 is required for Fap-1 degradation by autophagy and p62 and Fap-1 interact directly
a–b, Cell viability was determined by MTS assay following Fas ligand (4 ng/mL) treatment in BJAB cells expressing control or p62 lentiviral shRNAs (a) (% of control (no ligand), mean ± s.e.m., n=3 wells, *p=3.2×10⁻⁵, **p=1.8×10⁻⁶). Immunoblots confirm p62 depletion and Fap-1 levels (b). c, Co-immunoprecipitation of endogenous p62 and Fap-1 in BJAB cells treated with 20 µM chloroquine for 16 hours, followed by treatment with Fas ligand (50 ng/mL) for 2 hours at 4 °C. d, Model of the mechanism for autophagy promotion of Fas apoptosis in Type I cells.

Comment in

References

    1. Mizushima N, Levine B, Cuervo AM, Klionsky DJ. Autophagy fights disease through cellular self-digestion. Nature. 2008;451:1069–1075. - PMC - PubMed
    1. Kroemer G, Marino G, Levine B. Autophagy and the integrated stress response. Mol Cell. 2010;40:280–293. - PMC - PubMed
    1. Maycotte P, Thorburn A. Autophagy and cancer therapy. Cancer Biol Ther. 2011;11:127–137. - PMC - PubMed
    1. White EJ, et al. Autophagy regulation in cancer development and therapy. Am J Cancer Res. 2011;1:362–372. - PMC - PubMed
    1. Dikic I, Johansen T, Kirkin V. Selective autophagy in cancer development and therapy. Cancer Res. 2010;70:3431–3434. - PubMed

Publication types

MeSH terms

LinkOut - more resources