. 2014 Feb;10(2):99-105.
doi: 10.1038/nchembio.1411. Epub 2013 Dec 8.

Genomic mining of prokaryotic repressors for orthogonal logic gates

Affiliations

Genomic mining of prokaryotic repressors for orthogonal logic gates

Brynne C Stanton et al. Nat Chem Biol. 2014 Feb.

Abstract

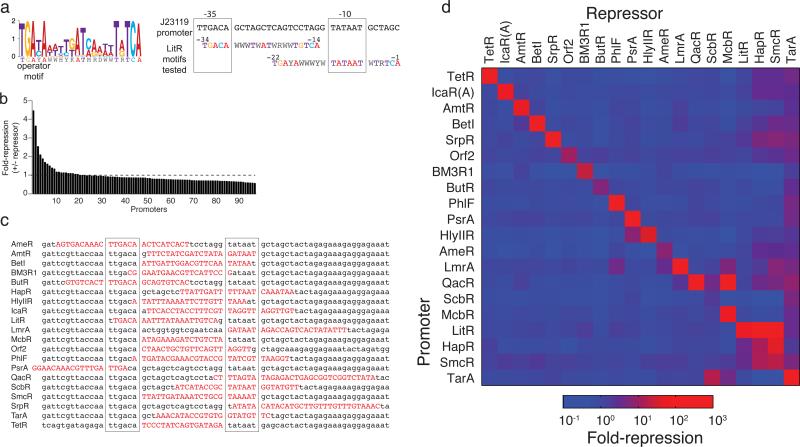
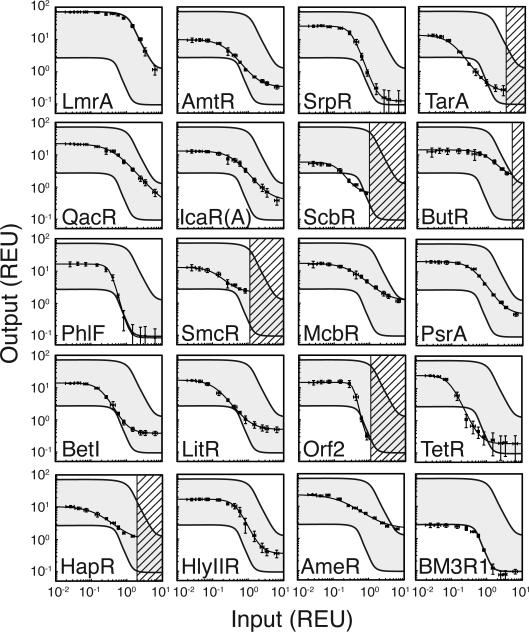
Genetic circuits perform computational operations based on interactions between freely diffusing molecules within a cell. When transcription factors are combined to build a circuit, unintended interactions can disrupt its function. Here, we apply 'part mining' to build a library of 73 TetR-family repressors gleaned from prokaryotic genomes. The operators of a subset were determined using an in vitro method, and this information was used to build synthetic promoters. The promoters and repressors were screened for cross-reactions. Of these, 16 were identified that both strongly repress their cognate promoter (5- to 207-fold) and exhibit minimal interactions with other promoters. Each repressor-promoter pair was converted to a NOT gate and characterized. Used as a set of 16 NOT/NOR gates, there are >10(54) circuits that could be built by changing the pattern of input and output promoters. This represents a large set of compatible gates that can be used to construct user-defined circuits.


Figures

Figure 1
Figure 1. A large repressor library is compiled using genome mining
(a) A genetic NOT gate (symbol shown) can be built using a repressor (pink arrow) that binds to an operator (pink box) in an output promoter. (b) The pipeline for the discovery and characterization of orthogonal repressors is shown. The second panel depicts a portion of the CSI microarray used to determine the operator sequence. (c) The complete library of 73 synthesized repressors (plus TetR) are organized into a phylogenetic tree diagram, where carets indicate those repressors that appear in the final orthogonality matrix illustrated in Figure 3d. The tree was aligned based on respective repressor protein sequences and branch lengths correspond to relative divergence in amino acid sequence. The sequences and sources of each repressor are provided in Supplementary Data Set 1. The two IcaR orthologs originate from two distinct host organisms where (A) indicates Staphylococcus aureus and (E) indicates Staphylococcus epidermidis.
Figure 2
Figure 2. The identification of operator sequences using an in vitro array assay
(a) The hairpin sequences used to build the array correspond to a 28-mer inverted repeat sequence. N's indicate that all nucleotides are allowed at that position. The arrows above the hairpin mark each 14-mer half site and indicate the axis of symmetry for the palindrome. The variable region is surrounded by GC-clamps on both the 5’ and 3’ ends, and the hairpin contains a GGA loop to induce hairpin formation. The 3’ end is tethered to the array surface via a flexible linker. (b) Operators are shown for those repressors that yielded well-conserved sequence motifs.
Figure 3
Figure 3. Design and screening of orthogonal promoters
(a) Degeneracy in operator sequences (Figure 2b) is converted into a single motif. The LitR motif is shown (W is A/T, H is A/T/C, Y is T/C, K is G/T, M is C/A, R is A/G, and D is A/T/G). The degenerate operator is placed in the BBa_J23119 constitutive promoter spanning either the -35 or -10 element (right panel). (b) The results of screening the LitR promoter library are shown. The fold-repression is calculated as the ratio of fluorescence from the promoter alone and that obtained when the repressor is present and uninduced for a single replicate. (c) The best promoters identified in the screens are shown for each repressor that are part of the final set of 20 repressors. The operator sequence is shown in capital red letters and the Shine-Delgarno as bold letters. Those promoters lacking the Shine-Delgarno sequence contain this sequence adjacent to the 3’ end of the sequence listed; when not shown, the sequence up to the ATG start is identical. (d) The promoters driving YFP expression are carried on a p15a plasmid and the repressors are under HSL-inducible control on a ColE1 plasmid (Supplementary Figure 5 and 4, respectively). The matrix has been sorted by eye, such that the most orthogonal promoters appear at the top and the least at the bottom, and similar patterns of cross-reactivity are clustered together. Repressor expression is induced by 20 μM HSL (except in the case where such concentrations of HSL are toxic, including HapR, Orf2, ScbR, SmcR which were induced with 2 μM, 0.02 μM, 0.2 μM, and 0.2 μM HSL, respectively). The data represent the average of three replicates collected on different days.
Figure 4
Figure 4. Response function measurement
The response functions are measured using the IPTG-inducible PTac promoter as an input and measuring the response of the output promoter. The activity of the input promoter is measured separately using YFP. The activities of the input and output promoters are converted to REU. The response functions of the NOT gates are shown. From left to right, the concentration of IPTG is: 0, 5, 10, 20, 30, 40, 50, 70, 100, 150, 200, 500, and 1000 μM. The error bars show the standard deviation of three experiments performed on different days. As a guide to the eye, the highest (LmrA) and lowest (BM3R1) response functions are shown on each plot with the region between them in grey. The dashed regions indicate the levels of expression beyond which toxicity is observed (Supplementary Figures 11 and 12). The data represent the average of three replicates collected on different days, and error bars correspond to the standard deviation between these measurements.
Figure 5
Figure 5. Construction and characterization of integrated circuits
(a) The process of promoter mapping for the assembly of gates into a desired circuit is shown for the NAND circuit. The measured data are grown under conditions of no inducer (−/−), 1 mM IPTG (+/−), 20 μM 3OC6HSL (−/+), and 1 mM IPTG and 20 μM 3OC6HSL (+/+). The bar graph details the measured output levels under all input combinations. Small black bars indicate the predicted output value for the indicated input. The data represent the average of three replicates collected on different days, and error bars correspond to the standard deviation between these measurements. (b) The design, construction, and characterization of the AND circuit is illustrated. Note that when multiple promoters are placed upstream of a repressor, the gate is converted from the NOT to NOR function. The measured data are grown under conditions of no inducer (−/−), 1 mM IPTG (+/−), 100 ng/mL aTc (−/+), and 1 mM and 100 ng/mL aTc (+/+). The bar graph details the measured output levels under all input combinations. Small black bars indicate the predicted output value for the indicated input. The data represent the average of three replicates collected on different days, and error bars correspond to the standard deviation between these measurements.

Comment in

  • Orthogonal logic gates.
    Rusk N. Rusk N. Nat Methods. 2014 Feb;11(2):132. doi: 10.1038/nmeth.2830. Nat Methods. 2014. PMID: 24645198 No abstract available.

References

    1. Weiss R, Knight T., Jr. In: DNA Computing Vol. 2054 Lecture Notes in Computer Science. Condon Anne, Rozenberg Grzegorz., editors. Springer; Berlin Heidelberg: 2001. pp. 1–16. Ch. 1.
    1. Khalil AS, Collins JJ. Synthetic biology: applications come of age. Nature reviews. Genetics. 2010;11:367–379. doi:10.1038/nrg2775. - PMC - PubMed
    1. Weber W, Fussenegger M. Molecular diversity--the toolbox for synthetic gene switches and networks. Current opinion in chemical biology. 2011;15:414–420. doi:10.1016/j.cbpa.2011.03.003. - PubMed
    1. Endy D. Foundations for engineering biology. Nature. 2005;438:449–453. doi:10.1038/nature04342. - PubMed
    1. Purnick PE, Weiss R. The second wave of synthetic biology: from modules to systems. Nature reviews. Molecular cell biology. 2009;10:410–422. doi:10.1038/nrm2698. - PubMed

Publication types

Substances