. 2014 Jan;124(1):174-87.
doi: 10.1172/JCI70103. Epub 2013 Dec 9.

Diverting T helper cell trafficking through increased plasticity attenuates autoimmune encephalomyelitis

Diverting T helper cell trafficking through increased plasticity attenuates autoimmune encephalomyelitis

Danielle Califano et al. J Clin Invest. 2014 Jan.

Abstract

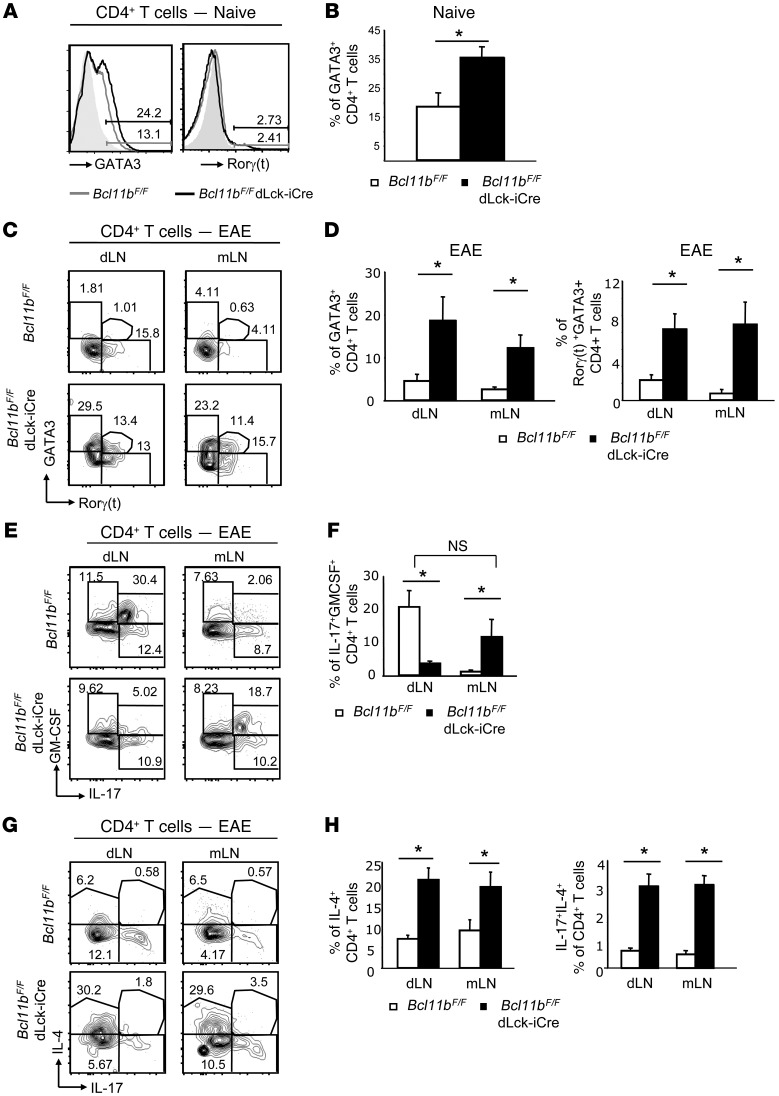
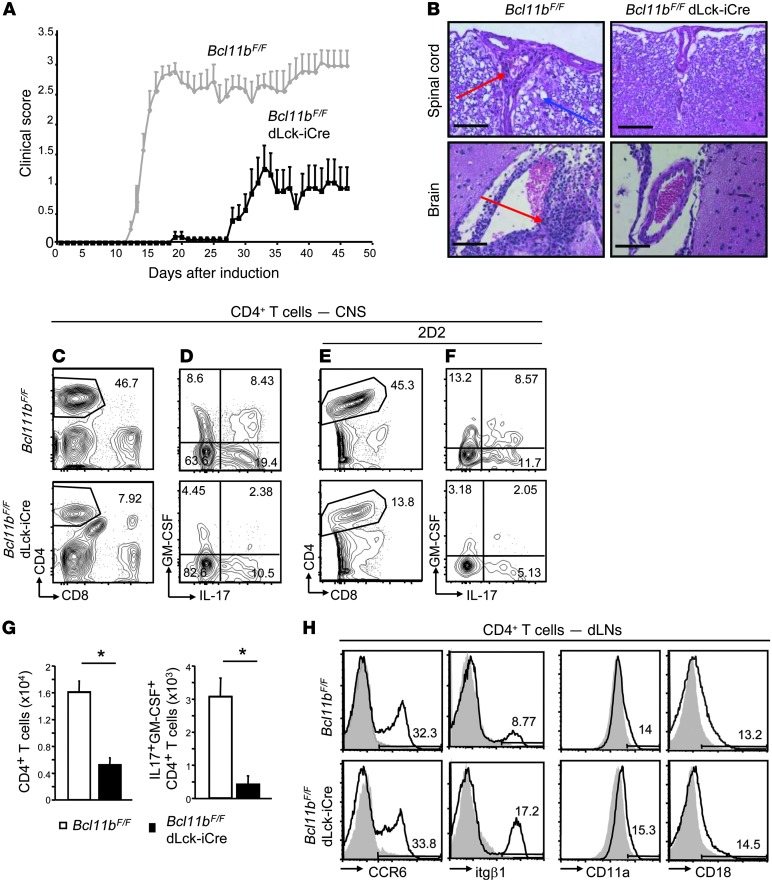
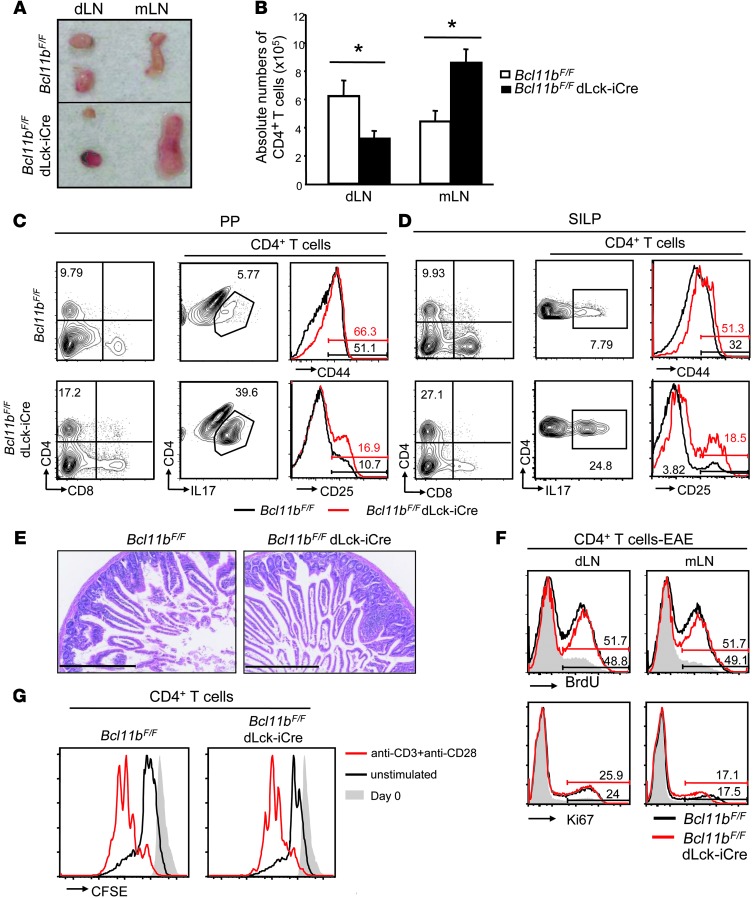
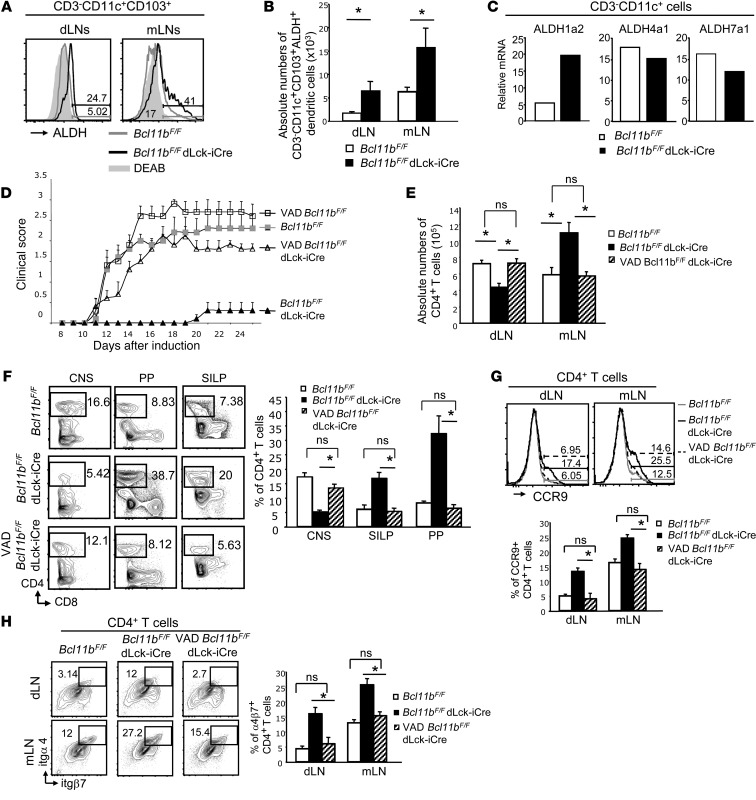
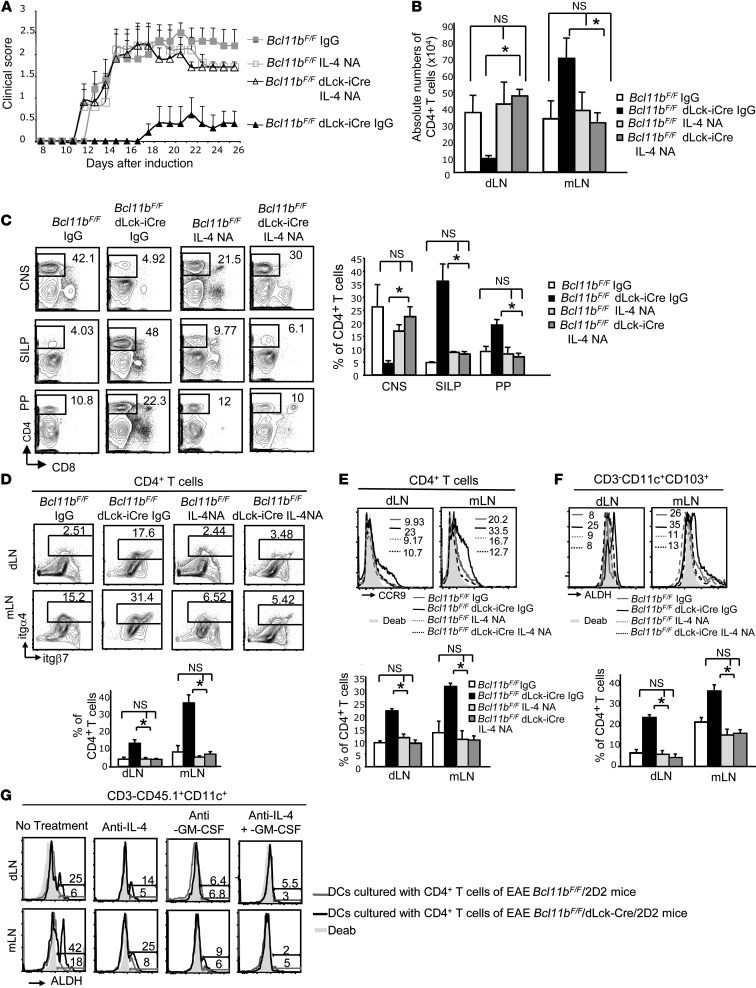
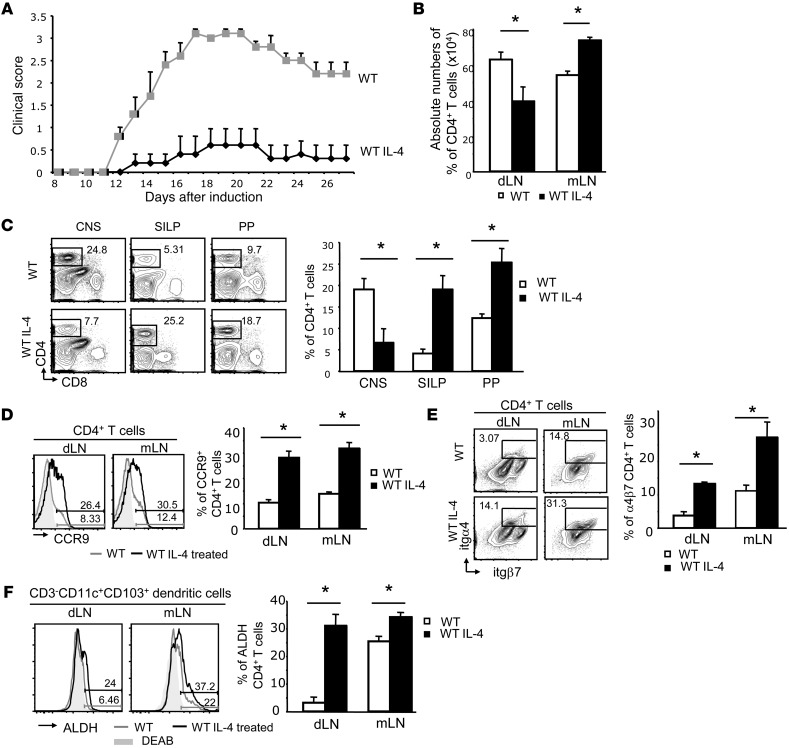
Naive T helper cells differentiate into functionally distinct effector subsets that drive specialized immune responses. Recent studies indicate that some of the effector subsets have plasticity. Here, we used an EAE model and found that Th17 cells deficient in the transcription factor BCL11B upregulated the Th2-associated proteins GATA3 and IL-4 without decreasing RAR-related orphan receptor γ (RORγt), IL-17, and GM-CSF levels. Surprisingly, abnormal IL-4 production affected Th17 cell trafficking, diverting migration from the draining lymph nodes/CNS route to the mesenteric lymph nodes/gut route, which ameliorated EAE without overt colitis. T helper cell rerouting in EAE was dependent on IL-4, which enhanced retinoic acid (RA) production by dendritic cells, which further induced expression of gut-homing receptors CCR9 and α4β7 on Bcl11b-deficient CD4+ T cells. Furthermore, IL-4 treatment or Th2 immunization of wild-type mice with EAE caused no alteration in Th17 cytokines or RORγt, but diverted T helper cell trafficking to the gut, which improved EAE outcome without overt colitis. Our data demonstrate that Th17 cells are permissive to Th2 gene expression without affecting Th17 gene expression. This Th17 plasticity has an impact on trafficking, which is a critical component of the immune response and may represent a possible avenue for treating multiple sclerosis.


Figures

Figure 1
Figure 1. CD4+ T cells of Bcl11bF/F/dLck-iCre mice upregulate GATA3 and IL-4, but do not lose expression of Rorγt, IL-17, or GM-CSF during EAE.
(A) GATA3 and Rorγt levels evaluated by FACS analysis in naive CD4+ T cells from LNs of the indicated groups of mice. Gray shaded area indicates negative control. (B) Average frequency of naive CD4+ T cells that express GATA3 in the indicated groups. *P ≤ 0.05, n = 5 (mean ± SEM). (C) FACS analysis of GATA3 and Rorγt levels in CD4+ T cells in the dLNs and mLNs of the indicated groups on day 12 following EAE induction. (D) Average frequency of GATA3+ (left) or GATA3+Rorγt+ (right) CD4+ T cells in the indicated groups. *P ≤ 0.05, n = 5 (mean ± SEM). (E) FACS analysis of frequencies of IL-17– and GM-CSF–producing CD4+ T cells from dLNs and mLNs of the indicated groups on day 12 after EAE induction. (F) Average frequency of IL-17+GM-CSF+CD4+ T cells in the indicated EAE groups. *P ≤ 0.05; NS indicates P > 0.05, n = 5 (mean ± SEM). (G) FACS analysis of frequencies of IL-4– and IL-17–producing CD4+ T cells from dLNs and mLNs of the indicated groups on day 12 after EAE induction. (H) Average frequencies of IL-4+CD4+ T cells (left) and IL-4+IL-17+CD4+ T cells in the indicated groups *P ≤ 0.05, n = 5 (mean ± SEM). Two-tailed Student’s t test was applied to determine significance.
Figure 2
Figure 2. Bcl11bF/F/dLck-iCre mice show delayed onset of EAE with reduced severity caused by diminished CD4+ T cell infiltration in the CNS, without alteration in CNS trafficking receptors.
(A) EAE disease scores of Bcl11bF/F/dLck-iCre (black) and WT (gray) mice following EAE induction, as described in Methods. P ≤ 0.05 starting on day 12, n = 11 (mean ± SEM). Data are representative of 4 independent experiments. (B) H&E staining of spinal cord (top) and brain (bottom) of Bcl11bF/F/dLck-iCre and WT mice 18 days after EAE induction. Scale bars: 200 μm. Red arrows indicate mononuclear infiltrates. Blue arrows indicate tissue damage. (C) FACS analysis of CD4+ T cells in the CNS of Bcl11bF/F/dLck-iCre and WT mice on day 18 following EAE induction. (D) Frequencies of IL-17– and GM-CSF–producing CD4+ T cells in CNS on day 18 after immunization. (E and F) Same as in C and D, in EAE Bcl11bF/F/dLck-iCre/2D2 and 2D2 mice. (G) Absolute numbers of CD4+ T cells (left) and CD4+IL-17+GM-CSF+ (right) in the CNS of EAE Bcl11bF/F/dLck-iCre (black) and WT (white) mice. *P ≤ 0.05, n = 6 (mean ± SEM). (H) FACS analysis of CCR6, itgβ1, CD11a, and CD18 levels on CD4+ T cells from dLNs of the indicated EAE mice on day 12 following EAE induction. In all plots, gray shaded area indicates negative control. Two-tailed Student’s t test was applied to determine significance.
Figure 3
Figure 3. CD4+ T cells of EAE Bcl11bF/F/dLck-iCre mice accumulate in the enlarged mLNs, Peyer patches, and SILP, proliferate normally, and do not cause overt colitis.
(A) Gross anatomy of dLNs and mLNs from the indicated EAE groups on day 12 after EAE induction. Data are representative of 10 pairs. (B) Absolute numbers of CD4+ T cells in the indicated groups and tissues on day 12 after EAE induction. *P ≤ 0.05; n = 10 (mean ± SEM). (C and D) FACS analysis of CD4, and IL-17, CD44 and CD25 within the CD4+ T cells–gated population in Peyer patches (PP) (C) and SILP (D) on day 18 after EAE induction. (E) H&E staining of small intestine sections of the indicated groups on day 18 after EAE induction. Scale bars: 400 μm. Data in CE are representative of 3 pairs of mice. (F) FACS analysis of BrdU incorporation (top) and Ki67 levels (bottom) in the indicated tissues and groups of EAE mice. Data are representative of 3 pairs of mice. (G) Proliferation of Bcl11b-deficient and WT cells evaluated by CFSE dilution. Naive CD4+ T cells of Bcl11bF/F/dLck-iCre/2D2 and Bcl11bF/F/2D2 mice were labeled with CFSE and incubated for 3 days with plate-bound anti-CD3 and soluble anti-CD28, followed by FACS analysis of CFSE dilution. Red lines indicate CFSE levels following 3 days of treatment; black lines indicate unstimulated cells after 3 days; and gray shaded areas indicate CFSE levels on day 0. Data are representative of 3 pairs of mice.
Figure 4
Figure 4. EAE amelioration and preferential gut homing in EAE Bcl11bF/F/dLck-iCre mice are dependent on the upregulation of gut-homing markers on CD4+ T cells.
(A and B) FACS analysis of CCR9 (A) and itg4/itgβ7 (B) on CD4+ T cells from dLNs and mLNs of EAE Bcl11bF/F/dLck-iCre (black) and WT (gray) mice on day 12 after EAE induction. Gray shaded areas indicate negative control. Right panels show average frequencies of CCR9 and α4β7 levels on CD4+ T cells from the dLNs and mLNs of the indicated EAE mice. *P ≤ 0.05, n = 6 (mean ± SEM). (C) Clinical scores of the indicated groups of EAE mice treated with anti–α4β74β7NA) or IgG, as described in Methods. P > 0.05 after day 13 for all, except Bcl11bF/F/dLck-iCre, in which P ≤ 0.05, n = 5 (mean ± SEM). Data are representative of 3 independent experiments. (D) FACS analysis of CD4+ T cells in the CNS and SILP of the indicated groups of mice on day 18 following EAE induction. Bottom panel shows average frequency of CD4+ T cells in the CNS and SILP in the indicated groups of mice.*P ≤ 0.05; NS indicates P > 0.05, n = 4 (mean ± SEM).
Figure 5
Figure 5. Gut homing of CD4+ T cells and disease amelioration in EAE Bcl11bF/F/dLck-iCre mice is dependent on RA production.
(A) ALDH activity in CD3CD11c+CD103+ dendritic cells from the indicated tissues and groups of EAE mice day 12 after EAE induction, evaluated as described in Methods. (B) Absolute numbers of ALDH+CD3CD11c+CD103+ dendritic cells in the indicated tissues and groups of EAE mice. *P ≤ 0.05; n = 9 (mean ± SEM). (C) RT-qPCR for ALDH1a2 (RALDH2), ALDH4a1, and ALDH7a1 in sorted CD3CD11c+ dendritic cells of the indicated groups of mice on day 12 after EAE induction. Data are representative of 2 independent experiments with 2 mice per group. (D) EAE scores of the indicated groups of mice on VAD versus normal diet. P ≤ 0.05 for VAD/Bcl11bF/F/dLck-iCre mice versus Bcl11bF/F/dLck-iCre mice starting on day 12; n = 6 (mean ± SEM). Data are representative of 3 independent experiments. (E) Absolute numbers of CD4+ T cells from the indicated tissues and groups on day 12 after EAE induction. *P ≤ 0.05; NS indicates P > 0.05, n = 5 (mean ± SEM). (F) Frequencies of CD4+ T cells (left) and average frequencies (right) in indicated tissues and groups on day 18 after EAE induction. *P ≤ 0.05; NS, P > 0.05, n = 5 (mean ± SEM). (G and H) FACS analysis (top) and average frequencies (bottom) of CCR9 (G) and α4β7 integrin (H) on CD4+ T cells from the indicated tissues and groups on day 12 after EAE induction. *P ≤ 0.05; NS, P > 0.05, n = 5 (mean ± SEM). Two-tailed Student’s t test was applied to determine significance in all cases.
Figure 6
Figure 6. IL-4 is essential for increased RALDH activity in dendritic cells, upregulation of gut-homing receptors, and CD4+ T cell rerouting and disease amelioration in EAE Bcl11bF/F/dLck-iCre mice.
(A) EAE scores of the indicated groups, treated with IL-4NA or IgG. P ≤ 0.05 for Bcl11bF/F/dLck-iCre IL-4NA–treated versus IgG-treated, starting with day 12; n = 5 per group (mean ± SEM). (B) Absolute numbers of CD4+ T cells in the indicated groups on day 12 after EAE induction.*P ≤ 0.05; NS, P > 0.05, n = 6 (mean ± SEM). (C) Frequencies by FACS analysis (left) and average frequencies (right) of CD4+ T cells in the indicated tissues and groups on day 18 after induction. *P ≤ 0.05; NS, P > 0.05, n = 4 (mean ± SEM). (D and E) α4β7 integrin (D) and CCR9 (E) evaluated by FACS analysis on CD4+ T cells from dLNs and mLNs of the indicated groups on day 12 after EAE induction. (F) Flow cytometry analysis of ALDH activity in CD3CD11c+CD103+ dendritic cells from mLNs and dLNs of the indicated groups on day 12 after EAE induction. (DF) Lower panels show the average frequencies of the data in the panels above. *P ≤ 0.05; NS, P > 0.05; n = 4 (mean ± SEM). (G) FACS analysis of ALDH activity in MOG35–55 pulsed dendritic cells from 45.1/Rag2–/– mice following 3 days in culture with CD45.2+CD4+ T cells from dLNs and mLNs of the indicated groups in conditions that block IL-4, GM-CSF, or both, or without treatment. Data are representative of 3 pairs of mice. Two-tailed Student’s t test was applied to determine significance in all cases.
Figure 7
Figure 7. Treatment of EAE WT mice with IL-4 results in disease amelioration, CD4+ T cell migration to the gut, increased RALDH activity in dendritic cells, and upregulation of gut-homing markers on CD4+ T cells.
(A) EAE scores in WT mice treated with recombinant IL-4 (WT IL-4) versus saline-treated controls (WT). P ≤ 0.05 after day 12; n = 5 (mean ± SEM). (B) Absolute numbers of CD4+ T cells from dLNs and mLNs of the indicated groups on day 12 after EAE induction. *P ≤ 0.05; n = 4 (mean ± SEM). (C) FACS analysis of frequencies (left) and average frequencies (right) of CD4+ T cells in the CNS, SILP, and Peyer patches in the indicated groups on day 18 following EAE induction. *P ≤ 0.05, n = 4 (mean ± SEM). (D) FACS analysis of CCR9 levels on CD4+ T cells (left) and average frequencies of CCR9+CD4+ T cells (right) from dLNs and mLNs of the indicated groups. *P ≤ 0.05, n = 4 (mean ± SEM). (E) FACS analysis of α4β7 levels on CD4+ T cells (left) and average frequencies of α4β7+CD4+ T cells (right) from dLNs and mLNs of indicated groups. *P ≤ 0.05, n = 4 (mean ± SEM). (F) ALDH activity in dendritic cells from dLNs and mLNs of EAE mice treated with IL-4 or saline. Right panel shows average frequencies of ALDH-producing cells. *P ≤ 0.05, n = 4 (mean ± SEM). The gray shaded areas represent DEAB-treated samples. Two-tailed Student’s t test was applied to determine significance in all cases.
Figure 8
Figure 8. Treatment of EAE WT mice under Th2 conditions reduces clinical scores, causing redistribution of the CD4+ T cells from the dLNs-CNS route to the mLNs-gut without overt colitis.
(A) EAE scores in WT mice treated with either MOG35–55 in alum plus Pam3CSK4 (WT MOG/alum) or alum alone (WT/alum) on day 7 after EAE induction. P ≤ 0.05 after day 12; n = 7 (mean ± SEM). Data are representative for 3 experiments. (B) Absolute numbers of CD4+ T cells from dLNs and mLNs from the indicated groups on day 12 after EAE induction. *P ≤ 0.05, n = 6 (mean ± SEM) (C) Gross anatomy of dLNs, mLNs, and Peyer patches on day 12 after EAE induction in the indicated groups. (D) FACS analysis of frequencies (left) and average frequencies (right) of CD4+ T cells in the CNS, Peyer patches, and SILP from the indicated groups on day 18 after EAE induction. *P ≤ 0.05, n = 5 (mean ± SEM). (E) CCR6 levels on CD4+ T cells from dLNs and mLNs of the indicated groups of EAE mice. (F and G) CCR9 and α4β7 levels on CD4+ T cells from dLNs and mLNs of the indicated groups of EAE mice. *P ≤ 0.05, n = 5 (mean ± SEM). (H) ALDH activity in dendritic cells from dLNs and mLNs of the indicated groups. *P ≤ 0.05, n = 5 (mean ± SEM). (I) H&E staining of small intestine sections of the indicated groups of mice on day 30 after EAE induction. Scale bars: 500 μm. Data are representative of 3 pairs of mice. Significance was determined by 2-tailed Student’s t test in all cases.

References

    1. Szabo SJ, Kim ST, Costa GL, Zhang X, Fathman CG, Glimcher LH. A novel transcription factor, T-bet, directs Th1 lineage commitment. Cell. 2000;100(6):655–669. doi: 10.1016/S0092-8674(00)80702-3. - DOI - PubMed
    1. Zheng W, Flavell RA. The transcription factor GATA-3 is necessary and sufficient for Th2 cytokine gene expression in CD4 T cells. Cell. 1997;89(4):587–596. doi: 10.1016/S0092-8674(00)80240-8. - DOI - PubMed
    1. O’Shea JJ, Paul WE. Mechanisms underlying lineage commitment and plasticity of helper CD4+ T cells. Science. 2010;327(5969):1098–1102. doi: 10.1126/science.1178334. - DOI - PMC - PubMed
    1. Ivanov II, et al. The orphan nuclear receptor RORgammat directs the differentiation program of proinflammatory IL-17+ T helper cells. Cell. 2006;126(6):1121–1133. doi: 10.1016/j.cell.2006.07.035. - DOI - PubMed
    1. Codarri L, et al. RORgammat drives production of the cytokine GM-CSF in helper T cells, which is essential for the effector phase of autoimmune neuroinflammation. Nat Immunol. 2011;12(6):560–567. doi: 10.1038/ni.2027. - DOI - PubMed

Publication types

MeSH terms