
MYC-driven accumulation of 2-hydroxyglutarate is associated with breast cancer prognosis

Atsushi Terunuma et al. J Clin Invest. 2014 Jan.

Abstract

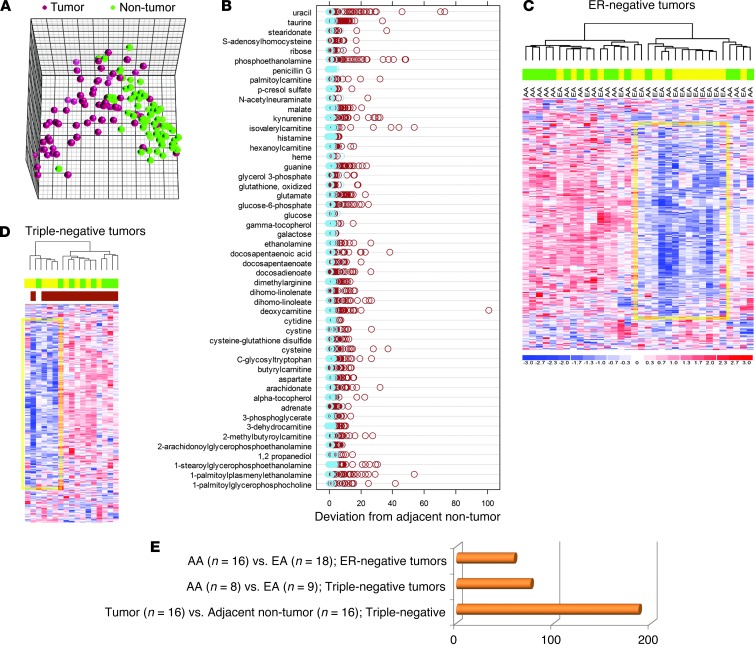
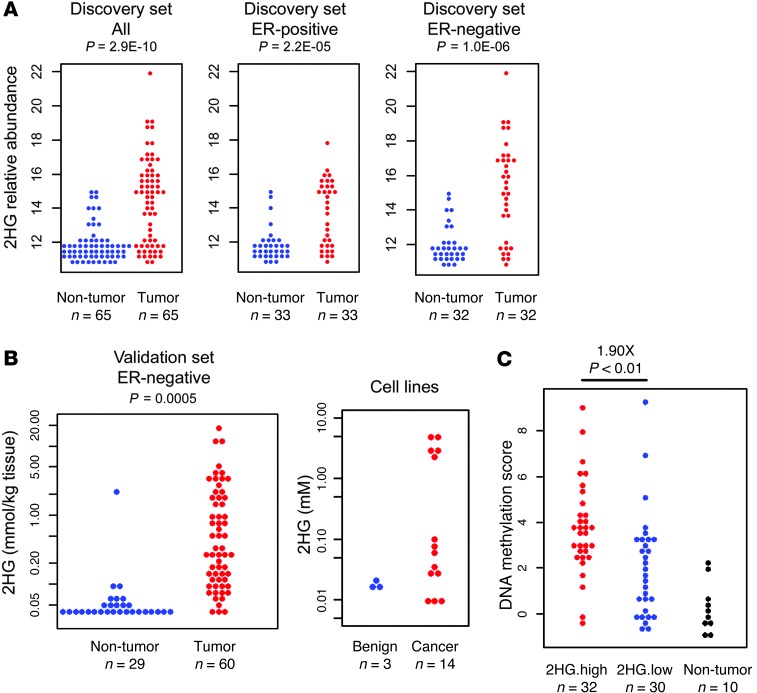
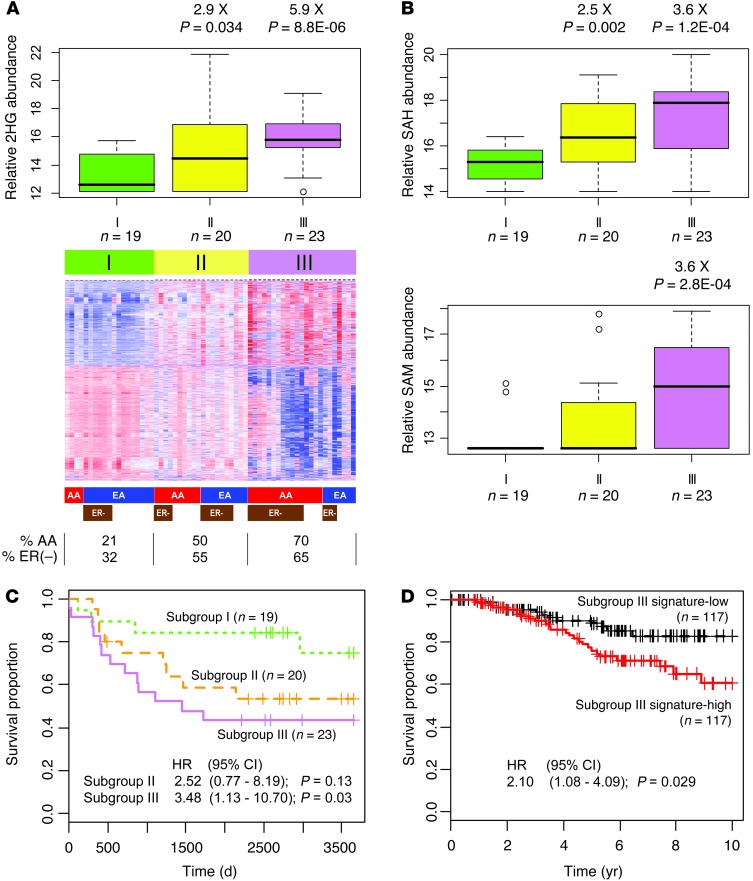
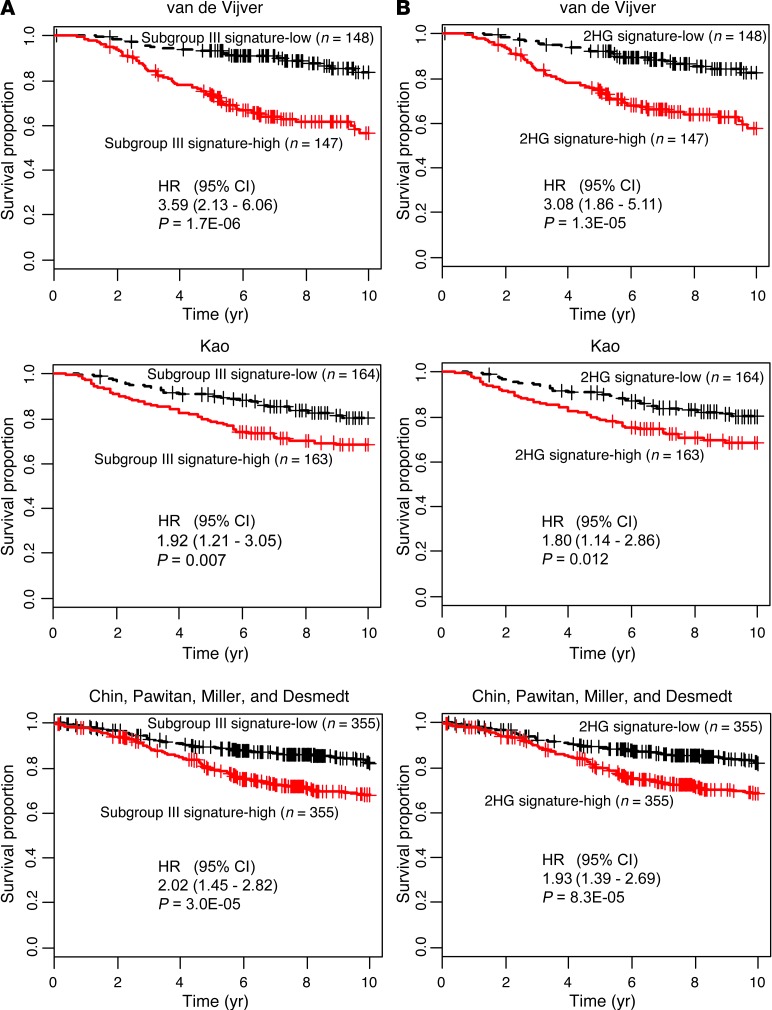
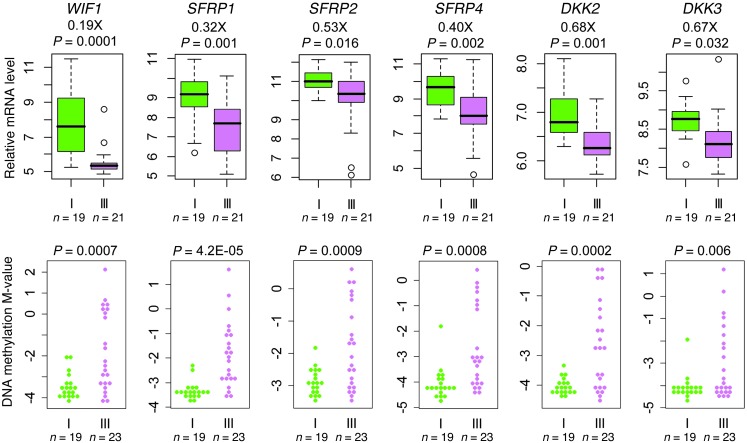
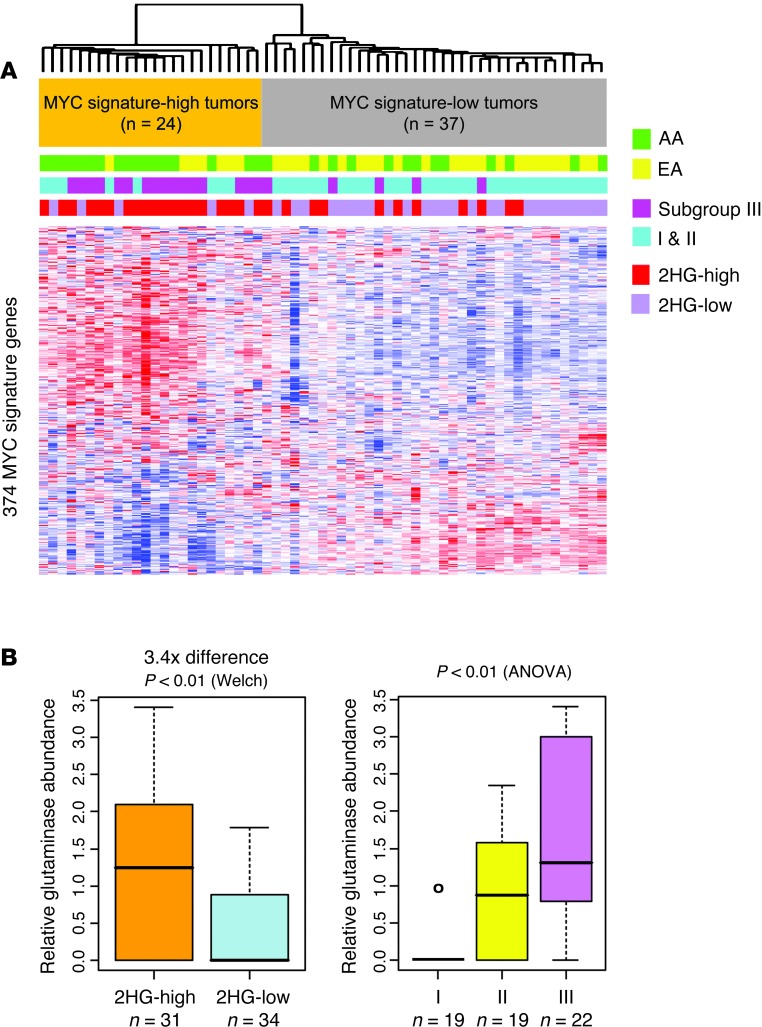
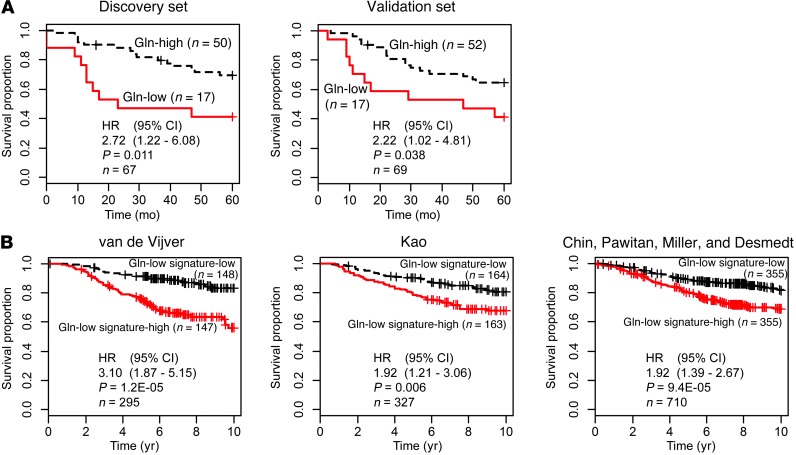
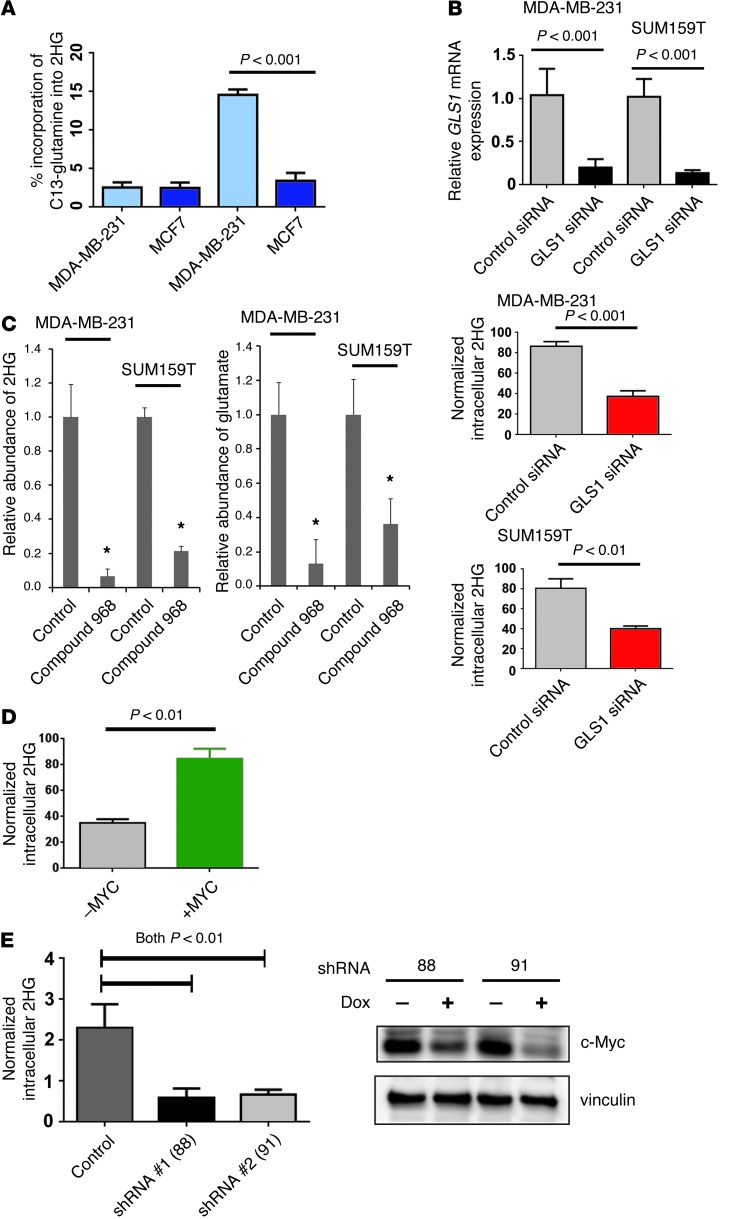
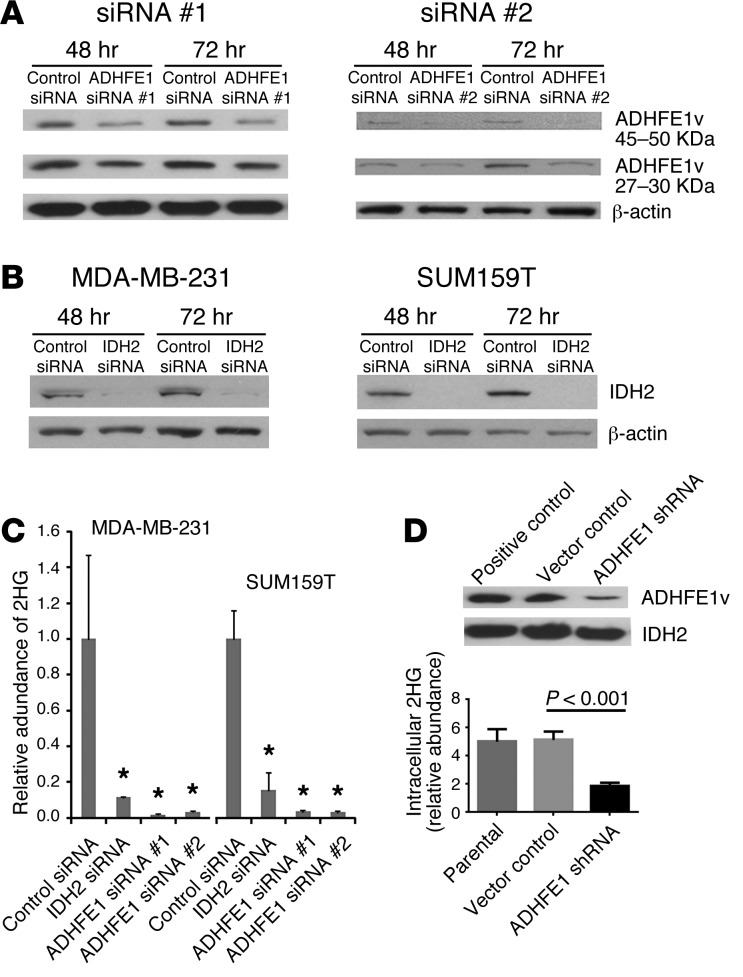
Metabolic profiling of cancer cells has recently been established as a promising tool for the development of therapies and identification of cancer biomarkers. Here we characterized the metabolomic profile of human breast tumors and uncovered intrinsic metabolite signatures in these tumors using an untargeted discovery approach and validation of key metabolites. The oncometabolite 2-hydroxyglutarate (2HG) accumulated at high levels in a subset of tumors and human breast cancer cell lines. We discovered an association between increased 2HG levels and MYC pathway activation in breast cancer, and further corroborated this relationship using MYC overexpression and knockdown in human mammary epithelial and breast cancer cells. Further analyses revealed globally increased DNA methylation in 2HG-high tumors and identified a tumor subtype with high tissue 2HG and a distinct DNA methylation pattern that was associated with poor prognosis and occurred with higher frequency in African-American patients. Tumors of this subtype had a stem cell-like transcriptional signature and tended to overexpress glutaminase, suggestive of a functional relationship between glutamine and 2HG metabolism in breast cancer. Accordingly, 13C-labeled glutamine was incorporated into 2HG in cells with aberrant 2HG accumulation, whereas pharmacologic and siRNA-mediated glutaminase inhibition reduced 2HG levels. Our findings implicate 2HG as a candidate breast cancer oncometabolite associated with MYC activation and poor prognosis.


Figures

Figure 1
Figure 1. Differences in metabolite patterns between breast tumors and adjacent noncancerous tissues and AA and EA patients.
(A) Principal component analysis for breast tumors (n = 67) and adjacent noncancerous tissues (n = 65) using the top 50 metabolites that showed the most different abundance across tissues. These metabolites were detected in >80% of all samples. (B) Z-score plots representing the deviation of the 50 metabolites in tumor (brown) and adjacent noncancerous tissue pairs (light blue; n = 65) from the average of the noncancerous tissues in linear scale. (C and D) Unsupervised hierarchical clustering of ER-negative (C, n = 34, 16 AA and 18 EA) and triple-negative (D, n = 17, 8 AA and 9 EA) breast tumors based on 296 named metabolites. Colors denote sample classes (green, AA; yellow, EA) or basal-like subtype in D (brown, n = 15). Yellow frames in C and D highlight metabolites decreased in a subset of breast tumors, representing mostly EA patients. (E) Number of differential metabolites (fold change, >2.5 or <0.4; FDR, <5%) in the comparisons in C and D.
Figure 2
Figure 2. Aberrant accumulation of 2HG in breast cancer and its relationship with genome-wide DNA methylation in breast tumors.
(A) Relative abundance of 2HG in breast tumors and adjacent noncancerous tissue for all paired samples (n = 65, 33 ER-positive and 32 ER-negative) for the discovery set. (B) 2HG quantitation for ER-negative tumor (n = 60) and adjacent noncancerous tissue (n = 29) in the validation set. P value was determined by paired t test (n = 29). Relative abundance of 2HG in 3 benign and 14 cancerous human breast cell lines is also shown. (C) Normalized genome-wide DNA methylation scores were calculated for breast tumors in the discovery set using Human Methylation 450 BeadChips data. 2HG-high tumors (median and above) had a significantly higher DNA methylation score than 2HG-low tumors (below median), as determined by Welch t test.
Figure 3
Figure 3. A poor outcome tumor subgroup defined by DNA methylation and metabolite profiles.
(A) Heat map representing 2,102 probes highlighting breast tumor subgroups I–III with distinct DNA methylation profiles. Colored bars below the heat map indicate sample classes: red, AA; blue, EA; brown, ER-negative. Percent AA and ER-negative cases in each subgroup is also shown. Box plots above show relative abundance of 2HG in each subgroup (box, interquartile range; line within box, median). Subgroup I is reference for fold difference. (B) Box plots representing relative abundance of SAH and SAM by subgroup. (C) Subgroup III tumors were associated with poor outcome. Kaplan-Meier curves with Cox regression analysis results are shown. HR, hazard ratio. (D) Association between subgroup III DNA methylation signature and breast cancer–specific survival in a publicly available dataset (22). The survival of patients with the subgroup III DNA methylation signature (Subgroup III signature-high) was significantly poorer than that of other patients. Kaplan-Meier curves with Cox regression analysis results are shown.
Figure 4
Figure 4. Gene signatures for subgroup III and 2HG-high tumors are predictors of poor survival.
(A) Association between the gene signature for subgroup III and breast cancer survival. Survival of patients with the gene expression signature of subgroup III (Subgroup III signature-high) was significantly decreased in 3 independent datasets (van de Vijver, ref. , n = 295; Kao, ref. , n = 327; Chin, Pawitan, Miller, and Desmedt, refs. –, n = 710). To generate the subtype III gene expression signature, subtype III and subtype I breast tumors were compared to identify 159 and 296 genes that were consistently up- and downregulated, respectively, in subtype III tumors. (B) Association between the gene signature for 2HG-high tumors and breast cancer survival. Survival of patients with the gene expression signature of 2HG-high tumors (2HG signature-high) was significantly decreased in the 3 independent datasets shown in A. Breast tumors with high levels of 2HG (top 33%) and low levels of 2HG (lowest 33%) were compared to identify 50 and 127 genes that were consistently up- and downregulated, respectively, in 2HG-high tumors. Kaplan-Meier curves with Cox regression analysis results are shown.
Figure 5
Figure 5. WNT pathway deregulation in subgroup III tumors.
Box plots show relative gene expression levels, and bee swarm plots show DNA methylation M-values, of genes encoding various inhibitors of the WNT signaling pathway, including Wnt inhibitory factor 1 (WIF1), secreted frizzled-related protein 1 (SFRP1), SFRP2, SFRP4, Dickkopf-related protein 2 (DKK2), and DKK3, in subgroup I (n = 19) and subgroup III (n = 23). Expression of WNT pathway inhibitors was significantly reduced in subgroup III tumors (Welch test). Data were collected using GeneChip Human Gene 1.0 ST arrays and Human Methylation 450 BeadChips.
Figure 6
Figure 6. Subgroup III/2HG-high tumors are defined by a MYC activation signature.
(A) Heatmap for gene expression (374 MYC signature genes); colored bars above denote sample classes. Breast tumors were classified as having high or low MYC signature expression based on the presence or absence of a previously described core MYC gene expression signature (24). This classification revealed substantial overrepresentation of tumors from AA patients, DNA methylation subgroup III tumors, and 2HG-high tumors among the class of tumors with MYC activation. (B) Glutaminase was upregulated in 2HG-high versus 2HG-low tumors (3.4-fold; FDR, 0%) and in subgroup III versus subgroup I or II tumors (2.7-fold, subgroup III vs. subgroup I; FDR, 0%). Glutaminase protein abundance in tissue extracts was determined by mass spectrometry. Black lines in box plots denote medians. n and statistical analysis are indicated.
Figure 7
Figure 7. Association of tumor glutamine levels with breast cancer survival.
(A) Patients with low tumor glutamine levels (Gln-low) exhibited poor outcome in the discovery and validation sets (both with stratification at lowest 25% vs. highest 75%). (B) Survival of patients with the gene expression signature of glutamine-low tumors (Gln-low signature-high) was significantly decreased compared with patients that did not have this tumor signature in 3 publicly available datasets (van de Vijver, ref. ; Kao, ref. ; Chin, Pawitan, Miller, and Desmedt, refs. –67). Breast tumors with low and high glutamine levels were compared (lowest vs. highest quartile) to identify 8 and 25 genes that were consistently up- and downregulated, respectively, in glutamine-low tumors. This 33-gene expression signature for glutamine-low tumors was then applied. Kaplan-Meier curves with Cox regression results are shown.
Figure 8
Figure 8. Glutamine metabolism is linked to aberrant accumulation of 2HG in breast cancer cells.
(A) Incorporation of C13-labeled glutamine into 2HG in MDA-MB-231 (2HG-high) and MCF7 (2HG-low) cells 10 seconds and 3 hours after adding C13-glutamine to the culture medium (n = 3 each). MDA-MB-231 cells, with aberrant 2HG accumulation, incorporated the C13 label into 2HG. (B) Reduced 2HG in breast cancer cells treated with GLS1 siRNA (n = 4 per group; t test). Cell pellets were harvested 48 hours after transfection. (C) Reduced 2HG and glutamate in breast cancer cells treated with the mitochondrial GLS1 inhibitor compound 968 (n = 3 per group; *P < 0.05 vs. control, t test). Cells were treated with 10 μM inhibitor for 48 hours. (D) Increased intracellular 2HG after c-Myc induction (+MYC) in human mammary epithelial cells with an inducible MYC-ER fusion transgene. Cell pellets were harvested 48 hours after induction of c-Myc (3 independent experiments; t test). (E) Knockdown of c-Myc with 2 different doxycycline-inducible shRNA expression constructs (right) caused a significant reduction of aberrantly accumulated 2HG (left) in SUM159T cells (4 independent experiments; t test). Cell pellets were harvested 3 days after shRNA induction. Values are shown normalized to internal standard. All graphs show mean ± SD. See complete unedited blots in the supplemental material.
Figure 9
Figure 9. Reduced 2HG in cells with aberrant 2HG accumulation after knockdown of ADHFE1 and IDH2 expression.
(A) Knockdown of ADHFE1 protein with siRNA. ADHFE1v, splice variant. (B) Knockdown of IDH2 protein with siRNA. (C) Reduced 2HG in breast cancer cells treated with IDH2 or ADHFE1 siRNA (n = 4 per group; *P < 0.05 vs. control, t test). 2HG measurements were performed 48 hours after siRNA transfection. (D) Reduced 2HG in MDA-MB-231 cells expressing a shRNA that targets ADHFE1 (3 independent measurements; t test). Western blot analyses were of whole cell extracts (A and B) or mitochondrial lysates (D). All graphs show mean ± SD. See complete unedited blots in the supplemental material.
Figure 10
Figure 10. Inhibition of apoptosis by 2HG.
MCF10A and MCF12A mammary epithelial cells were cultured in the presence or absence of 1 mM octyl-2HG. For apoptosis induction, cells were kept in DMEM/F12 medium without horse serum and hydrocortisone (–serum). Induction of apoptosis by serum starvation/glucocorticoid withdrawal was measured after 48 and 72 hours using a caspase 3/7 activity assay (values expressed as fluorescence 499/521ex/em; n = 4). Graphs show mean ± SD.

References

    1. Sorlie T, et al. Gene expression patterns of breast carcinomas distinguish tumor subclasses with clinical implications. Proc Natl Acad Sci U S A. 2001;98(19):10869–10874. doi: 10.1073/pnas.191367098. - DOI - PMC - PubMed
    1. van de Vijver MJ, et al. A gene-expression signature as a predictor of survival in breast cancer. N Engl J Med. 2002;347(25):1999–2009. doi: 10.1056/NEJMoa021967. - DOI - PubMed
    1. Paik S, et al. A multigene assay to predict recurrence of tamoxifen-treated, node-negative breast cancer. N Engl J Med. 2004;351(27):2817–2826. doi: 10.1056/NEJMoa041588. - DOI - PubMed
    1. Sreekumar A, et al. Metabolomic profiles delineate potential role for sarcosine in prostate cancer progression. Nature. 2009;457(7231):910–914. doi: 10.1038/nature07762. - DOI - PMC - PubMed
    1. Vander Heiden MG. Targeting cancer metabolism: a therapeutic window opens. Nat Rev Drug Discov. 2011;10(9):671–684. doi: 10.1038/nrd3504. - DOI - PubMed

Publication types

MeSH terms