

doi: 10.1038/nm.3416.
Epub 2013 Dec 8.
Magnetic resonance imaging of tumor glycolysis using hyperpolarized 13C-labeled glucose
Affiliations
- PMID: 24317119
- PMCID: PMC3886895
- DOI: 10.1038/nm.3416
Item in Clipboard
Magnetic resonance imaging of tumor glycolysis using hyperpolarized 13C-labeled glucose
Nat Med.
2014 Jan.
Abstract
In this study, we monitored glycolysis in mouse lymphoma and lung tumors by measuring the conversion of hyperpolarized [U-2H, U-13C]glucose to lactate using 13C magnetic resonance spectroscopy and spectroscopic imaging. We observed labeled lactate only in tumors and not in surrounding normal tissue or other tissues in the body and found that it was markedly decreased at 24 h after treatment with a chemotherapeutic drug. We also detected an increase in a resonance assigned to 6-phosphogluconate in the pentose phosphate pathway. This technique could provide a new way of detecting early evidence of tumor treatment response in the clinic and of monitoring tumor pentose phosphate pathway activity.
Figures
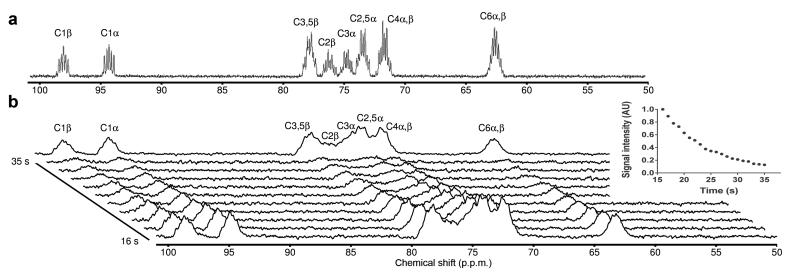
(a)
13C NMR spectrum of [U-2H, U-13C]glucose in vitro. The resonance at 65 p.p.m. is from glucose C6 α,β; the resonances between 72–79 p.p.m. are from glucose C2–5 α,β; and the resonances at 94 and 98 p.p.m. are from glucose C1α and C1β, respectively. All the resonances are split into multiplets due to J-coupling between 13C-13C and 13C-2H. (b) Representative 13C tumor spectra acquired between 16 s and 36 s after the intravenous injection of 0.35 mL 100 mM hyperpolarized [U-2H, U-13C]glucose. For clarity, only every other time point is shown. The top spectrum in the stacked plot is the sum of the first 20 s of data acquisition. The [U-2H, U-13C]glucose signals in the tumor decay with an apparent spinlattice relaxation time, T1, of ~9 s. AU, arbitrary units.

(a) Representative 13C MR spectra acquired from subcutaneous EL4 and LL2 tumors, brain, heart, liver, and kidneys 15 s after the injection of 0.35 mL 100 mM hyperpolarized [U-2H, U-13C]glucose. The lactate spectra are the sum of 4 transients collected over a period of 1 s, whereas a single transient was acquired for the glucose spectra. Flux of hyperpolarized 13C label was only observed between [U-2H, U-13C]glucose (63–99 p.p.m.) and lactate C1 (doublet at ~185 p.p.m.) in EL4 and LL2 tumors. (b) Representative chemical shift selective images obtained ~15 s after intravenous injection of 0.4 mL 200 mM hyperpolarized [U-2H, U-13C]glucose into an EL4 tumor-bearing mouse. The spatial distribution of glucose, urea and lactate are displayed as voxel intensities relative to their respective maxima. The 1H MR images, shown in gray scale, were used to define the anatomical location of the tumor (outlined in white). A urea phantom was included to serve as a reference. The color scales represent arbitrary linearly distributed intensities for the hyperpolarized images.

The spectrum is the sum of 54 transients acquired over a period of 6 s, ~15 s after intravenous injection of 0.4 mL 200 mM hyperpolarized [U-2H, U-13C]glucose. The small difference in signal-to-noise ratios between the glucose and lactate regions of the summed spectrum is the result of interleaved signal acquisition from the glucose and lactate regions, with more sampling of the lactate region (see Methods). The inset shows a ×40 magnification of the 160–220 p.p.m. region. This shows bicarbonate C1 (~164 p.p.m., HCO3−), 6-phosphogluconate C1 (~182 p.p.m., 6PG), lactate C1 (~185 p.p.m.) and dihydroxyacetone phosphate C2 (~214 p.p.m., DHAP). The signals from hyperpolarized [U-2H, U-13C]glucose are located between 63 and 99 p.p.m..
References
-
- Gatenby RA, Gillies RJ. Why do cancers have high aerobic glycolysis? Nature Rev Cancer. 2004;4:891–899. - PubMed
-
- Hsu PP, Sabatini DM. Cancer cell metabolism: Warburg and beyond. Cell. 2008;134:703–707. - PubMed
-
- Cairns RA, Harris IS, Mak TW. Regulation of cancer cell metabolism. Nature Rev Cancer. 2011;11:85–95. - PubMed
-
- Brindle K. New approaches for imaging tumour responses to treatment. Nature Rev Cancer. 2008;8:94–107. - PubMed
Publication types
MeSH terms
Substances
Grants and funding
LinkOut - more resources
Full Text Sources
Other Literature Sources
Medical
